
Email Hosting Services Market Size 2025-2029
The email hosting services market size is forecast to increase by USD 56.34 billion, at a CAGR of 23.1% between 2024 and 2029.
- The market is witnessing significant growth, driven by the increasing demand for cloud-based applications. This trend is particularly prominent in industries such as finance, where email hosting services are essential for secure communication and data protection. However, keeping pace with evolving customer demands poses a challenge for market participants. As businesses continue to prioritize digital transformation and seek more efficient and customized email solutions, service providers must adapt quickly to remain competitive.
- This dynamic market landscape calls for strategic planning and agility from companies seeking to capitalize on opportunities and navigate challenges effectively.
What will be the Size of the Email Hosting Services Market during the forecast period?

Explore in-depth regional segment analysis with market size data - historical 2019-2023 and forecasts 2025-2029 - in the full report.
Request Free Sample
Email hosting services continue to evolve, adapting to the ever-changing needs of businesses across various sectors. These services encompass a range of features, from email clients and collaboration tools to disaster recovery and email archiving. VPS hosting, SMTP servers, mobile access, and pricing models are seamlessly integrated, providing flexibility and customization. Disaster recovery and data backup ensure business continuity, while email security safeguards sensitive information. PCI DSS compliance and integration with third-party applications enhance security and streamline workflows. Virtual mailboxes, webmail access, and spam filtering improve user experience and productivity. Collaboration tools foster teamwork, while email templates and list management simplify email marketing efforts.
Email automation and API integrations enable efficient communication and workflow processes. Subscription plans cater to diverse business sizes and needs. The email hosting market is characterized by continuous innovation, with new features and applications unfolding regularly. Staying informed and adaptable to these evolving trends is crucial for businesses seeking to maximize the potential of their email hosting services.
How is this Email Hosting Services Industry segmented?
The email hosting services industry research report provides comprehensive data (region-wise segment analysis), with forecasts and estimates in "USD million" for the period 2025-2029, as well as historical data from 2019-2023 for the following segments.
- Application
- Large enterprise
- Small and medium-sized enterprises
- Type
- Webmail
- Hosted email
- Deployment
- Private cloud
- Public cloud
- Hybrid cloud
- Geography
- North America
- US
- Canada
- Europe
- France
- Germany
- Italy
- UK
- APAC
- China
- India
- Japan
- South Korea
- Rest of World (ROW)
- North America
By Application Insights
The large enterprise segment is estimated to witness significant growth during the forecast period.
Email hosting services cater to the communication needs of large enterprises, which generate a substantial volume of emails daily for both internal and external communication. These advanced solutions address the complex structures and diverse requirements of massive organizations, offering top-tier security features, compliance tools, and seamless integration with other enterprise software. Top email hosting services prioritize calendar integrations, ensuring schedules align across teams. Click-through rates are closely monitored to gauge email campaign success. DNS management and email delivery rate are essential for maintaining brand reputation and ensuring email deliverability. Dedicated and managed hosting options provide customizable solutions for large enterprises, while customer support and data backup ensure business continuity.
Email forwarding and technical support facilitate efficient communication, while email security, spam filtering, and virus scanning protect sensitive information. Third-party integrations, such as collaboration tools and contact management systems, streamline workflows. Pricing models vary, with options for subscription plans, list management, and email marketing services. Security audits and SSL certificates ensure data privacy, while API integrations and email automation enhance productivity. Cloud hosting and disaster recovery solutions offer scalability and business continuity, while email migration and IMAP servers enable seamless transition to new platforms. Virtual mailboxes, webmail access, and SMTP servers cater to the needs of remote and traveling employees.
Mobile access and email templates simplify communication on the go. Collaboration tools, such as email archiving and VPS hosting, enable efficient teamwork and data access. PCI DSS compliance and email delivery rate monitoring are crucial for industries dealing with financial transactions. In summary, email hosting services for large enterprises prioritize security, compliance, and integration, offering customizable solutions that cater to diverse communication needs and streamline workflows.
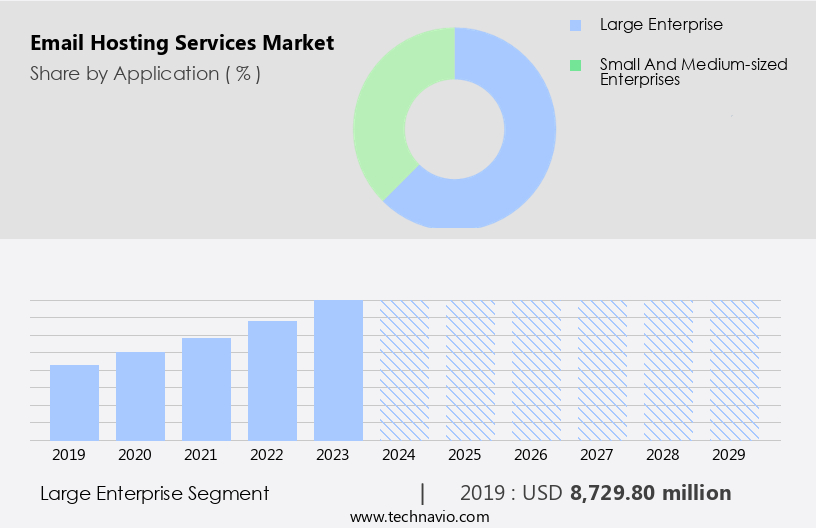
The Large enterprise segment was valued at USD 8.73 billion in 2019 and showed a gradual increase during the forecast period.
Regional Analysis
North America is estimated to contribute 39% to the growth of the global market during the forecast period.Technavio's analysts have elaborately explained the regional trends and drivers that shape the market during the forecast period.

In the dynamic US market, enterprises are increasingly embracing cloud solutions to streamline operations and reduce costs. The market's growth is driven by the strong digital presence in sectors like IT, manufacturing, healthcare, BFSI, retail, and education, with the US being the major contributor in North America. The region's demand is fueled by the need for robust network security and the implementation of bring-your-own-device (BYOD) policies. Email hosting services enable seamless calendar integrations, customer support, and email security, while offering features such as email forwarding, webmail access, spam filtering, and pop3 servers. Collaboration tools, contact management, and email marketing solutions further enhance productivity.
The market's evolution includes the adoption of virtual mailboxes, email templates, and email automation, as well as the integration of third-party applications, API integrations, and security audits. Pricing models cater to various business sizes, from shared hosting to dedicated and managed hosting, VPS hosting, and cloud hosting. Data backup and disaster recovery solutions ensure business continuity, while email archiving and email migration services offer added convenience. SSL certificates, IMAP servers, and storage capacity cater to the evolving needs of modern enterprises. The market's future trends include the adoption of PCI DSS compliance, email delivery rate optimization, and email security enhancements.
Market Dynamics
Our researchers analyzed the data with 2024 as the base year, along with the key drivers, trends, and challenges. A holistic analysis of drivers will help companies refine their marketing strategies to gain a competitive advantage.
In the dynamic and competitive market, businesses and individuals seek reliable and secure solutions to manage their digital communication. Providers offer various plans catering to diverse needs, including IMAP and POP3 access, webmail interfaces, and integrated calendars. Advanced features such as spam filtering, virus protection, and custom branding further enhance user experience. Email hosting services ensure seamless integration with popular applications, enabling efficient collaboration and productivity. With scalable solutions and flexible pricing models, this market continues to evolve, offering innovative solutions to meet the ever-changing demands of digital communication.
What are the key market drivers leading to the rise in the adoption of Email Hosting Services Industry?
- The surge in demand for cloud-based applications serves as the primary catalyst for market growth.
- The shift towards cloud computing is gaining momentum globally due to its cost-effective and flexible nature. Organizations, irrespective of size, are seeking to minimize their capital expenditure (CAPEX) and opt for technologies with lower CAPEX. Small businesses and start-ups are particularly drawn to cloud solutions due to the scalability of hardware and resources provided by cloud service providers. Large organizations, too, are embracing cloud-based services to accommodate fluctuating workloads and avoid the high CAPEX and operating expenditure (OPEX) associated with setting up their own data centers. Cloud-based email hosting services offer several advantages, including: 1. Quick implementation: Cloud-based email hosting services can be easily implemented through web browsers, making the process faster than traditional on-premises solutions.
- 2. Webmail access: Users can access their emails from anywhere using an internet connection, making it more convenient than managing emails through local servers. 3. Spam filtering: Cloud email hosting services offer robust spam filtering capabilities, ensuring that unwanted emails are kept at bay. 4. Virus scanning: These services include virus scanning to protect against potential threats, ensuring the security of your email communications. 5. Integration plugins: Cloud email hosting services offer seamless integration with various productivity tools and applications, enhancing workflow efficiency. 6. Mailing lists: Managing mailing lists becomes easier with cloud email hosting services, enabling effective communication with large groups.
- 7. Contact management: Cloud email hosting services offer comprehensive contact management features, making it easier to maintain and manage your email contacts. 8. Domain registration: Many cloud email hosting services offer domain registration, simplifying the process of setting up a professional email address for your business. 9. POP3 servers: Cloud email hosting services offer POP3 access, allowing users to access their emails offline using email clients. 10. Shared hosting: Cloud email hosting services offer shared hosting options, making it an affordable solution for small businesses and start-ups. 11. Bounce rate monitoring: Cloud email hosting services provide bounce rate monitoring, enabling users to identify and address delivery issues promptly.
- By adopting cloud-based email hosting services, businesses can enjoy the benefits of a scalable, cost-effective, and efficient solution for their email communication needs.
What are the market trends shaping the Email Hosting Services Industry?
- Financial institutions are increasingly adopting email hosting services as a current market trend. This shift towards specialized email solutions ensures enhanced security and compliance with regulatory requirements.
- Email hosting services have become a crucial solution for financial institutions, addressing the demands for 24/7 uptime, interoperability, scalability, and secure storage. By adopting these services, financial institutions eliminate the need to internally host an email server and reduce costs associated with Microsoft Exchange, client access, Server OS licenses, data backup, security, and maintenance. Moreover, customized email platforms with added compliance and security layers are increasingly popular, catering to the unique requirements of the financial sector.
- Companies offering email hosting services are focusing on delivering solutions tailored to their clients' needs, ensuring data security and regulatory compliance. This shift to email hosting services is a strategic move for financial institutions to streamline their operations and enhance overall productivity.
What challenges does the Email Hosting Services Industry face during its growth?
- One significant challenge confronting industry expansion is the complexities involved in adapting to evolving customer demands in a timely manner.
- Email hosting services have gained significant traction in the business world due to their numerous benefits, including subscription plans that cater to various organizational needs, list management tools for effective email marketing campaigns, SSL certificates for secure data transmission, and IMAP servers for seamless access to emails from multiple devices. Cloud hosting enables businesses to store large amounts of data with high storage capacity and ensures a high email delivery rate. The migration process to a new email hosting service can be complex, particularly for companies accustomed to traditional systems.
- However, it can be carried out efficiently, either all at once or in batches. For hybrid solutions, it's crucial to assess which components require migration and retention. A swift migration process can lead to user confusion. Additionally, email hosting services offer API integrations and undergo regular security audits to ensure optimal performance and data protection.
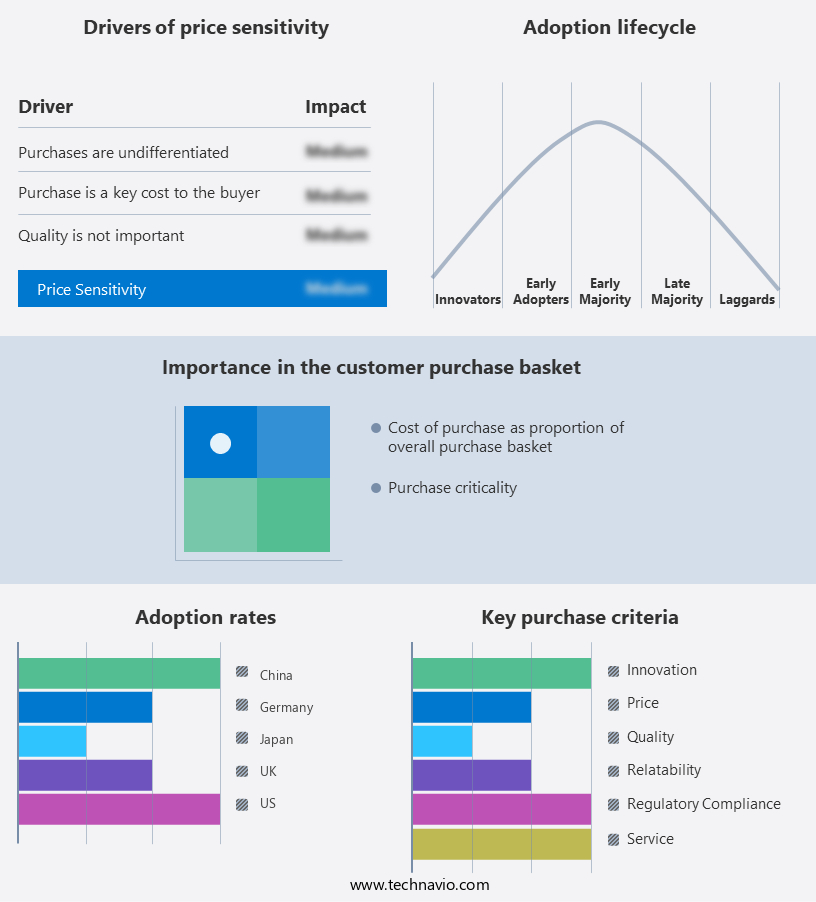
Exclusive Customer Landscape
The email hosting services market forecasting report includes the adoption lifecycle of the market, covering from the innovator's stage to the laggard's stage. It focuses on adoption rates in different regions based on penetration. Furthermore, the email hosting services market report also includes key purchase criteria and drivers of price sensitivity to help companies evaluate and develop their market growth analysis strategies.
Customer Landscape
Key Companies & Market Insights
Companies are implementing various strategies, such as strategic alliances, email hosting services market forecast, partnerships, mergers and acquisitions, geographical expansion, and product/service launches, to enhance their presence in the industry.
A2 Hosting LLC - This company specializes in providing email hosting solutions, enabling users to access their inboxes via POP3, IMAP, and SMTP protocols. Businesses and individuals can rely on these services for efficient email management.
The industry research and growth report includes detailed analyses of the competitive landscape of the market and information about key companies, including:
- A2 Hosting LLC
- Alphabet Inc.
- Amazon.com Inc.
- Digital Energy SS DMCC
- FastComet Inc.
- Fastmail Pty Ltd.
- GoDaddy Inc.
- Greatmail LLC
- Hostinger International Ltd.
- IceWarp Inc.
- Liquid Web LLC
- Microsoft Corp.
- Newfold Digital Inc.
- OVH Groupe SA
- Rackspace Technology Inc.
- Runbox Solutions AS
- SmarterASP.NET
- TMDHosting Inc.
- Unitied Internet AG
- Zoho Corp. Pvt. Ltd.
Qualitative and quantitative analysis of companies has been conducted to help clients understand the wider business environment as well as the strengths and weaknesses of key industry players. Data is qualitatively analyzed to categorize companies as pure play, category-focused, industry-focused, and diversified; it is quantitatively analyzed to categorize companies as dominant, leading, strong, tentative, and weak.
Recent Development and News in Email Hosting Services Market
- In January 2024, Microsoft announced the general availability of Microsoft 365 Mailbox plans with 100GB mailboxes and 1TB storage for Exchange Online, marking a significant leap in email storage capacity for its email hosting service (Microsoft Press Release).
- In March 2024, Google Cloud and Cisco Systems entered into a strategic partnership to integrate Google Workspace and Cisco's Webex Meetings, allowing seamless scheduling and joining of meetings directly from Gmail and Google Calendar (Google Cloud Press Release).
- In April 2025, Rackspace Technology, a leading managed infrastructure solutions provider, acquired Databasix, a German email hosting and productivity solutions provider, expanding its European presence and email hosting capabilities (Rackspace Technology Press Release).
- In May 2025, Amazon Web Services (AWS) launched Amazon WorkMail, a secure, fully managed email and calendar service in the cloud, aimed at enterprise customers seeking an alternative to traditional email hosting solutions (AWS Press Release).
Research Analyst Overview
- The market is characterized by continuous evolution, with a focus on enhancing network infrastructure, email encryption, and filtering to ensure data security and privacy. Software updates and system administration are essential for maintaining high availability and capacity planning. User authentication and multi-factor authentication are critical components of access control, while legal compliance and regulatory standards necessitate the implementation of authentication protocols, data loss prevention, and anti-virus software. Performance monitoring and server-side scripting facilitate business continuity and disaster recovery plans. Email hosting providers invest in anti-spam technology, data encryption, and intrusion detection systems to safeguard against cyber threats and ensure data privacy.
- Network security remains a top priority, with a growing emphasis on data centers and server infrastructure to provide reliable and secure email solutions for businesses.
Dive into Technavio's robust research methodology, blending expert interviews, extensive data synthesis, and validated models for unparalleled Email Hosting Services Market insights. See full methodology.
|
Market Scope |
|
|
Report Coverage |
Details |
|
Page number |
214 |
|
Base year |
2024 |
|
Historic period |
2019-2023 |
|
Forecast period |
2025-2029 |
|
Growth momentum & CAGR |
Accelerate at a CAGR of 23.1% |
|
Market growth 2025-2029 |
USD 56336.4 million |
|
Market structure |
Fragmented |
|
YoY growth 2024-2025(%) |
22.1 |
|
Key countries |
US, Canada, China, Germany, Japan, UK, Italy, South Korea, France, and India |
|
Competitive landscape |
Leading Companies, Market Positioning of Companies, Competitive Strategies, and Industry Risks |
What are the Key Data Covered in this Email Hosting Services Market Research and Growth Report?
- CAGR of the Email Hosting Services industry during the forecast period
- Detailed information on factors that will drive the growth and forecasting between 2025 and 2029
- Precise estimation of the size of the market and its contribution of the industry in focus to the parent market
- Accurate predictions about upcoming growth and trends and changes in consumer behaviour
- Growth of the market across North America, Europe, APAC, South America, and Middle East and Africa
- Thorough analysis of the market's competitive landscape and detailed information about companies
- Comprehensive analysis of factors that will challenge the email hosting services market growth of industry companies
We can help! Our analysts can customize this email hosting services market research report to meet your requirements.
 RIA -
RIA - 
