
Embedded Finance Enablement Platforms Market Size and Growth Forecast 2026-2030
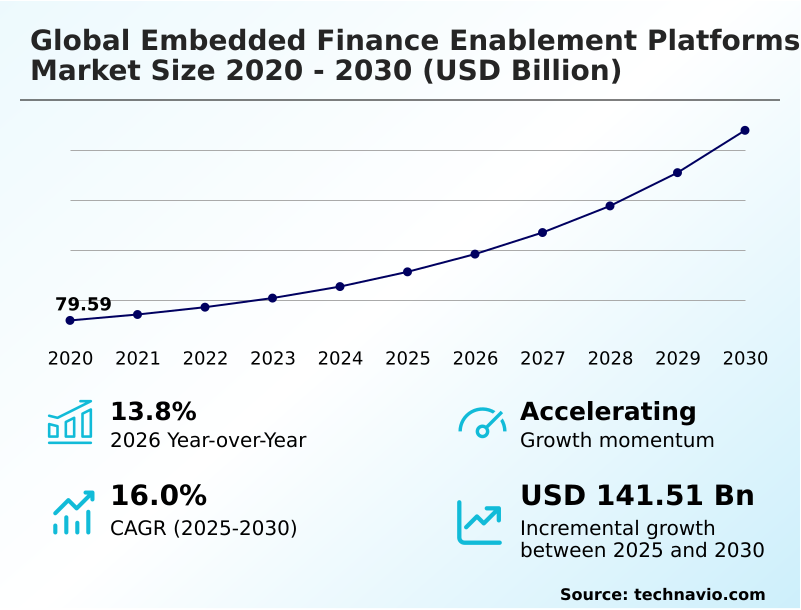
The Embedded Finance Enablement Platforms Market size was valued at USD 128.16 billion in 2025 growing at a CAGR of 16% during the forecast period 2026-2030.
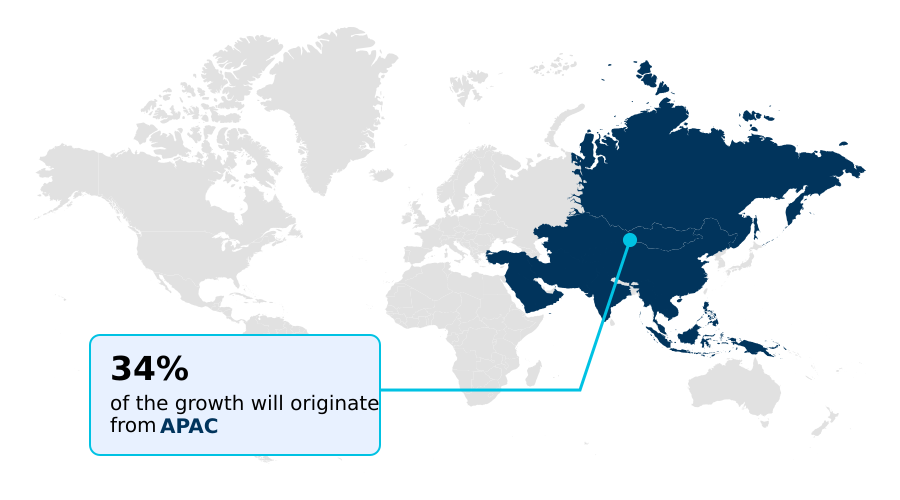
APAC accounts for 34% of incremental growth during the forecast period. The Embedded payments platforms segment by Service was valued at USD 39.71 billion in 2024, while the Retail and e-commerce segment holds the largest revenue share by End-user.
The market is projected to grow by USD 190.08 billion from 2020 to 2030, with USD 141.51 billion of the growth expected during the forecast period of 2025 to 2030.
Get Key Insights on Market Forecast (PDF) Request Free Sample
Embedded Finance Enablement Platforms Market Overview
The embedded finance enablement platforms market is defined by the strategic integration of financial services into non-financial digital ecosystems, a shift contributing to a year-over-year market expansion of 13.8%. This growth is propelled by the escalating demand for frictionless user experiences and the pursuit of revenue stream diversification by enterprises. Open banking APIs, governed by frameworks like the Consumer Data Right in Australia, are critical in facilitating secure financial data connectivity between incumbent institutions and technology firms. In a typical use case, a vertical SaaS provider serving the logistics industry embeds contextual insurance products and trade finance directly into its platform. By leveraging a modular finance solution, the provider can offer usage-based insurance APIs for cargo and instant working capital against freight invoices, improving cash flow for its small business clients and increasing its own platform's stickiness. This integration of B2B embedded lending and real-time credit checks transforms operational software into a comprehensive financial hub, with APAC poised to contribute 34% of the market's incremental growth.
Drivers, Trends, and Challenges in the Embedded Finance Enablement Platforms Market
Enterprises are increasingly turning to embedded finance enablement platforms not just for payment processing but as a core strategy for deepening customer relationships and unlocking new revenue.
The decision is no longer whether to embed finance, but how to select the best embedded finance platform for SaaS that aligns with specific vertical needs, such as offering embedded lending for e-commerce platforms.
This requires a deep evaluation of a provider’s API for embedding banking services, its ability to support white-label banking platform integration, and its expertise in navigating the complex regulatory environment defined by standards like the EU's General Data Protection Regulation (GDPR).
For instance, a B2B software provider can leverage banking-as-a-service for fintech startups to introduce features like automated invoice financing, improving client liquidity and reducing churn. This strategic pivot can increase customer lifetime value by more than 25% compared to non-financial offerings alone.
The architecture must support everything from initial real-time credit checks to ongoing know your customer protocols, ensuring a secure and compliant ecosystem. Ultimately, the successful deployment of these platforms transforms a company's application from a simple utility into an indispensable financial partner for its users.
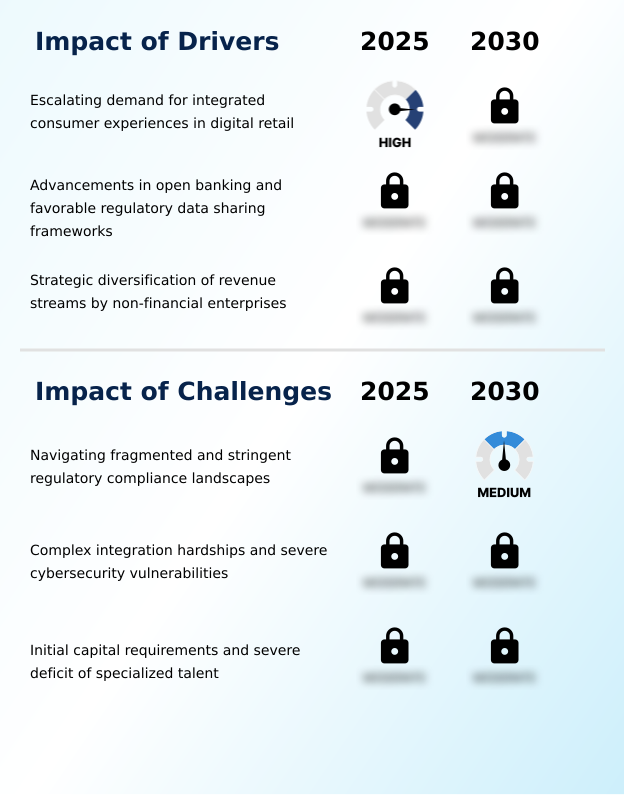
Primary Growth Driver: The escalating demand for integrated and frictionless consumer experiences within digital retail environments is a primary driver for the market.
Market expansion is fueled by a convergence of powerful drivers, contributing to an accelerating growth momentum of over 13% annually.
The primary catalyst is the escalating consumer and business demand for frictionless digital experiences, compelling non-financial brands to pursue deep customer journey integration for financial tasks.
This is strongly supported by the proliferation of open banking regulations worldwide, which mandate secure data sharing through open banking APIs and foster an environment ripe for innovation.
These frameworks, coupled with consumer data rights frameworks, lower the barrier for third-party providers.
A third major driver is the strategic imperative for enterprises to unlock new income channels; offering embedded financial products enables powerful revenue stream diversification, transforming cost centers into profit generators and significantly increasing customer lifetime value.
Emerging Market Trend: The proliferation of embedded lending and B2B microcredit solutions marks a significant market trend. This development is fundamentally restructuring how businesses manage cash flow and access liquidity.
Key trends are reshaping the capabilities of embedded finance enablement platforms, moving them from simple transaction facilitators to sophisticated financial engines. The expansion into B2B embedded lending is particularly notable, with software platforms integrating contextual financing options directly into corporate workflows to address liquidity gaps for small and medium enterprises.
Simultaneously, the deep integration of AI-powered fraud detection and machine learning for dynamic risk assessment is becoming standard. These analytical engines evaluate vast alternative data streams in real-time, which is critical for underwriting instant credit and mitigating expanding cybersecurity threats.
Another major trend is the growth of embedded insurance, especially within logistics and mobility, where platforms are using usage-based insurance APIs to offer contextual protection products, such as on-demand cargo insurance, at the point of need.
Key Industry Challenge: Navigating fragmented and stringent regulatory compliance landscapes across diverse geographies presents a significant challenge to industry growth.
Despite strong demand, market participants face significant structural challenges that constrain growth. The foremost obstacle is navigating the fragmented and stringent regulatory landscape, which requires substantial investment in regulatory compliance automation to manage disparate rules governing data privacy, such as the GDPR, and anti-money laundering compliance across jurisdictions.
Another major challenge is the technical complexity of legacy system integration, where modern APIs must connect with archaic core banking systems, creating performance bottlenecks. This integration also introduces significant cybersecurity vulnerability mitigation risks, as it expands the attack surface for data breaches.
Finally, the high initial capital required to build a resilient platform and the severe deficit of specialized talent with expertise in both finance and cloud architecture create high barriers to entry and limit the scalability of existing providers.
Explore Full Market Dynamics Analysis Request Free Sample
Embedded Finance Enablement Platforms Market Segmentation
The embedded finance enablement platforms industry research report provides comprehensive data including region-wise segment analysis, with forecasts and analysis for the period 2026-2030, as well as historical data from 2020-2024 for the following segments.
Service Segment Analysis
The embedded payments platforms segment is estimated to witness significant growth during the forecast period.
Embedded payments platforms represent the foundational service category, driven by the intense focus of non-financial enterprises on optimizing the digital customer journey.
This segment centers on the deployment of sophisticated payment orchestration layers and API-based payment processing to eliminate checkout friction, which directly improves conversion metrics in high-volume sectors like retail.
These platforms, which account for a significant portion of the market, enable merchants to control the user experience while offloading the complexities of PCI DSS compliance and financial data connectivity.
By leveraging real-time transaction processing and integrated payment gateway integration, businesses can support multiple methods, including multi-currency digital wallets, thereby facilitating seamless global expansion and strengthening customer loyalty through a frictionless transactional environment.
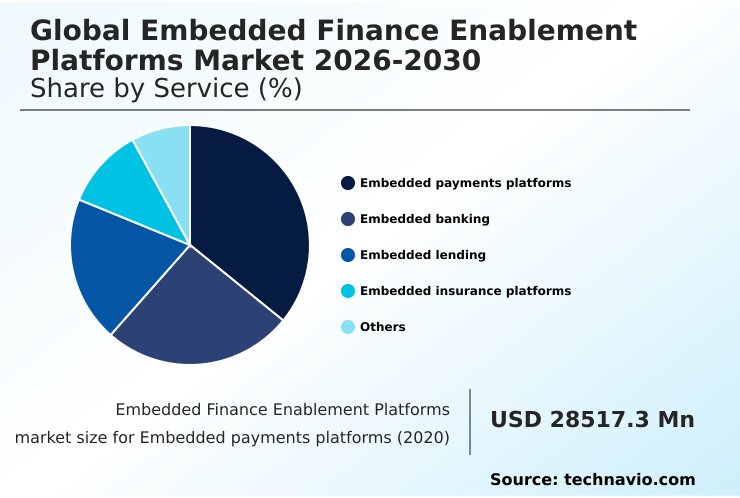
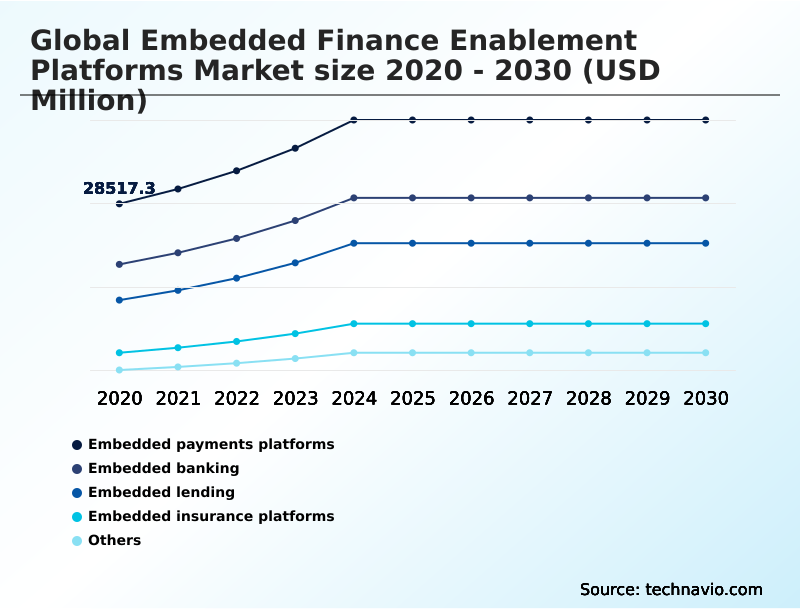
The Embedded payments platforms segment was valued at USD 39.71 billion in 2024 and showed a gradual increase during the forecast period.
Embedded Finance Enablement Platforms Market by Region: APAC Leads with 34% Growth Share
APAC is estimated to contribute 34% to the growth of the global market during the forecast period.
The geographic landscape is characterized by a strategic split between mature and high-growth regions.
North America, contributing over 30% to the market, represents a highly developed ecosystem driven by a sophisticated digital economy and a strong venture capital presence focused on B2B embedded lending.
In contrast, APAC is the epicenter of incremental growth, projected to contribute 34% of the global expansion, with a regional growth rate of 17.7%.
This surge is fueled by massive digital adoption and financial inclusion initiatives, particularly in India and Southeast Asia, where multi-currency digital wallets and cross-border payment facilitation are critical.
Europe’s market, influenced by open banking regulations such as PSD2, fosters innovation in modular finance solutions and demands rigorous regional compliance infrastructure, making it a key region for specialized banking-as-a-service platforms.
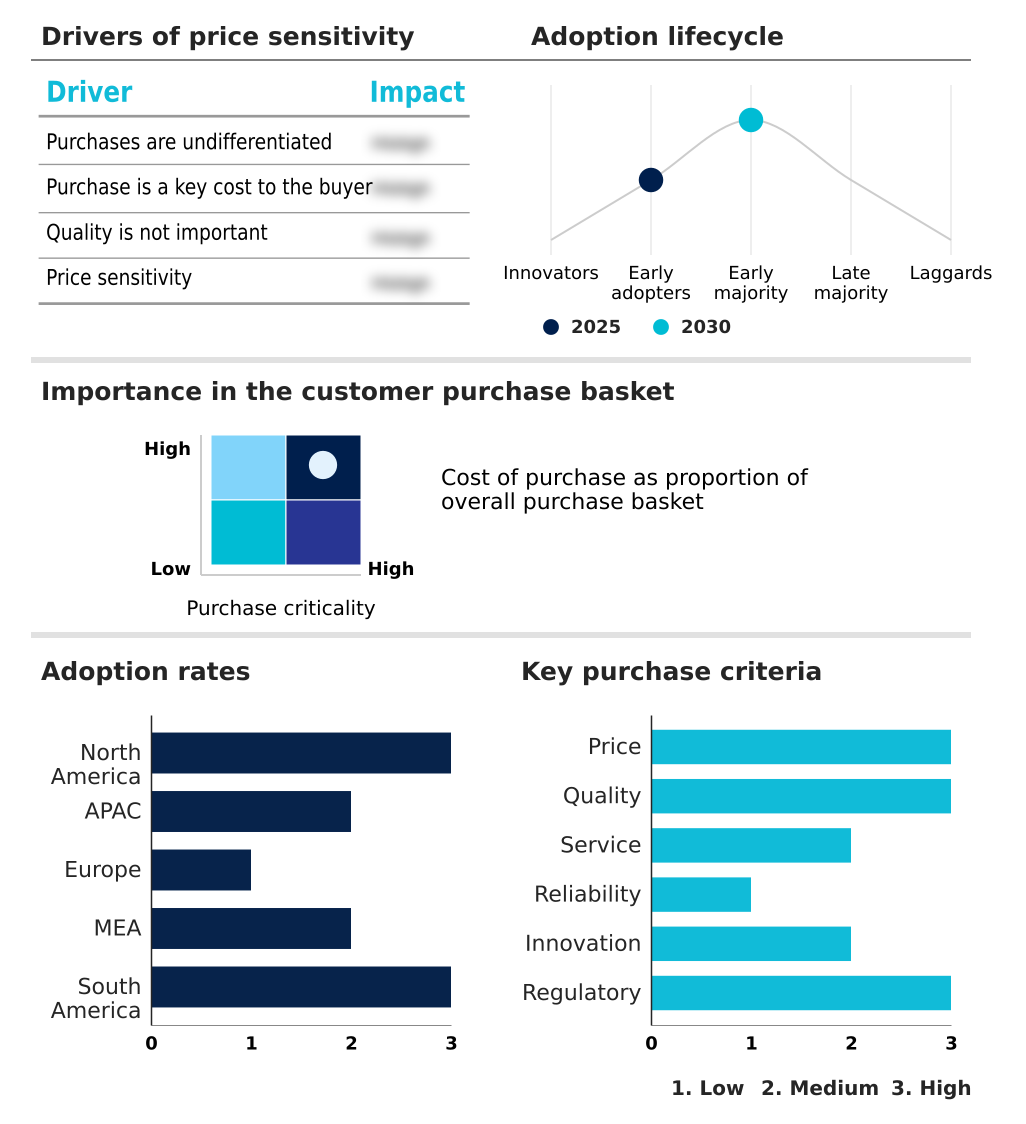
Customer Landscape Analysis for the Embedded Finance Enablement Platforms Market
The embedded finance enablement platforms market forecasting report includes the adoption lifecycle of the market, covering from the innovator’s stage to the laggard’s stage. It focuses on adoption rates in different regions based on penetration. Furthermore, the embedded finance enablement platforms market report also includes key purchase criteria and drivers of price sensitivity to help companies evaluate and develop their market growth analysis strategies.
Competitive Landscape of the Embedded Finance Enablement Platforms Market
Companies are implementing various strategies, such as strategic alliances, partnerships, mergers and acquisitions, geographical expansion, and product/service launches, to enhance their presence in the embedded finance enablement platforms market industry.
Adyen NV - Providers offer a unified financial technology platform that integrates global payment gateways, risk management, and acquiring services for enterprises seeking embedded finance solutions.
The industry research and growth report includes detailed analyses of the competitive landscape of the market and information about key companies, including:
- Adyen NV
- Airwallex
- Alviere
- Bond Financial Technologies Inc.
- Cross River Bank
- DriveWealth LLC
- Galileo Financial Technologies
- Green Dot Corp.
- Mambu BV
- Parafin
- Plaid Inc.
- Q2 Holdings Inc.
- Solaris SE
- Stripe Inc.
- Swan
- Synctera
- Treasury Prime Inc.
- Treezor
- Unit Finance Inc.
- Weavr Ltd
Qualitative and quantitative analysis of companies has been conducted to help clients understand the wider business environment as well as the strengths and weaknesses of key industry players. Data is qualitatively analyzed to categorize companies as pure play, category-focused, industry-focused, and diversified; it is quantitatively analyzed to categorize companies as dominant, leading, strong, tentative, and weak.
Recent Developments in the Embedded Finance Enablement Platforms Market
- In May 2025, CrediLinq, an AI-driven B2B embedded finance enablement platform, secured USD 8.5 million in Series A funding to support its international expansion into the United States, United Kingdom, and Australia and to further develop its AI-based credit infrastructure.
- In March 2025, Fiserv Inc. finalized its acquisition of Payfare Inc., a specialist in earned wage access and embedded banking program management, to integrate Payfare’s white-label infrastructure and card program capabilities into its broader payments ecosystem.
- In April 2025, Allica Bank completed its acquisition of Kriya, a UK-based embedded finance and SME credit platform, to accelerate its strategic expansion into embedded lending and technology-driven financing solutions for small and medium-sized enterprises.
- In February 2025, Newgen Software and Mambu announced a strategic partnership to combine Newgen’s loan origination system with Mambu’s composable core banking capabilities, enabling the rapid rollout of embedded lending products for banks and digital lenders.
Research Analyst Overview: Embedded Finance Enablement Platforms Market
The market's evolution is moving decisively beyond payments toward comprehensive financial ecosystems, with B2B embedded lending emerging as a primary value driver. Boardroom decisions at vertical software companies now center on whether to partner with a provider of banking-as-a-service (BaaS) platforms or attempt a costly in-house build to capture more of the value chain.
This strategic choice is influenced by the market's overall 13.8% year-over-year expansion and the need to comply with open banking frameworks like the UK's CMA Order. Platforms offering a proprietary API-driven banking core and modular finance solutions enable SaaS firms to deploy contextual financing options and real-time risk assessment tools rapidly.
This integration of embedded banking services not only creates high-friction exit barriers for customers but also allows for sophisticated revenue stream diversification. The success of this model hinges on a platform's ability to handle complex regulatory demands, including anti-money laundering compliance and know your customer protocols, making vendor selection a critical exercise in risk management.
Dive into Technavio’s robust research methodology, blending expert interviews, extensive data synthesis, and validated models for unparalleled Embedded Finance Enablement Platforms Market insights. See full methodology.
| Market Scope | |
|---|---|
| Page number | 305 |
| Base year | 2025 |
| Historic period | 2020-2024 |
| Forecast period | 2026-2030 |
| Growth momentum & CAGR | Accelerate at a CAGR of 16% |
| Market growth 2026-2030 | USD 141507.5 million |
| Market structure | Fragmented |
| YoY growth 2025-2026(%) | 13.8% |
| Key countries | US, Canada, Mexico, China, India, Japan, South Korea, Australia, Indonesia, Germany, UK, France, Italy, The Netherlands, Spain, Saudi Arabia, UAE, South Africa, Israel, Turkey, Brazil, Argentina and Colombia |
| Competitive landscape | Leading Companies, Market Positioning of Companies, Competitive Strategies, and Industry Risks |
Embedded Finance Enablement Platforms Market: Key Questions Answered in This Report
-
What is the expected growth of the Embedded Finance Enablement Platforms Market between 2026 and 2030?
-
The Embedded Finance Enablement Platforms Market is expected to grow by USD 141.51 billion during 2026-2030, registering a CAGR of 16%. Year-over-year growth in 2026 is estimated at 13.8%%. This acceleration is shaped by escalating demand for integrated consumer experiences in digital retail , which is intensifying demand across multiple end-use verticals covered in the report.
-
-
What segmentation does the market report cover?
-
The report is segmented by Service (Embedded payments platforms, Embedded banking, Embedded lending, Embedded insurance platforms, and Others), End-user (Retail and e-commerce, Healthcare, Transportation, Education, and Others), Application (B2B, and B2C) and Geography (North America, APAC, Europe, Middle East and Africa, South America). Among these, the Embedded payments platforms segment is estimated to witness significant growth during the forecast period, driven by rising adoption across key application areas. Each segment includes detailed qualitative and quantitative analysis, along with historical data from 2020-2024 and forecasts through 2030 with year-over-year growth rates.
-
-
Which regions are analyzed in the report?
-
The report covers North America, APAC, Europe, Middle East and Africa and South America. APAC is estimated to contribute 34% to market growth during the forecast period. Country-level analysis includes US, Canada, Mexico, China, India, Japan, South Korea, Australia, Indonesia, Germany, UK, France, Italy, The Netherlands, Spain, Saudi Arabia, UAE, South Africa, Israel, Turkey, Brazil, Argentina and Colombia, with dedicated market size tables and year-over-year growth for each.
-
-
What are the key growth drivers and market challenges?
-
The primary driver is escalating demand for integrated consumer experiences in digital retail , which is accelerating investment and industry demand. The main challenge is navigating fragmented and stringent regulatory compliance landscapes, creating operational barriers for key market participants. The report quantifies the impact of each driver and challenge across 2026 and 2030 with comparative analysis.
-
-
Who are the major players in the Embedded Finance Enablement Platforms Market?
-
Key vendors include Adyen NV, Airwallex, Alviere, Bond Financial Technologies Inc., Cross River Bank, DriveWealth LLC, Galileo Financial Technologies, Green Dot Corp., Mambu BV, Parafin, Plaid Inc., Q2 Holdings Inc., Solaris SE, Stripe Inc., Swan, Synctera, Treasury Prime Inc., Treezor, Unit Finance Inc. and Weavr Ltd. The report provides qualitative and quantitative analysis categorizing companies as dominant, leading, strong, tentative, and weak based on their market positioning. Company profiles include business segment analysis, SWOT assessment, key offerings, and recent strategic developments.
-
Embedded Finance Enablement Platforms Market Research Insights
Market dynamics are shaped by the dual pressures of regulatory adherence and technological innovation, with platforms navigating frameworks like the Payment Card Industry Data Security Standard (PCI DSS) to ensure secure transactions. While embedded payment platforms form the largest service segment, the rapid adoption of composable finance architecture is accelerating growth in embedded lending.
This is exemplified in mobility applications, where providers use sponsor bank partnerships and usage-based insurance APIs to offer on-demand coverage for rentals, enhancing the customer experience. The ability to manage data privacy and leverage B2B microcredit solutions allows software-as-a-service monetization strategies to mature, transforming operational platforms into significant profit centers.
This evolution is contingent on robust cybersecurity vulnerability mitigation and seamless legacy system integration.
We can help! Our analysts can customize this embedded finance enablement platforms market research report to meet your requirements.
 RIA -
RIA - 
