Embolic Protection Devices Market Size 2025-2029
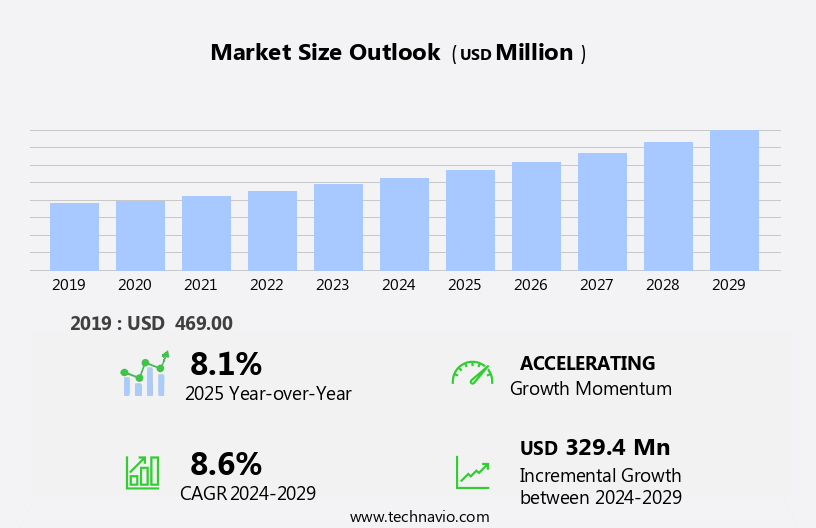
The embolic protection devices market size is forecast to increase by USD 329.4 million, at a CAGR of 8.6% between 2024 and 2029.
- The market is experiencing significant growth due to the increasing prevalence of cardiovascular diseases, which necessitates the use of these devices for minimally invasive procedures. The market is further propelled by the increasing number of clinical trials aimed at developing advanced embolic protection technologies. However, regulatory hurdles pose a significant challenge to market expansion. These obstacles include stringent approval processes and evolving regulatory requirements, which can delay product launches and increase development costs. Companies must navigate these challenges by investing in robust regulatory affairs functions and staying abreast of regulatory trends to ensure timely market entry.
- Additionally, collaboration with regulatory agencies and industry associations can help streamline the approval process and reduce development costs. Overall, the market offers considerable opportunities for growth, particularly in emerging markets, as the demand for minimally invasive procedures continues to rise. Companies that can effectively address regulatory challenges and innovate to meet evolving clinical needs will be well-positioned to capitalize on these opportunities.
What will be the Size of the Embolic Protection Devices Market during the forecast period?
Explore in-depth regional segment analysis with market size data - historical 2019-2023 and forecasts 2025-2029 - in the full report.
Request Free Sample
The market continues to evolve, driven by advancements in stroke reduction technology and the ongoing quest for effective embolism prevention methods. Embolic debris removal is a critical focus, with filter material selection and clogging prevention being key considerations. Filter size optimization and microembolism detection are essential for ensuring device efficacy, while device design parameters are continually being refined to enhance cerebral protection system capabilities. Applications of embolic protection devices span various sectors, including aortic valve protection, catheter-based embolic protection, and peripheral artery protection. Transient ischemic attacks and post-procedure embolic risk are significant concerns, leading to the integration of thrombectomy devices and surgical filter deployment.
Filter patency assessment and embolic event prevention are crucial metrics, with ongoing research focusing on blood flow restoration and embolic burden reduction. Ongoing advancements in occlusion prevention devices and thrombus embolization reduction technologies are expected to further shape the market landscape. Imaging guidance systems play a vital role in optimizing embolic protection device performance, with the capture rate of emboli being a critical performance metric. Neurological protection and device biocompatibility testing are essential considerations to minimize procedural complications and ensure optimal patient outcomes.
How is this Embolic Protection Devices Industry segmented?
The embolic protection devices industry research report provides comprehensive data (region-wise segment analysis), with forecasts and estimates in "USD million" for the period 2025-2029, as well as historical data from 2019-2023 for the following segments.
- Product
- Distal filter devices
- Distal occlusion devices
- Proximal occlusion devices
- Application
- Cardiovascular diseases
- Peripheral vascular diseases
- Neurovascular diseases
- End-user
- Hospitals
- Ambulatory surgical centers
- Geography
- North America
- US
- Canada
- Europe
- France
- Germany
- UK
- APAC
- China
- India
- Japan
- South Korea
- South America
- Brazil
- Rest of World (ROW)
- North America
By Product Insights
The distal filter devices segment is estimated to witness significant growth during the forecast period.
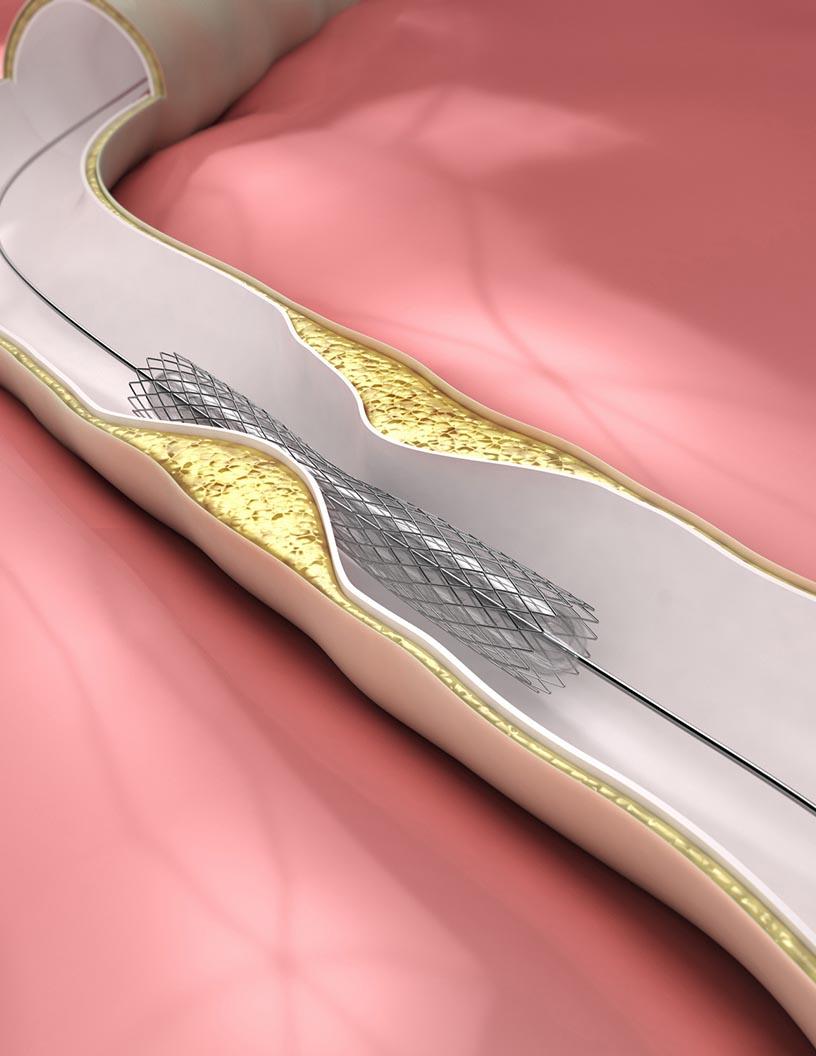
Distal filter devices, integral to minimally invasive procedures such as carotid artery stenting (CAS) and transcatheter aortic valve replacement (TAVR), are gaining significant traction due to their embolic debris removal capabilities while preserving blood flow. The market's growth is underpinned by advantages like ease of deployment, improved intervention visibility, and adaptability to various vessel sizes, making them a favored choice for clinicians. Positioned distally to the lesion in the blood vessel, these devices trap embolic material released during procedures like stenting or angioplasty. Their porous filters, typically crafted from materials such as nitinol, enable blood to flow unobstructed while capturing debris, thereby preventing potential strokes or complications caused by blockages in smaller vessels.
Catheter-based embolic protection and peripheral artery protection further expand the application scope of distal filter devices. In the context of transient ischemic attacks (TIAs) and post-procedure embolic risk, these devices play a crucial role in thrombectomy device integration and surgical filter deployment. Filter patency assessment, filter retrieval systems, and procedural complication rates are essential considerations in the design of endovascular filters. Device material compatibility, treatment efficacy metrics, and cerebral protection systems are also integral to ensuring optimal performance. Microembolism detection, aortic valve protection, and imaging guidance systems contribute to enhancing the overall effectiveness of distal filter devices.
Neurological protection and device biocompatibility testing are essential aspects of their development and deployment. In summary, the evolving trends in the market for distal filter devices are driven by their ability to reduce embolic burden, prevent occlusions, and restore blood flow, ultimately improving patient outcomes and minimizing the risk of complications.
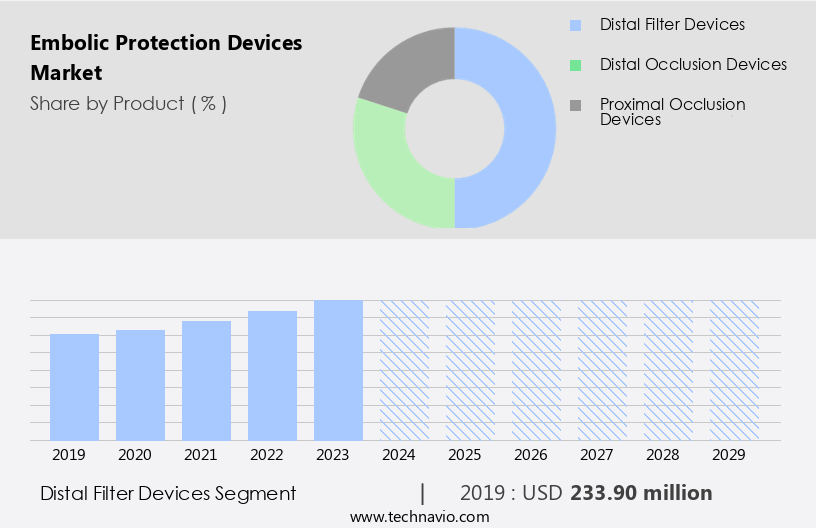
The Distal filter devices segment was valued at USD 233.90 million in 2019 and showed a gradual increase during the forecast period.
Regional Analysis
North America is estimated to contribute 30% to the growth of the global market during the forecast period. Technavio's analysts have elaborately explained the regional trends and drivers that shape the market during the forecast period.
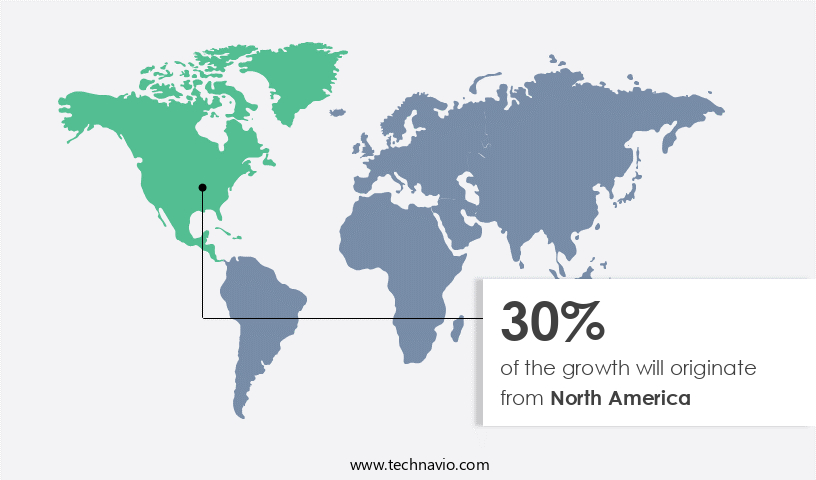
The market in North America is experiencing significant growth due to several key factors. The high prevalence of cardiovascular diseases, such as heart attacks and peripheral artery disease, in the region is a major driver. In the US alone, there are approximately 805,000 heart attacks and peripheral artery disease affects about 12-20% of Americans aged 60 and above. These statistics increase the demand for safer cardiovascular interventions, where embolic protection devices (EPDs) play a vital role in preventing embolic complications like stroke during procedures such as carotid artery stenting and transcatheter aortic valve replacement. The advanced healthcare infrastructure in North America further supports market expansion.
EPDs employ various technologies, including stroke reduction, embolic debris removal, filter material selection, embolism prevention methods, filter clogging prevention, filter size optimization, microembolism detection, filter device efficacy, device design parameters, aortic valve protection, catheter-based embolic protection, peripheral artery protection, transient ischemic attack, post-procedure embolic risk, thrombectomy device integration, surgical filter deployment, filter retrieval system, procedural complication rate, endovascular filter design, stroke prevention device, device material compatibility, treatment efficacy metric, cerebral protection system, carotid artery protection, surgical filter implantation, filter patency assessment, embolic event prevention, blood flow restoration, embolic burden reduction, occlusion prevention device, thrombus embolization reduction, imaging guidance system, embolus capture rate, neurological protection, and device biocompatibility testing.
These features ensure effective embolic event prevention, blood flow restoration, and embolic burden reduction, making EPDs an essential component of cardiovascular interventions.
Market Dynamics
Our researchers analyzed the data with 2024 as the base year, along with the key drivers, trends, and challenges. A holistic analysis of drivers will help companies refine their marketing strategies to gain a competitive advantage.
What are the key market drivers leading to the rise in the adoption of Embolic Protection Devices Industry?
- The escalating incidence of cardiovascular diseases serves as the primary market driver.
- The market experiences significant growth due to the increasing prevalence of cardiovascular diseases (CVDs), which are the leading cause of death worldwide, claiming approximately 17.9 million lives annually, according to the World Health Organization (WHO). CVDs include conditions affecting the heart and blood vessels, such as coronary heart disease, cerebrovascular disease, and rheumatic heart disease. Over 80% of CVD-related deaths result from heart attacks and strokes, often caused by underlying vascular blockages or plaque rupture. Interventional procedures like carotid artery stenting and transcatheter aortic valve replacement (TAVR) are essential in managing these high-risk events. Embolic protection devices play a crucial role in minimizing procedural risks by preventing the migration of blood clots or debris during these procedures.
- These devices include catheter-based embolic protection, such as filters and occlusion balloons, and surgical filter deployment with filter retrieval systems. Thrombectomy device integration is another essential aspect of embolic protection, reducing the post-procedure embolic risk. Despite the benefits, procedural complications remain a concern, necessitating continuous advancements in EPD technology.
What are the market trends shaping the Embolic Protection Devices Industry?
- The trend in the clinical trials market is characterized by an escalating number of trials being conducted. This upward trajectory reflects the industry's commitment to innovation and advancements in healthcare.
- The market is experiencing significant growth due to the increasing number of clinical trials focused on innovation and safety validation. Recent first-in-human and early feasibility studies highlight the industry's dedication to improving outcomes in cardiovascular interventions, particularly Transcatheter Aortic Valve Replacement (TAVR). On November 15, 2023, Filterlex Medical Ltd., an Israeli cardiovascular device company, reported positive results from its first-in-human study on the Captis full-body embolic protection device. The study, which took place during TAVR procedures, included 20 patients and achieved a 100 percent procedural success rate with no device-related complications or cerebrovascular events. This success underscores the importance of embolic protection systems in preventing embolic events during complex cardiovascular procedures.
- The market's growth is driven by the development of advanced endovascular filter designs, ensuring device material compatibility, and the emphasis on treatment efficacy metrics. The cerebral protection system market is expected to continue its expansion, with carotid artery protection and surgical filter implantation remaining key areas of focus. Filter patency assessment is also a critical factor in the market's growth, as maintaining filter effectiveness is essential for optimal patient care.
What challenges does the Embolic Protection Devices Industry face during its growth?
- The growth of the industry is significantly impeded by regulatory hurdles, which present a formidable challenge that must be addressed by industry professionals.
- Embolic protection devices play a crucial role in blood flow restoration during various interventional procedures, particularly those involving the cardiovascular system. These devices aim to reduce embolic burden by preventing thrombus embolization and occlusion. The global market for these devices faces regulatory hurdles due to their direct interaction with the cardiovascular system. Regulatory authorities impose stringent requirements to ensure safety, efficacy, and quality, which can prolong approval timelines and increase development costs, especially for innovative technologies. In the US, the Food and Drug Administration (FDA) regulates embolic protection devices under the Medical Device Regulations. Devices may undergo either Premarket Approval (PMA) or 510(k) clearance.
- The PMA pathway, which is more rigorous, necessitates extensive clinical trials and detailed technical documentation. The 510(k) pathway, while less burdensome, requires demonstrating substantial equivalence to an existing approved product. Imaging guidance systems and device biocompatibility testing are essential components of the development process to enhance embolus capture rates and neurological protection.
Exclusive Customer Landscape
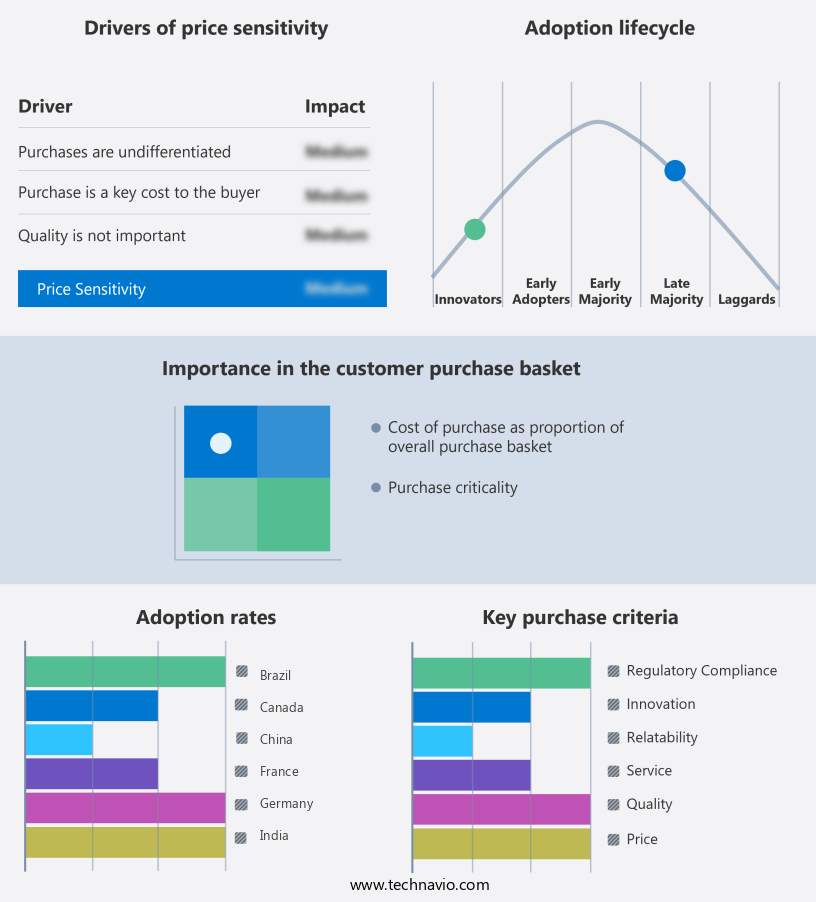
The embolic protection devices market forecasting report includes the adoption lifecycle of the market, covering from the innovator's stage to the laggard's stage. It focuses on adoption rates in different regions based on penetration. Furthermore, the embolic protection devices market report also includes key purchase criteria and drivers of price sensitivity to help companies evaluate and develop their market growth analysis strategies.
Customer Landscape
Key Companies & Market Insights
Companies are implementing various strategies, such as strategic alliances, embolic protection devices market forecast, partnerships, mergers and acquisitions, geographical expansion, and product/service launches, to enhance their presence in the industry.
Abbott Laboratories - The company specializes in embolic protection devices, including the NAV6 model, which safeguards against cerebral emboli during carotid artery stenting procedures.
The industry research and growth report includes detailed analyses of the competitive landscape of the market and information about key companies, including:
- Abbott Laboratories
- Allium Ltd.
- Boston Scientific Corp.
- Cardinal Health Inc.
- Contego Medical Inc.
- Cook Group Inc.
- Cordis Corp.
- Edwards Lifesciences Corp.
- Emboline Inc.
- Inspire MD Inc.
- Medtronic Plc
- Merit Medical Systems Inc.
- MicroPort Scientific Corp.
- Nipro Medical Corp.
- Terumo Corp.
- Transverse Medical Inc.
- Venus Medtech Hangzhou Inc.
- W. L. Gore and Associates Inc.
Qualitative and quantitative analysis of companies has been conducted to help clients understand the wider business environment as well as the strengths and weaknesses of key industry players. Data is qualitatively analyzed to categorize companies as pure play, category-focused, industry-focused, and diversified; it is quantitatively analyzed to categorize companies as dominant, leading, strong, tentative, and weak.
Recent Development and News in Embolic Protection Devices Market
- In January 2024, Medtronic, a leading medical technology company, announced the US Food and Drug Administration (FDA) approval of its new Embolic Protection System, the FilterWire EX5, designed for use in large vessel peripheral arterial interventions. This innovative device aims to reduce the risk of distal embolization during peripheral artery procedures (Medtronic Press Release, 2024).
- In March 2024, Stryker Corporation and Merit Medical announced a strategic partnership to expand their respective offerings in the market. The collaboration combines Stryker's neurovascular and neuroendovascular expertise with Merit Medical's embolic protection technology, aiming to enhance patient care and outcomes (Stryker Corporation Press Release, 2024).
- In May 2024, Boston Scientific completed the acquisition of TriReme Medical, a privately held company specializing in embolic protection systems. The acquisition is expected to strengthen Boston Scientific's neurovascular portfolio and position the company as a major player in the market (Boston Scientific Press Release, 2024).
- In February 2025, Abbott Laboratories received FDA approval for its Absolute Quadra Embolic Protection System, which features a unique design with four independent filters. The approval marks a significant advancement in embolic protection technology, offering improved safety and effectiveness for neurovascular procedures (Abbott Laboratories Press Release, 2025).
Research Analyst Overview
- The embolic protection market is driven by the increasing prevalence of cerebrovascular diseases and the growing demand for minimally invasive surgical interventions. The embolic protection strategy plays a crucial role in mitigating the risk of intracranial hemorrhage and thrombus disintegration during endovascular procedures. Perfusion pressure monitoring ensures optimal cerebral blood flow during filter placement, while filter recapture technology and embolus capture mechanisms enhance device efficiency. Clinical trial outcomes and filter maintenance protocols significantly impact device longevity testing and patient outcome assessment. Neurological deficit scores and complication management protocols are essential indicators of procedural success rate and device safety profile.
- Patient selection criteria and surgical intervention strategy are critical factors influencing embolic event frequency and arterial injury prevention. Device sterilization methods and filter design innovations contribute to improved filter structural integrity and biodegradability. Thrombus disintegration and embolism risk stratification are essential considerations in filter selection and deployment technique. Post-operative recovery and patient outcome assessment are crucial indicators of the effectiveness of cerebrovascular protection strategies. Embolic protection devices undergo rigorous testing to ensure filter material science and device deployment techniques meet the highest safety standards. Complication management protocols and filter maintenance procedures are essential components of the overall device safety profile.
- The procedural success rate and embolic event frequency are closely monitored to assess the efficacy of embolic protection strategies and improve patient care.
Dive into Technavio's robust research methodology, blending expert interviews, extensive data synthesis, and validated models for unparalleled Embolic Protection Devices Market insights. See full methodology.
|
Market Scope |
|
|
Report Coverage |
Details |
|
Page number |
226 |
|
Base year |
2024 |
|
Historic period |
2019-2023 |
|
Forecast period |
2025-2029 |
|
Growth momentum & CAGR |
Accelerate at a CAGR of 8.6% |
|
Market growth 2025-2029 |
USD 329.4 million |
|
Market structure |
Fragmented |
|
YoY growth 2024-2025(%) |
8.1 |
|
Key countries |
US, China, Germany, India, UK, Canada, France, Japan, Brazil, and South Korea |
|
Competitive landscape |
Leading Companies, Market Positioning of Companies, Competitive Strategies, and Industry Risks |
What are the Key Data Covered in this Embolic Protection Devices Market Research and Growth Report?
- CAGR of the Embolic Protection Devices industry during the forecast period
- Detailed information on factors that will drive the growth and forecasting between 2025 and 2029
- Precise estimation of the size of the market and its contribution of the industry in focus to the parent market
- Accurate predictions about upcoming growth and trends and changes in consumer behaviour
- Growth of the market across North America, Europe, Asia, and Rest of World (ROW)
- Thorough analysis of the market's competitive landscape and detailed information about companies
- Comprehensive analysis of factors that will challenge the embolic protection devices market growth of industry companies
We can help! Our analysts can customize this embolic protection devices market research report to meet your requirements.
 RIA -
RIA - 
