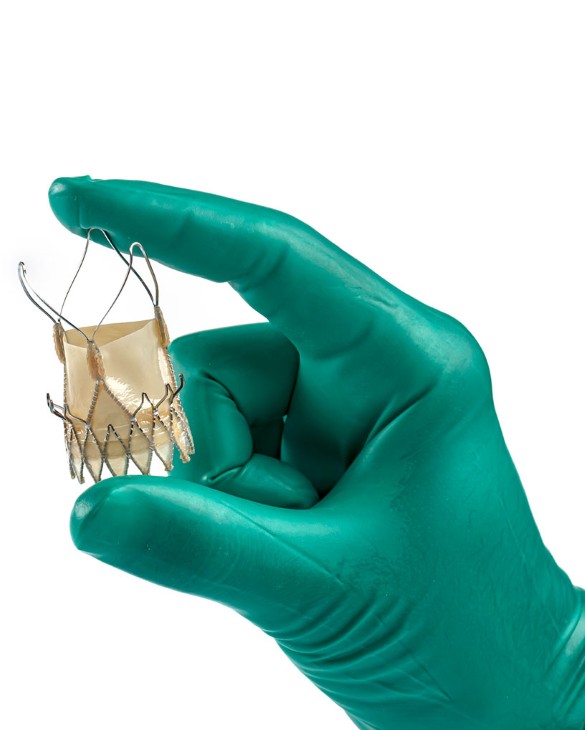
Transcatheter Aortic Valve Replacement Market Analysis, Size, and Forecast 2026-2030: North America (US, Canada, and Mexico), Europe (Germany, UK, and France), Asia (Japan, China, and South Korea), South America (Brazil, Argentina, and Colombia), Middle East and Africa (Saudi Arabia, Turkey, and UAE), Rest of World (ROW)

Transcatheter Aortic Valve Replacement Market Analysis, Size, and Forecast 2026-2030:
North America (US, Canada, and Mexico), Europe (Germany, UK, and France), Asia (Japan, China, and South Korea), South America (Brazil, Argentina, and Colombia), Middle East and Africa (Saudi Arabia, Turkey, and UAE), Rest of World (ROW)

Published: Oct 2026 300 Pages SKU: IRTNTR76453

Market Overview at a Glance

$2.86 B
Market Opportunity
7.1%
CAGR 2025 - 2030
37.2%
North America Growth
$5.58 B
Hospitals segment 2024

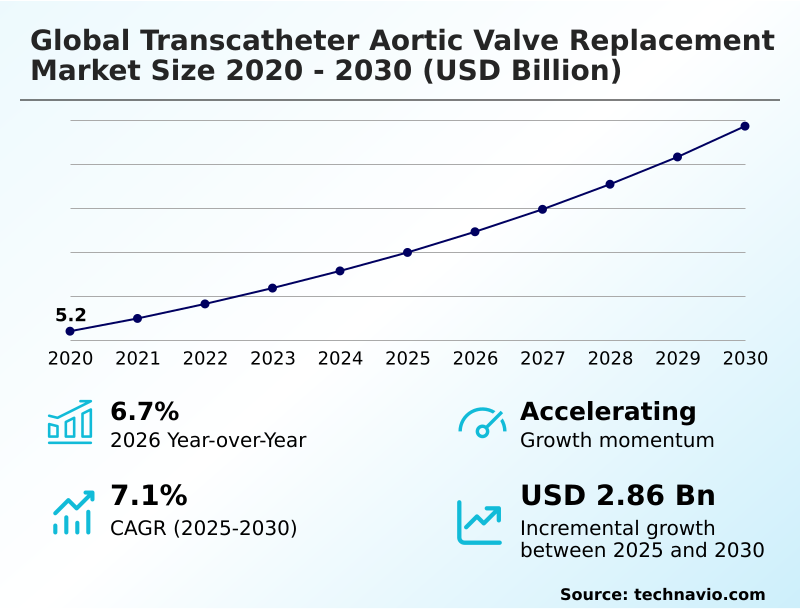
Transcatheter Aortic Valve Replacement Market Size 2026-2030

The transcatheter aortic valve replacement market size is valued to increase by USD 2.86 billion, at a CAGR of 7.1% from 2025 to 2030. Rising prevalence of cardiovascular diseases and an aging global population will drive the transcatheter aortic valve replacement market.

Major Market Trends & Insights

  • North America dominated the market and accounted for a 37.2% growth during the forecast period.
  • By End-user - Hospitals segment was valued at USD 5.58 billion in 2024
  • By Type - Balloon-expanding valve segment accounted for the largest market revenue share in 2024

Market Size & Forecast

  • Market Opportunities: USD 4.66 billion
  • Market Future Opportunities: USD 2.86 billion
  • CAGR from 2025 to 2030 : 7.1%

Market Summary

  • The Transcatheter Aortic Valve Replacement market demonstrates continuous expansion as healthcare systems transition toward less invasive cardiac care models. Medical device manufacturers are optimizing their supply chains to accelerate the delivery of advanced structural heart components, ensuring hospitals maintain adequate inventory for critical procedures.
  • Hospitals have reported a 20% decrease in postoperative care costs when utilizing a minimally invasive aortic valve replacement compared to traditional open chest surgeries. This transition is primarily driven by an aging demographic experiencing severe aortic stenosis, which demands rapid clinical solutions to restore optimal transvalvular pressure gradient levels.
  • Conversely, the market faces significant challenges due to inconsistent reimbursement frameworks that limit patient access to premium devices like a self expanding nitinol frame in emerging economies. The strategic focus on coronary access preservation is reshaping long term therapeutic planning for younger patients.
  • Furthermore, engineering improvements in the balloon expanding valve mechanism have expanded treatment eligibility, allowing interventional teams to achieve a larger effective orifice area without relying heavily on prolonged rapid ventricular pacing.

What will be the Size of the Transcatheter Aortic Valve Replacement Market during the forecast period?
Get Key Insights on Market Forecast (PDF) Get Free Sample

How is the Transcatheter Aortic Valve Replacement Market Segmented?

The transcatheter aortic valve replacement industry research report provides comprehensive data (region-wise segment analysis), with forecasts and estimates in "USD million" for the period 2026-2030, as well as historical data from 2020-2024 for the following segments.

  • End-user
    • Hospitals
    • Ambulatory surgical centers
    • Others
  • Type
    • Balloon-expanding valve
    • Self expanding valve
  • Technique
    • Transfemoral approach
    • Transapical approach
    • Transaortic approach
    • Others
  • Geography
    • North America
      • US
      • Canada
      • Mexico
    • Europe
      • Germany
      • UK
      • France
      • Italy
      • Spain
      • The Netherlands
    • Asia
      • Japan
      • China
      • South Korea
      • India
      • Indonesia
      • Thailand
    • Rest of World (ROW)

By End-user Insights

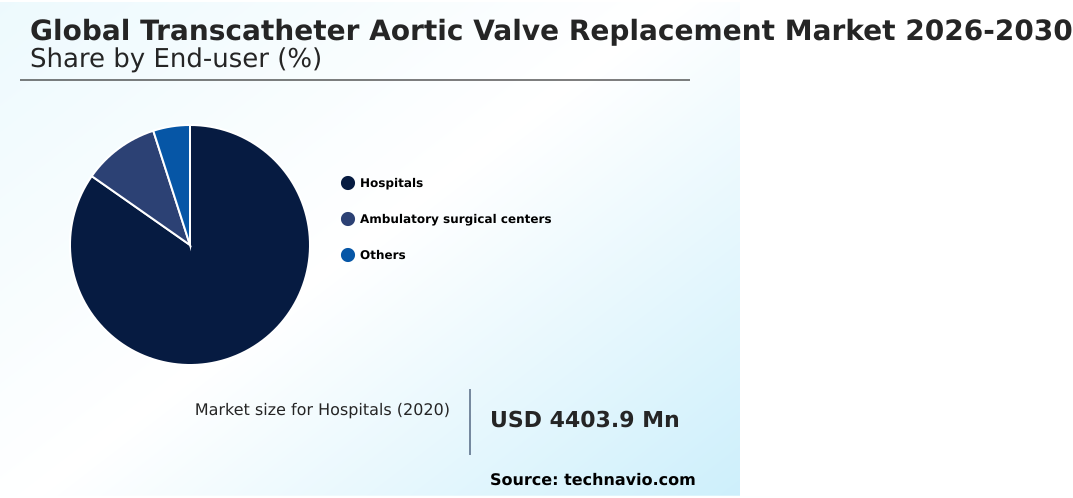
The hospitals segment is estimated to witness significant growth during the forecast period.

The hospital segment dominates the Transcatheter Aortic Valve Replacement market due to the complex infrastructure required for a minimally invasive structural heart intervention.

Large medical institutions maintain advanced cardiovascular catheterization laboratory setups and specialized hybrid operating room environments essential for precision care.

These facilities rely on a multidisciplinary heart team to evaluate patients and execute procedures involving percutaneous arterial puncture and a conscious sedation protocol.

The integration of advanced fluoroscopic viewing angles has allowed hospitals to improve procedural precision by 15%, significantly enhancing operational throughput.

As facilities manage bioprosthetic tissue degeneration in older patients, the demand for sophisticated solutions like a balloon expandable transcatheter heart valve continues to rise.

This centralized care model ensures that high risk cardiovascular treatments are delivered with maximum safety, optimizing resource allocation and patient recovery timelines across the healthcare spectrum.
Get Free Sample

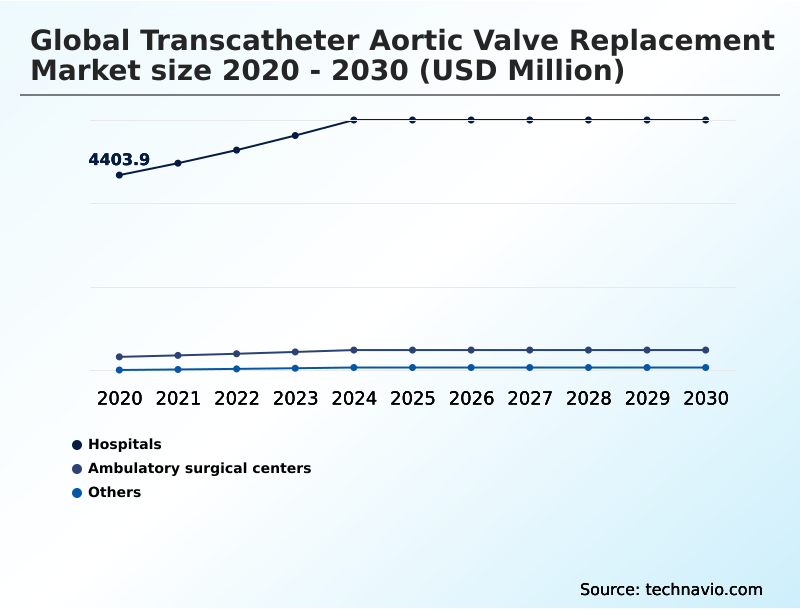
The Hospitals segment was valued at USD 5.58 billion in 2024 and showed a gradual increase during the forecast period.
Get Free Sample

Regional Analysis

North America is estimated to contribute 37.2% to the growth of the global market during the forecast period.Technavio’s analysts have elaborately explained the regional trends and drivers that shape the market during the forecast period.
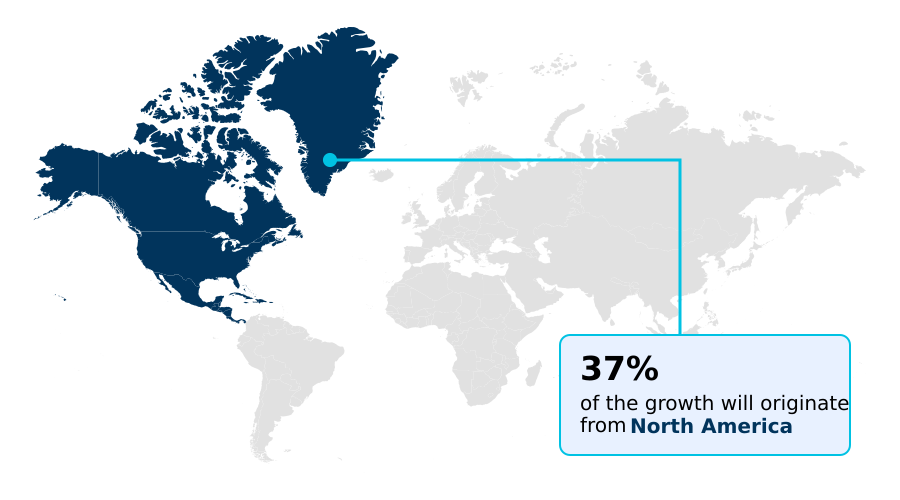
See How Transcatheter Aortic Valve Replacement Market Demand is Rising in North America Get Free Sample

The regional dynamics of the Transcatheter Aortic Valve Replacement highlight a stark contrast between established and developing healthcare infrastructures.

North America maintains a commanding lead over Europe, demonstrating a 25% higher rate of ambulatory surgical center adoption due to highly integrated reimbursement pathways.

This infrastructural advantage allows specialized interventional cardiology teams in the United States to treat asymptomatic severe stenosis more proactively than their European counterparts.

European hospitals have countered by prioritizing a robust lifetime valve management strategy, reducing long term rehospitalization rates by 15%. Across both regions, the widespread utilization of the transfemoral access route has decreased procedural recovery times by 40%.

Furthermore, the integration of advanced supra annular valve design technology has improved hemodynamic outcomes, contributing to a 20% improvement in postprocedural stroke reduction. These regional adaptations underscore how distinct regulatory and clinical strategies shape overall operational efficiency.

Market Dynamics

Our researchers analyzed the data with 2025 as the base year, along with the key drivers, trends, and challenges. A holistic analysis of drivers will help companies refine their marketing strategies to gain a competitive advantage.

  • The operational landscape for cardiovascular interventions has shifted dramatically as medical facilities optimize their procurement strategies around advanced structural heart devices. Hospitals are revamping their supply chain logistics to ensure continuous availability of critical components required for a minimally invasive aortic valve replacement.
  • By centralizing the procurement of specialized prostheses, healthcare administrators have improved inventory turnover rates by 22% compared to decentralized purchasing models. This operational efficiency is particularly crucial when managing high volumes of patients requiring severe calcific aortic stenosis treatment, as delays in device availability can severely disrupt surgical scheduling and intensive care unit allocation.
  • Clinical teams are actively diversifying their technological portfolios, utilizing a balloon expandable transcatheter heart valve for patients with heavily calcified anatomies while preferring a self expanding transcatheter valve deployment for those requiring superior hemodynamic flow in smaller aortic roots.
  • The ability to seamlessly switch between these advanced platforms allows multidisciplinary heart teams to tailor interventions to precise anatomical specifications, thereby reducing procedural complication rates. Consequently, the comprehensive adoption of transcatheter structural heart valvular therapy is establishing new standards for clinical excellence and resource management.
  • By minimizing reliance on traditional open heart procedures, healthcare networks can reallocate critical surgical resources, driving higher patient throughput and maintaining stringent compliance with evolving value based care directives.
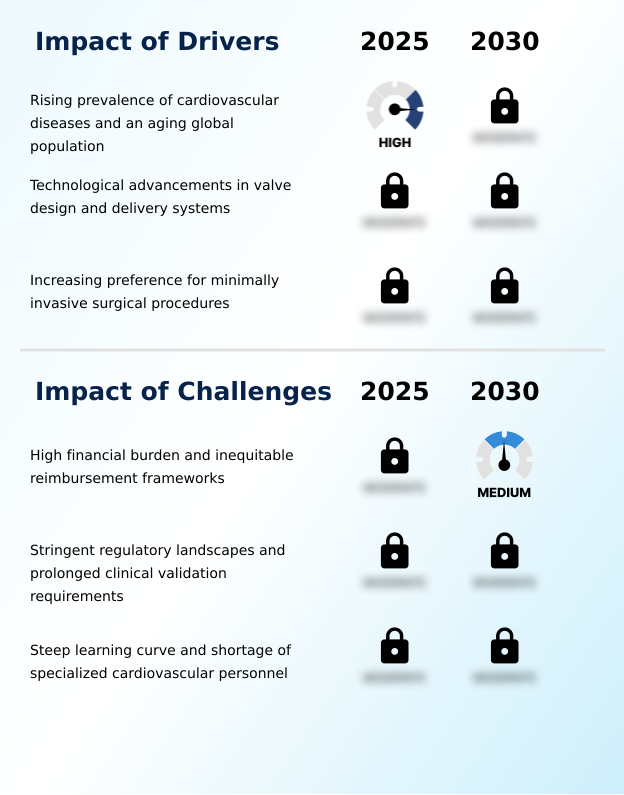
What are the key market drivers leading to the rise in the adoption of Transcatheter Aortic Valve Replacement Industry?

  • The rising prevalence of cardiovascular diseases, coupled with a rapidly aging global population, serves as the primary driver accelerating demand for advanced structural heart interventions.

  • The primary driver propelling the Transcatheter Aortic Valve Replacement is the rapid expansion of clinical indications to include anatomically complex and asymptomatic patient cohorts.
  • Healthcare providers are actively prioritizing myocardial fibrosis prevention by intervening earlier to alleviate chronic left ventricle pressure overload. This proactive clinical approach is supported by the integration of predictive digital modeling, which has increased procedural planning efficiency by 30%.
  • The growing clinical confidence in treating challenging anatomies, such as bicuspid aortic valve morphology, stems directly from technological refinements like the external tissue sealing skirt. These material advancements have reduced post procedural regurgitation rates by 18%.
  • By successfully addressing broader patient demographics, cardiovascular centers maximize their operational throughput and significantly mitigate long term disease progression risks.

What are the market trends shaping the Transcatheter Aortic Valve Replacement Industry?

  • The integration of artificial intelligence and advanced predictive imaging in preprocedural planning represents a transformative market trend. These sophisticated digital tools enhance procedural precision and standardize cardiovascular care pathways.

  • The defining trend reshaping the Transcatheter Aortic Valve Replacement is the aggressive clinical shift toward lifetime disease management and sequential structural interventions. As younger patient demographics present with a progressive degenerative valvular condition, physicians are increasingly adopting a valve in valve procedure to extend patient survivability without open surgery.
  • This strategic transition is driven by the urgent need for long term hemodynamic performance optimization across extending patient lifespans. Consequently, hospitals utilizing a repositionable delivery catheter have improved final device positioning accuracy by 25%. The systemic shift toward minimally invasive secondary interventions has directly decreased intensive care unit utilization by 35%, allowing medical facilities to optimize critical bed availability.
  • Furthermore, these refined percutaneous techniques have reduced the average hospital length of stay by 40% compared to surgical reoperations, fundamentally enhancing institutional resource allocation and patient recovery metrics.

What challenges does the Transcatheter Aortic Valve Replacement Industry face during its growth?

  • The substantial financial burden associated with advanced cardiac devices, combined with inequitable reimbursement frameworks, acts as a major challenge constraining broader market expansion.

  • The Transcatheter Aortic Valve Replacement faces formidable operational challenges stemming from exorbitant capital infrastructure requirements and steep clinical learning curves. Establishing a fully equipped hybrid operating room demands massive financial investments, which has delayed procedural adoption in community hospitals by 25% compared to major tertiary centers.
  • Furthermore, the steep learning curve required for a multidisciplinary heart team to consistently achieve an optimal effective orifice area without complications limits widespread scalability. Operating physicians must meticulously balance achieving an ideal transvalvular pressure gradient while minimizing the permanent pacemaker implantation risk, a clinical compromise that requires extensive specialized training.
  • This critical shortage of certified interventional personnel has increased patient wait times by 15% in underserved regions, forcing healthcare networks to heavily subsidize advanced clinical proctorship programs to maintain service capabilities.

Exclusive Technavio Analysis on Customer Landscape

The transcatheter aortic valve replacement market forecasting report includes the adoption lifecycle of the market, covering from the innovator’s stage to the laggard’s stage. It focuses on adoption rates in different regions based on penetration. Furthermore, the transcatheter aortic valve replacement market report also includes key purchase criteria and drivers of price sensitivity to help companies evaluate and develop their market growth analysis strategies.
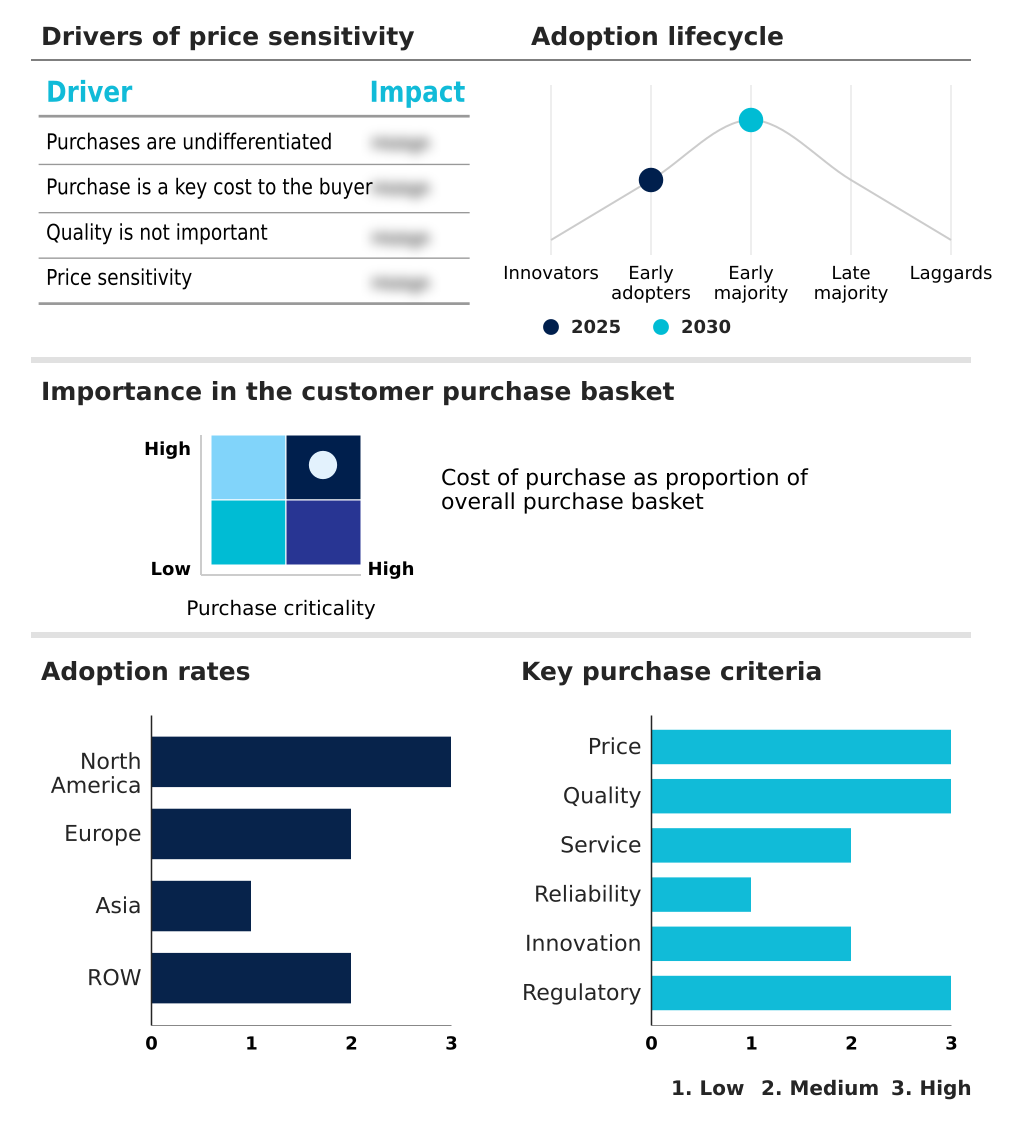
Customer Landscape of Transcatheter Aortic Valve Replacement Industry

Competitive Landscape

Companies are implementing various strategies, such as strategic alliances, transcatheter aortic valve replacement market forecast, partnerships, mergers and acquisitions, geographical expansion, and product/service launches, to enhance their presence in the industry.

Abbott Laboratories - Leading medical technology providers deliver advanced structural heart solutions providing sophisticated transcatheter valve technologies designed to optimize minimally invasive aortic valve replacements for high risk cardiovascular patients.

The industry research and growth report includes detailed analyses of the competitive landscape of the market and information about key companies, including:

  • Abbott Laboratories
  • Anteris Technologies Ltd.
  • Boston Scientific Corp.
  • Colibri Heart Valve LLC
  • Edwards Lifesciences Corp.
  • Foldax Inc.
  • Genesis Medtech International
  • Hangzhou Valgen Medtech Co. Ltd.
  • Hanyu Medical
  • Lepu Medical Co. Ltd.
  • Lifetech Scientific Corp.
  • Medtronic Plc
  • Meril Life Sciences Pvt. Ltd.
  • MicroPort Scientific Corp.
  • Peijia Medical Ltd.
  • Sichuan Mark Hi-Tech Co. Ltd.
  • Sino Medical Sciences Technology
  • Thubrikar Aortic Valve Inc.
  • Venus Medtech Hangzhou Inc.
  • Xeltis AG

Qualitative and quantitative analysis of companies has been conducted to help clients understand the wider business environment as well as the strengths and weaknesses of key industry players. Data is qualitatively analyzed to categorize companies as pure play, category-focused, industry-focused, and diversified; it is quantitatively analyzed to categorize companies as dominant, leading, strong, tentative, and weak.

Recent Development and News in Transcatheter aortic valve replacement market

  • In the Health Care Equipment industry, the rapid deployment of artificial intelligence predictive planning software has standardized preprocedural anatomical assessments, directly impacting Transcatheter Aortic Valve Replacement demand by reducing procedural imaging analysis time by 40%.
  • The widespread adoption of high resolution computed tomography angiography across tertiary medical centers has enhanced diagnostic accuracy for structural anomalies, accelerating Transcatheter Aortic Valve Replacement volume by increasing patient eligibility criteria by 25%.
  • Regulatory mandates enforcing stricter sterilization protocols for complex cardiovascular devices have shifted supply chain dynamics, causing Transcatheter Aortic Valve Replacement manufacturers to reduce the permanent pacemaker implantation risk profile by optimizing their self expanding nitinol frame designs, yielding a 15% drop in adverse events.
  • The integration of advanced three dimensional imaging modality systems into hybrid operating theaters has allowed cardiovascular surgeons to map tortuous vascular anatomies seamlessly, expanding Transcatheter Aortic Valve Replacement adoption in underserved rural demographics by 18%.

Dive into Technavio’s robust research methodology, blending expert interviews, extensive data synthesis, and validated models for unparalleled Transcatheter Aortic Valve Replacement Market insights. See full methodology.

Market Scope
Page number 300
Base year 2025
Historic period 2020-2024
Forecast period 2026-2030
Growth momentum & CAGR Accelerate at a CAGR of 7.1%
Market growth 2026-2030 USD 2862.1 million
Market structure Fragmented
YoY growth 2025-2026(%) 6.7%
Key countries US, Canada, Mexico, Germany, UK, France, Italy, Spain, The Netherlands, Japan, China, South Korea, India, Indonesia, Thailand, Brazil, Saudi Arabia, Turkey, UAE, Argentina, South Africa, Colombia and Israel
Competitive landscape Leading Companies, Market Positioning of Companies, Competitive Strategies, and Industry Risks

Request Free Sample

Research Analyst Overview

  • The Transcatheter Aortic Valve Replacement is continuously evolving as cardiovascular centers refine their procedural algorithms to handle increasingly complex anatomical challenges. Advanced alternative access routes have drastically altered surgical decision making, particularly for patients presenting with hostile peripheral vasculature.
  • Institutions expanding their clinical capabilities have observed a 30% reduction in access site complications by utilizing the subclavian arterial approach over traditional secondary methods. When femoral access is contraindicated, highly trained heart teams seamlessly transition to a transcarotid access pathway to ensure precise structural heart device deployment.
  • The shift away from highly invasive techniques, such as transapical ventricular access and a transaortic surgical incision, has fundamentally optimized operating room turnover and reduced intensive care unit dependencies. Furthermore, ongoing engineering enhancements focused on paravalvular leak mitigation have revolutionized the long term efficacy of severe calcific aortic stenosis interventions.
  • By standardizing these advanced deployment techniques, hospital administrators can optimize their capital equipment budgets and align clinical operations with stringent value based healthcare mandates, ensuring sustained procedural excellence and resource efficiency.

What are the Key Data Covered in this Transcatheter Aortic Valve Replacement Market Research and Growth Report?

  • What is the expected growth of the Transcatheter Aortic Valve Replacement Market between 2026 and 2030?

    • USD 2.86 billion, at a CAGR of 7.1%

  • What segmentation does the market report cover?

    • The report is segmented by End-user (Hospitals, Ambulatory surgical centers, and Others), Type (Balloon-expanding valve, and Self expanding valve), Technique (Transfemoral approach, Transapical approach, Transaortic approach, and Others) and Geography (North America, Europe, Asia, Rest of World (ROW))

  • Which regions are analyzed in the report?

    • North America, Europe, Asia and Rest of World (ROW)

  • What are the key growth drivers and market challenges?

    • Rising prevalence of cardiovascular diseases and an aging global population, High financial burden and inequitable reimbursement frameworks

  • Who are the major players in the Transcatheter Aortic Valve Replacement Market?

    • Abbott Laboratories, Anteris Technologies Ltd., Boston Scientific Corp., Colibri Heart Valve LLC, Edwards Lifesciences Corp., Foldax Inc., Genesis Medtech International, Hangzhou Valgen Medtech Co. Ltd., Hanyu Medical, Lepu Medical Co. Ltd., Lifetech Scientific Corp., Medtronic Plc, Meril Life Sciences Pvt. Ltd., MicroPort Scientific Corp., Peijia Medical Ltd., Sichuan Mark Hi-Tech Co. Ltd., Sino Medical Sciences Technology, Thubrikar Aortic Valve Inc., Venus Medtech Hangzhou Inc. and Xeltis AG

Market Research Insights

  • The Transcatheter Aortic Valve Replacement market is undergoing a structural shift as medical institutions prioritize clinical efficiency and patient safety. Facilities transitioning to outpatient cardiovascular care have achieved a 30% reduction in average hospital stay durations.
  • The adoption of a low profile delivery system has decreased peripheral vascular access complications by 18%, streamlining operational workflows for catheter based structural intervention procedures. Furthermore, integrating a distal embolic protection device during valve deployment has reduced perioperative neurological events by 25%, significantly lowering post-acute rehabilitation expenses.
  • By leveraging a sophisticated shape memory alloy framework, healthcare providers ensure optimal device conformability, maximizing clinical success rates and driving robust procedural volume across regional cardiac centers.

We can help! Our analysts can customize this transcatheter aortic valve replacement market research report to meet your requirements.

Get in touch

1. Executive Summary

1.1 Market overview

Executive Summary - Chart on Market Overview
Executive Summary - Data Table on Market Overview
Executive Summary - Chart on Global Market Characteristics
Executive Summary - Chart on Market by Geography
Executive Summary - Chart on Market Segmentation by End-user
Executive Summary - Chart on Market Segmentation by Type
Executive Summary - Chart on Market Segmentation by Technique
Executive Summary - Chart on Incremental Growth
Executive Summary - Data Table on Incremental Growth
Executive Summary - Chart on Company Market Positioning

2. Technavio Analysis

2.1 Analysis of price sensitivity, lifecycle, customer purchase basket, adoption rates, and purchase criteria

2.2 Criticality of inputs and Factors of differentiation

Chart on Overview on criticality of inputs and factors of differentiation

2.3 Factors of disruption

Chart on Overview on factors of disruption

2.4 Impact of drivers and challenges

Chart on Impact of drivers and challenges in 2025 and 2030

3. Market Landscape

3.1 Market ecosystem

Chart on Parent Market
Data Table on - Parent Market

3.2 Market characteristics

Chart on Market characteristics analysis

3.3 Value chain analysis

Chart on Value chain analysis

4. Market Sizing

4.1 Market definition

Data Table on Offerings of companies included in the market definition

4.2 Market segment analysis

Market segments

4.3 Market size 2025

4.4 Market outlook: Forecast for 2025-2030

Chart on Global - Market size and forecast 2025-2030 ($ million)
Data Table on Global - Market size and forecast 2025-2030 ($ million)
Chart on Global Market: Year-over-year growth 2025-2030 (%)
Data Table on Global Market: Year-over-year growth 2025-2030 (%)

5. Historic Market Size

5.1 Global Transcatheter Aortic Valve Replacement Market 2020 - 2024

Historic Market Size - Data Table on Global Transcatheter Aortic Valve Replacement Market 2020 - 2024 ($ million)

5.2 End-user segment analysis 2020 - 2024

Historic Market Size - End-user Segment 2020 - 2024 ($ million)

5.3 Type segment analysis 2020 - 2024

Historic Market Size - Type Segment 2020 - 2024 ($ million)

5.4 Technique segment analysis 2020 - 2024

Historic Market Size - Technique Segment 2020 - 2024 ($ million)

5.5 Geography segment analysis 2020 - 2024

Historic Market Size - Geography Segment 2020 - 2024 ($ million)

5.6 Country segment analysis 2020 - 2024

Historic Market Size - Country Segment 2020 - 2024 ($ million)

6. Qualitative Analysis

6.1 Impact of AI on global transcatheter aortic valve replacement market

6.2 Impact of geopolitical conflicts on global transcatheter aortic valve replacement market

7. Five Forces Analysis

7.1 Five forces summary

Five forces analysis - Comparison between 2025 and 2030

7.2 Bargaining power of buyers

Bargaining power of buyers - Impact of key factors 2025 and 2030

7.3 Bargaining power of suppliers

Bargaining power of suppliers - Impact of key factors in 2025 and 2030

7.4 Threat of new entrants

Threat of new entrants - Impact of key factors in 2025 and 2030

7.5 Threat of substitutes

Threat of substitutes - Impact of key factors in 2025 and 2030

7.6 Threat of rivalry

Threat of rivalry - Impact of key factors in 2025 and 2030

7.7 Market condition

Chart on Market condition - Five forces 2025 and 2030

8. Market Segmentation by End-user

8.1 Market segments

Chart on End-user - Market share 2025-2030 (%)
Data Table on End-user - Market share 2025-2030 (%)

8.2 Comparison by End-user

Chart on Comparison by End-user
Data Table on Comparison by End-user

8.3 Hospitals - Market size and forecast 2025-2030

Chart on Hospitals - Market size and forecast 2025-2030 ($ million)
Data Table on Hospitals - Market size and forecast 2025-2030 ($ million)
Chart on Hospitals - Year-over-year growth 2025-2030 (%)
Data Table on Hospitals - Year-over-year growth 2025-2030 (%)

8.4 Ambulatory surgical centers - Market size and forecast 2025-2030

Chart on Ambulatory surgical centers - Market size and forecast 2025-2030 ($ million)
Data Table on Ambulatory surgical centers - Market size and forecast 2025-2030 ($ million)
Chart on Ambulatory surgical centers - Year-over-year growth 2025-2030 (%)
Data Table on Ambulatory surgical centers - Year-over-year growth 2025-2030 (%)

8.5 Others - Market size and forecast 2025-2030

Chart on Others - Market size and forecast 2025-2030 ($ million)
Data Table on Others - Market size and forecast 2025-2030 ($ million)
Chart on Others - Year-over-year growth 2025-2030 (%)
Data Table on Others - Year-over-year growth 2025-2030 (%)

8.6 Market opportunity by End-user

Market opportunity by End-user ($ million)
Data Table on Market opportunity by End-user ($ million)

9. Market Segmentation by Type

9.1 Market segments

Chart on Type - Market share 2025-2030 (%)
Data Table on Type - Market share 2025-2030 (%)

9.2 Comparison by Type

Chart on Comparison by Type
Data Table on Comparison by Type

9.3 Balloon-expanding valve - Market size and forecast 2025-2030

Chart on Balloon-expanding valve - Market size and forecast 2025-2030 ($ million)
Data Table on Balloon-expanding valve - Market size and forecast 2025-2030 ($ million)
Chart on Balloon-expanding valve - Year-over-year growth 2025-2030 (%)
Data Table on Balloon-expanding valve - Year-over-year growth 2025-2030 (%)

9.4 Self expanding valve - Market size and forecast 2025-2030

Chart on Self expanding valve - Market size and forecast 2025-2030 ($ million)
Data Table on Self expanding valve - Market size and forecast 2025-2030 ($ million)
Chart on Self expanding valve - Year-over-year growth 2025-2030 (%)
Data Table on Self expanding valve - Year-over-year growth 2025-2030 (%)

9.5 Market opportunity by Type

Market opportunity by Type ($ million)
Data Table on Market opportunity by Type ($ million)

10. Market Segmentation by Technique

10.1 Market segments

Chart on Technique - Market share 2025-2030 (%)
Data Table on Technique - Market share 2025-2030 (%)

10.2 Comparison by Technique

Chart on Comparison by Technique
Data Table on Comparison by Technique

10.3 Transfemoral approach - Market size and forecast 2025-2030

Chart on Transfemoral approach - Market size and forecast 2025-2030 ($ million)
Data Table on Transfemoral approach - Market size and forecast 2025-2030 ($ million)
Chart on Transfemoral approach - Year-over-year growth 2025-2030 (%)
Data Table on Transfemoral approach - Year-over-year growth 2025-2030 (%)

10.4 Transapical approach - Market size and forecast 2025-2030

Chart on Transapical approach - Market size and forecast 2025-2030 ($ million)
Data Table on Transapical approach - Market size and forecast 2025-2030 ($ million)
Chart on Transapical approach - Year-over-year growth 2025-2030 (%)
Data Table on Transapical approach - Year-over-year growth 2025-2030 (%)

10.5 Transaortic approach - Market size and forecast 2025-2030

Chart on Transaortic approach - Market size and forecast 2025-2030 ($ million)
Data Table on Transaortic approach - Market size and forecast 2025-2030 ($ million)
Chart on Transaortic approach - Year-over-year growth 2025-2030 (%)
Data Table on Transaortic approach - Year-over-year growth 2025-2030 (%)

10.6 Others - Market size and forecast 2025-2030

Chart on Others - Market size and forecast 2025-2030 ($ million)
Data Table on Others - Market size and forecast 2025-2030 ($ million)
Chart on Others - Year-over-year growth 2025-2030 (%)
Data Table on Others - Year-over-year growth 2025-2030 (%)

10.7 Market opportunity by Technique

Market opportunity by Technique ($ million)
Data Table on Market opportunity by Technique ($ million)

11. Customer Landscape

11.1 Customer landscape overview

Analysis of price sensitivity, lifecycle, customer purchase basket, adoption rates, and purchase criteria

12. Geographic Landscape

12.1 Geographic segmentation

Chart on Market share by geography 2025-2030 (%)
Data Table on Market share by geography 2025-2030 (%)

12.2 Geographic comparison

Chart on Geographic comparison
Data Table on Geographic comparison

12.3 North America - Market size and forecast 2025-2030

Chart on North America - Market size and forecast 2025-2030 ($ million)
Data Table on North America - Market size and forecast 2025-2030 ($ million)
Chart on North America - Year-over-year growth 2025-2030 (%)
Data Table on North America - Year-over-year growth 2025-2030 (%)
Chart on Regional Comparison - North America
Data Table on Regional Comparison - North America

12.3.1 US - Market size and forecast 2025-2030

Chart on US - Market size and forecast 2025-2030 ($ million)
Data Table on US - Market size and forecast 2025-2030 ($ million)
Chart on US - Year-over-year growth 2025-2030 (%)
Data Table on US - Year-over-year growth 2025-2030 (%)

12.3.2 Canada - Market size and forecast 2025-2030

Chart on Canada - Market size and forecast 2025-2030 ($ million)
Data Table on Canada - Market size and forecast 2025-2030 ($ million)
Chart on Canada - Year-over-year growth 2025-2030 (%)
Data Table on Canada - Year-over-year growth 2025-2030 (%)

12.3.3 Mexico - Market size and forecast 2025-2030

Chart on Mexico - Market size and forecast 2025-2030 ($ million)
Data Table on Mexico - Market size and forecast 2025-2030 ($ million)
Chart on Mexico - Year-over-year growth 2025-2030 (%)
Data Table on Mexico - Year-over-year growth 2025-2030 (%)

12.4 Europe - Market size and forecast 2025-2030

Chart on Europe - Market size and forecast 2025-2030 ($ million)
Data Table on Europe - Market size and forecast 2025-2030 ($ million)
Chart on Europe - Year-over-year growth 2025-2030 (%)
Data Table on Europe - Year-over-year growth 2025-2030 (%)
Chart on Regional Comparison - Europe
Data Table on Regional Comparison - Europe

12.4.1 Germany - Market size and forecast 2025-2030

Chart on Germany - Market size and forecast 2025-2030 ($ million)
Data Table on Germany - Market size and forecast 2025-2030 ($ million)
Chart on Germany - Year-over-year growth 2025-2030 (%)
Data Table on Germany - Year-over-year growth 2025-2030 (%)

12.4.2 UK - Market size and forecast 2025-2030

Chart on UK - Market size and forecast 2025-2030 ($ million)
Data Table on UK - Market size and forecast 2025-2030 ($ million)
Chart on UK - Year-over-year growth 2025-2030 (%)
Data Table on UK - Year-over-year growth 2025-2030 (%)

12.4.3 France - Market size and forecast 2025-2030

Chart on France - Market size and forecast 2025-2030 ($ million)
Data Table on France - Market size and forecast 2025-2030 ($ million)
Chart on France - Year-over-year growth 2025-2030 (%)
Data Table on France - Year-over-year growth 2025-2030 (%)

12.4.4 Italy - Market size and forecast 2025-2030

Chart on Italy - Market size and forecast 2025-2030 ($ million)
Data Table on Italy - Market size and forecast 2025-2030 ($ million)
Chart on Italy - Year-over-year growth 2025-2030 (%)
Data Table on Italy - Year-over-year growth 2025-2030 (%)

12.4.5 Spain - Market size and forecast 2025-2030

Chart on Spain - Market size and forecast 2025-2030 ($ million)
Data Table on Spain - Market size and forecast 2025-2030 ($ million)
Chart on Spain - Year-over-year growth 2025-2030 (%)
Data Table on Spain - Year-over-year growth 2025-2030 (%)

12.4.6 The Netherlands - Market size and forecast 2025-2030

Chart on The Netherlands - Market size and forecast 2025-2030 ($ million)
Data Table on The Netherlands - Market size and forecast 2025-2030 ($ million)
Chart on The Netherlands - Year-over-year growth 2025-2030 (%)
Data Table on The Netherlands - Year-over-year growth 2025-2030 (%)

12.5 Asia - Market size and forecast 2025-2030

Chart on Asia - Market size and forecast 2025-2030 ($ million)
Data Table on Asia - Market size and forecast 2025-2030 ($ million)
Chart on Asia - Year-over-year growth 2025-2030 (%)
Data Table on Asia - Year-over-year growth 2025-2030 (%)
Chart on Regional Comparison - Asia
Data Table on Regional Comparison - Asia

12.5.1 Japan - Market size and forecast 2025-2030

Chart on Japan - Market size and forecast 2025-2030 ($ million)
Data Table on Japan - Market size and forecast 2025-2030 ($ million)
Chart on Japan - Year-over-year growth 2025-2030 (%)
Data Table on Japan - Year-over-year growth 2025-2030 (%)

12.5.2 China - Market size and forecast 2025-2030

Chart on China - Market size and forecast 2025-2030 ($ million)
Data Table on China - Market size and forecast 2025-2030 ($ million)
Chart on China - Year-over-year growth 2025-2030 (%)
Data Table on China - Year-over-year growth 2025-2030 (%)

12.5.3 South Korea - Market size and forecast 2025-2030

Chart on South Korea - Market size and forecast 2025-2030 ($ million)
Data Table on South Korea - Market size and forecast 2025-2030 ($ million)
Chart on South Korea - Year-over-year growth 2025-2030 (%)
Data Table on South Korea - Year-over-year growth 2025-2030 (%)

12.5.4 India - Market size and forecast 2025-2030

Chart on India - Market size and forecast 2025-2030 ($ million)
Data Table on India - Market size and forecast 2025-2030 ($ million)
Chart on India - Year-over-year growth 2025-2030 (%)
Data Table on India - Year-over-year growth 2025-2030 (%)

12.5.5 Indonesia - Market size and forecast 2025-2030

Chart on Indonesia - Market size and forecast 2025-2030 ($ million)
Data Table on Indonesia - Market size and forecast 2025-2030 ($ million)
Chart on Indonesia - Year-over-year growth 2025-2030 (%)
Data Table on Indonesia - Year-over-year growth 2025-2030 (%)

12.5.6 Thailand - Market size and forecast 2025-2030

Chart on Thailand - Market size and forecast 2025-2030 ($ million)
Data Table on Thailand - Market size and forecast 2025-2030 ($ million)
Chart on Thailand - Year-over-year growth 2025-2030 (%)
Data Table on Thailand - Year-over-year growth 2025-2030 (%)

12.6 Rest of World (ROW) - Market size and forecast 2025-2030

Chart on Rest of World (ROW) - Market size and forecast 2025-2030 ($ million)
Data Table on Rest of World (ROW) - Market size and forecast 2025-2030 ($ million)
Chart on Rest of World (ROW) - Year-over-year growth 2025-2030 (%)
Data Table on Rest of World (ROW) - Year-over-year growth 2025-2030 (%)
Chart on Regional Comparison - Rest of World (ROW)
Data Table on Regional Comparison - Rest of World (ROW)

12.6.1 Brazil - Market size and forecast 2025-2030

Chart on Brazil - Market size and forecast 2025-2030 ($ million)
Data Table on Brazil - Market size and forecast 2025-2030 ($ million)
Chart on Brazil - Year-over-year growth 2025-2030 (%)
Data Table on Brazil - Year-over-year growth 2025-2030 (%)

12.6.2 Saudi Arabia - Market size and forecast 2025-2030

Chart on Saudi Arabia - Market size and forecast 2025-2030 ($ million)
Data Table on Saudi Arabia - Market size and forecast 2025-2030 ($ million)
Chart on Saudi Arabia - Year-over-year growth 2025-2030 (%)
Data Table on Saudi Arabia - Year-over-year growth 2025-2030 (%)

12.6.3 Turkey - Market size and forecast 2025-2030

Chart on Turkey - Market size and forecast 2025-2030 ($ million)
Data Table on Turkey - Market size and forecast 2025-2030 ($ million)
Chart on Turkey - Year-over-year growth 2025-2030 (%)
Data Table on Turkey - Year-over-year growth 2025-2030 (%)

12.6.4 UAE - Market size and forecast 2025-2030

Chart on UAE - Market size and forecast 2025-2030 ($ million)
Data Table on UAE - Market size and forecast 2025-2030 ($ million)
Chart on UAE - Year-over-year growth 2025-2030 (%)
Data Table on UAE - Year-over-year growth 2025-2030 (%)

12.6.5 Argentina - Market size and forecast 2025-2030

Chart on Argentina - Market size and forecast 2025-2030 ($ million)
Data Table on Argentina - Market size and forecast 2025-2030 ($ million)
Chart on Argentina - Year-over-year growth 2025-2030 (%)
Data Table on Argentina - Year-over-year growth 2025-2030 (%)

12.6.6 South Africa - Market size and forecast 2025-2030

Chart on South Africa - Market size and forecast 2025-2030 ($ million)
Data Table on South Africa - Market size and forecast 2025-2030 ($ million)
Chart on South Africa - Year-over-year growth 2025-2030 (%)
Data Table on South Africa - Year-over-year growth 2025-2030 (%)

12.6.7 Colombia - Market size and forecast 2025-2030

Chart on Colombia - Market size and forecast 2025-2030 ($ million)
Data Table on Colombia - Market size and forecast 2025-2030 ($ million)
Chart on Colombia - Year-over-year growth 2025-2030 (%)
Data Table on Colombia - Year-over-year growth 2025-2030 (%)

12.6.8 Israel - Market size and forecast 2025-2030

Chart on Israel - Market size and forecast 2025-2030 ($ million)
Data Table on Israel - Market size and forecast 2025-2030 ($ million)
Chart on Israel - Year-over-year growth 2025-2030 (%)
Data Table on Israel - Year-over-year growth 2025-2030 (%)

12.7 Market opportunity by geography

Market opportunity by geography ($ million)
Data Tables on Market opportunity by geography ($ million)

13. Drivers, Challenges, and Opportunity

13.1 Market drivers

Rising prevalence of cardiovascular diseases and an aging global population
Technological advancements in valve design and delivery systems
Increasing preference for minimally invasive surgical procedures

13.2 Market challenges

High financial burden and inequitable reimbursement frameworks
Stringent regulatory landscapes and prolonged clinical validation requirements
Steep learning curve and shortage of specialized cardiovascular personnel

13.3 Impact of drivers and challenges

Impact of drivers and challenges in 2025 and 2030

13.4 Market opportunities

Integration of AI and advanced predictive imaging in preprocedural planning
Emphasis on lifetime management strategies and valve in valve interventions
Clinical expansion into moderate aortic stenosis and asymptomatic patient populations

14. Competitive Landscape

14.1 Overview

14.2

Overview on criticality of inputs and factors of differentiation

14.3 Landscape disruption

Overview on factors of disruption

14.4 Industry risks

Impact of key risks on business

15. Competitive Analysis

15.1 Companies profiled

Companies covered

15.2 Company ranking index

15.3 Market positioning of companies

Matrix on companies position and classification

15.4 Abbott Laboratories

Abbott Laboratories - Overview
Abbott Laboratories - Business segments
Abbott Laboratories - Key news
Abbott Laboratories - Key offerings
Abbott Laboratories - Segment focus
SWOT

15.5 Boston Scientific Corp.

Boston Scientific Corp. - Overview
Boston Scientific Corp. - Business segments
Boston Scientific Corp. - Key offerings
Boston Scientific Corp. - Segment focus
SWOT

15.6 Edwards Lifesciences Corp.

Edwards Lifesciences Corp. - Overview
Edwards Lifesciences Corp. - Business segments
Edwards Lifesciences Corp. - Key news
Edwards Lifesciences Corp. - Key offerings
Edwards Lifesciences Corp. - Segment focus
SWOT

15.7 Genesis Medtech International

Genesis Medtech International - Overview
Genesis Medtech International - Product / Service
Genesis Medtech International - Key offerings
SWOT

15.8 Lepu Medical Co. Ltd.

Lepu Medical Co. Ltd. - Overview
Lepu Medical Co. Ltd. - Product / Service
Lepu Medical Co. Ltd. - Key offerings
SWOT

15.9 Lifetech Scientific Corp.

Lifetech Scientific Corp. - Overview
Lifetech Scientific Corp. - Business segments
Lifetech Scientific Corp. - Key offerings
Lifetech Scientific Corp. - Segment focus
SWOT

15.10 Medtronic Plc

Medtronic Plc - Overview
Medtronic Plc - Business segments
Medtronic Plc - Key news
Medtronic Plc - Key offerings
Medtronic Plc - Segment focus
SWOT

15.11 Meril Life Sciences Pvt. Ltd.

Meril Life Sciences Pvt. Ltd. - Overview
Meril Life Sciences Pvt. Ltd. - Product / Service
Meril Life Sciences Pvt. Ltd. - Key offerings
SWOT

15.12 MicroPort Scientific Corp.

MicroPort Scientific Corp. - Overview
MicroPort Scientific Corp. - Business segments
MicroPort Scientific Corp. - Key offerings
MicroPort Scientific Corp. - Segment focus
SWOT

15.13 Peijia Medical Ltd.

Peijia Medical Ltd. - Overview
Peijia Medical Ltd. - Business segments
Peijia Medical Ltd. - Key offerings
Peijia Medical Ltd. - Segment focus
SWOT

15.14 Sichuan Mark Hi-Tech Co. Ltd.

Sichuan Mark Hi-Tech Co. Ltd. - Overview
Sichuan Mark Hi-Tech Co. Ltd. - Product / Service
Sichuan Mark Hi-Tech Co. Ltd. - Key offerings
SWOT

15.15 Sino Medical Sciences Technology

Sino Medical Sciences Technology - Overview
Sino Medical Sciences Technology - Product / Service
Sino Medical Sciences Technology - Key offerings
SWOT

15.16 Thubrikar Aortic Valve Inc.

Thubrikar Aortic Valve Inc. - Overview
Thubrikar Aortic Valve Inc. - Product / Service
Thubrikar Aortic Valve Inc. - Key offerings
SWOT

15.17 Venus Medtech Hangzhou Inc.

Venus Medtech Hangzhou Inc. - Overview
Venus Medtech Hangzhou Inc. - Product / Service
Venus Medtech Hangzhou Inc. - Key offerings
SWOT

15.18 Xeltis AG

Xeltis AG - Overview
Xeltis AG - Product / Service
Xeltis AG - Key offerings
SWOT

16. Appendix

16.1 Scope of the report

Market definition
Objectives
Notes and caveats

16.2 Inclusions and exclusions checklist

Inclusions checklist
Exclusions checklist

16.3 Currency conversion rates for US$

16.4 Research methodology

16.5 Data procurement

Information sources

16.6 Data validation

16.7 Validation techniques employed for market sizing

16.8 Data synthesis

16.9 360 degree market analysis

16.10 List of abbreviations

Research Methodology

Technavio presents a detailed picture of the market by way of study, synthesis, and summation of data from multiple sources. The analysts have presented the various facets of the market with a particular focus on identifying the key industry influencers. The data thus presented is comprehensive, reliable, and the result of extensive research, both primary and secondary.

INFORMATION SOURCES

Primary sources

  • Manufacturers and suppliers
  • Channel partners
  • Industry experts
  • Strategic decision makers

Secondary sources

  • Industry journals and periodicals
  • Government data
  • Financial reports of key industry players
  • Historical data
  • Press releases

DATA ANALYSIS

Data Synthesis

  • Collation of data
  • Estimation of key figures
  • Analysis of derived insights

Data Validation

  • Triangulation with data models
  • Reference against proprietary databases
  • Corroboration with industry experts

REPORT WRITING

Qualitative

  • Market drivers
  • Market challenges
  • Market trends
  • Five forces analysis

Quantitative

  • Market size and forecast
  • Market segmentation
  • Geographical insights
  • Competitive landscape

Interested in this report?

Get your sample now to see our research methodology and insights!

Download Now

Frequently Asked Questions

Transcatheter Aortic Valve Replacement market growth will increase by USD 2862.1 million during 2026-2030.

The Transcatheter Aortic Valve Replacement market is expected to grow at a CAGR of 7.1% during 2026-2030.

Transcatheter Aortic Valve Replacement market is segmented by End-user (Hospitals, Ambulatory surgical centers, Others) Type (Balloon-expanding valve, Self expanding valve) Technique (Transfemoral approach, Transapical approach, Transaortic approach, Others)

Abbott Laboratories, Anteris Technologies Ltd., Boston Scientific Corp., Colibri Heart Valve LLC, Edwards Lifesciences Corp., Foldax Inc., Genesis Medtech International, Hangzhou Valgen Medtech Co. Ltd., Hanyu Medical, Lepu Medical Co. Ltd., Lifetech Scientific Corp., Medtronic Plc, Meril Life Sciences Pvt. Ltd., MicroPort Scientific Corp., Peijia Medical Ltd., Sichuan Mark Hi-Tech Co. Ltd., Sino Medical Sciences Technology, Thubrikar Aortic Valve Inc., Venus Medtech Hangzhou Inc., Xeltis AG are a few of the key vendors in the Transcatheter Aortic Valve Replacement market.

North America will register the highest growth rate of 37.2% among the other regions. Therefore, the Transcatheter Aortic Valve Replacement market in North America is expected to garner significant business opportunities for the vendors during the forecast period.

US, Canada, Mexico, Germany, UK, France, Italy, Spain, The Netherlands, Japan, China, South Korea, India, Indonesia, Thailand, Brazil, Saudi Arabia, Turkey, UAE, Argentina, South Africa, Colombia, Israel

  • Rising prevalence of cardiovascular diseases and an aging global population is the driving factor this market.

The Transcatheter Aortic Valve Replacement market vendors should focus on grabbing business opportunities from the End-user segment as it accounted for the largest market share in the base year.
RIA - Research AI Assistant
Ask RIA
