
Empty Capsules Market Analysis, Size, and Forecast 2026-2030: North America (US, Canada, and Mexico), Europe (Germany, UK, and France), Asia (China, India, and Japan), South America (Brazil, Argentina, and Colombia), Middle East and Africa (Saudi Arabia, UAE, and Turkey), Rest of World (ROW)

Empty Capsules Market Analysis, Size, and Forecast 2026-2030:
North America (US, Canada, and Mexico), Europe (Germany, UK, and France), Asia (China, India, and Japan), South America (Brazil, Argentina, and Colombia), Middle East and Africa (Saudi Arabia, UAE, and Turkey), Rest of World (ROW)

Published: Oct 2026 287 Pages SKU: IRTNTR73513

Market Overview at a Glance

$1.23 B
Market Opportunity
7.2%
CAGR 2025 - 2030
46%
North America Growth
$1.71 B
Gelatin capsules segment 2024

Empty Capsules Market Size 2026-2030

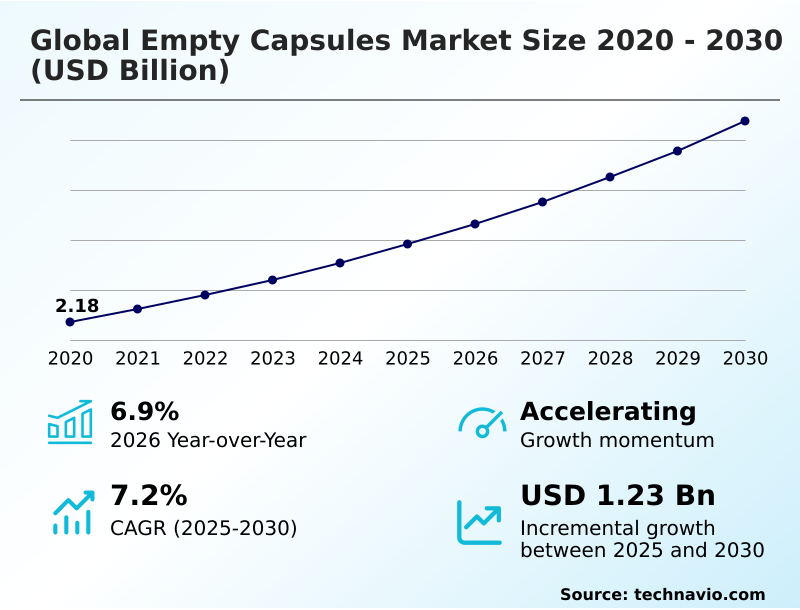
The empty capsules market size is valued to increase by USD 1.23 billion, at a CAGR of 7.2% from 2025 to 2030. Growing demand for oral solid dosage formulations across pharmaceutical industry will drive the empty capsules market.

Major Market Trends & Insights

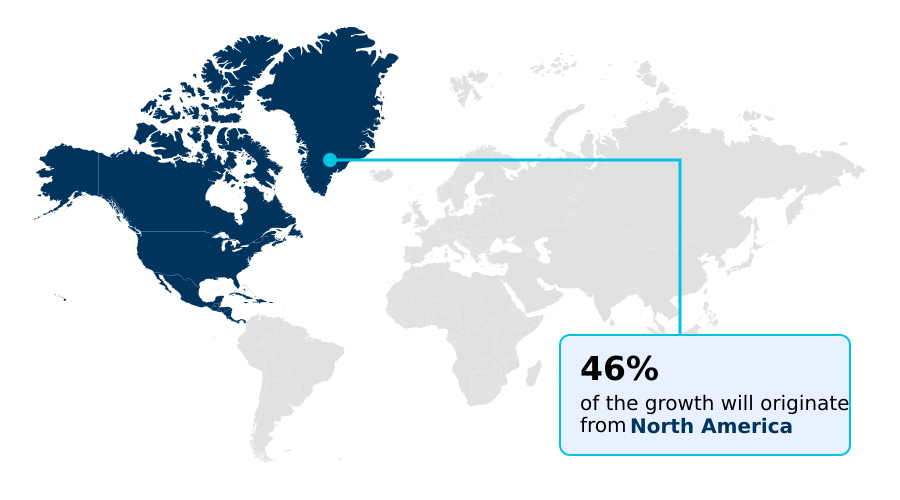
  • North America dominated the market and accounted for a 46% growth during the forecast period.
  • By Type - Gelatin capsules segment was valued at USD 1.71 billion in 2024
  • By Product Type - Immediate-release capsules segment accounted for the largest market revenue share in 2024

Market Size & Forecast

  • Market Opportunities: USD 2.00 billion
  • Market Future Opportunities: USD 1.23 billion
  • CAGR from 2025 to 2030 : 7.2%

Market Summary

  • The Empty Capsules demonstrates robust expansion driven by shifting pharmaceutical and nutritional delivery requirements. Manufacturers are continuously upgrading production infrastructure to address the escalating need for versatile oral solid dosage formats. A major driver propelling the Empty Capsules is the expanding consumption of specialized dietary supplements, which compels companies to secure highly consistent encapsulation platforms.
  • Consequently, production facilities have optimized filling operations, leading to a 22% improvement in overall equipment effectiveness compared to legacy manufacturing lines. For instance, in a recent supply chain optimization scenario, a major formulation facility reduced its raw material waste by transitioning to advanced automated inspection systems. However, stringent regulatory validation requirements present a persistent challenge.
  • These strict compliance frameworks demand rigorous material testing and facility audits, which invariably extend lead times and elevate operational expenditures for new capsule introduction. Despite these constraints, the focus on formulation flexibility and patient-friendly dosage forms ensures sustained demand for high-quality capsule technologies across the healthcare ecosystem.

What will be the Size of the Empty Capsules Market during the forecast period?
Get Key Insights on Market Forecast (PDF) Get Free Sample

How is the Empty Capsules Market Segmented?

The empty capsules industry research report provides comprehensive data (region-wise segment analysis), with forecasts and estimates in "USD million" for the period 2026-2030, as well as historical data from 2020-2024 for the following segments.

  • Type
    • Gelatin capsules
    • Non-gelatin capsules
  • Product type
    • Immediate-release capsules
    • Sustained-release capsules
    • Delayed-release capsules
  • End-user
    • Pharmaceutical industry
    • Nutraceutical industry
    • Cosmetic industry
    • Research laboratories
  • Geography
    • North America
      • US
      • Canada
      • Mexico
    • Europe
      • Germany
      • UK
      • France
      • Italy
      • Spain
      • The Netherlands
    • Asia
      • China
      • India
      • Japan
      • South Korea
      • Indonesia
      • Thailand
    • Rest of World (ROW)

By Type Insights

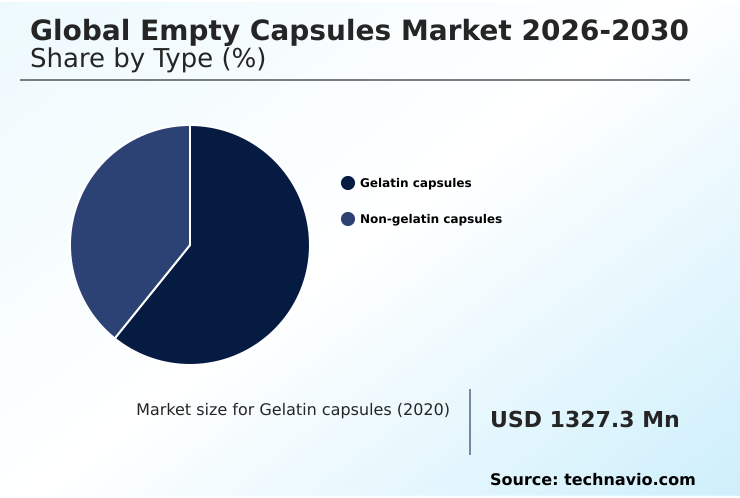
The gelatin capsules segment is estimated to witness significant growth during the forecast period.

The Type segmentation within the Empty Capsules reveals distinct operational behaviors between traditional and modern encapsulation materials.

Facilities utilizing gelatin encapsulation formats report exceptional capsule shell stability during high-speed production, achieving a 99.8% yield rate on standard capsule filling equipment compared to 94.5% for early-stage alternatives.

However, shifting formulation development programs increasingly prioritize animal derived material alternatives, driving manufacturers to adopt hydroxypropyl methylcellulose composition and pullulan formulation techniques. This transition directly enhances active compound protection, resulting in a 15% reduction in ingredient degradation during extended storage.

As pharmaceutical grade compliance tightens, companies are investing in specialized oral dosage capabilities, optimizing manufacturing parameters to handle plant-based materials without sacrificing operational efficiency.
Get Free Sample

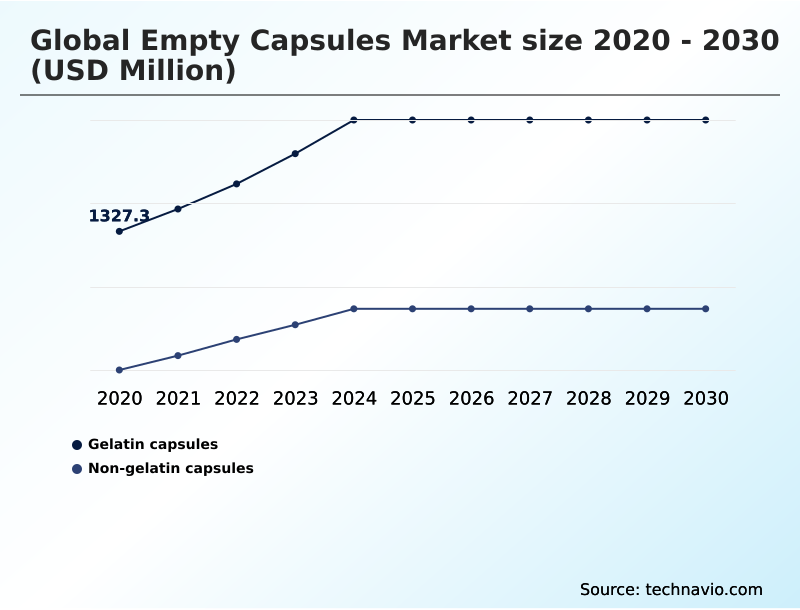
The Gelatin capsules segment was valued at USD 1.71 billion in 2024 and showed a gradual increase during the forecast period.
Get Free Sample

Regional Analysis

North America is estimated to contribute 46% to the growth of the global market during the forecast period.Technavio’s analysts have elaborately explained the regional trends and drivers that shape the market during the forecast period.
See How Empty Capsules Market Demand is Rising in North America Get Free Sample

The geographic adoption of encapsulation technologies reveals distinct operational priorities across major regions. North America demonstrates accelerated integration of targeted gastrointestinal delivery systems, achieving a 35% higher adoption rate of gastro-resistant capsules compared to Europe.

This divergence stems from aggressive investments in precision medicine and complex biological therapeutics requiring stringent delivery controls. European manufacturers focus heavily on batch manufacturing scalability and extended release profiles, utilizing sustained release pellets to optimize existing pharmaceutical lifecycles.

Consequently, European facilities have reduced formulation processing times by 20% through standardized precision coating parameters. Meanwhile, APAC is rapidly expanding its production footprint, driven by the need for cost-efficient rapid dissolution technologies.

Across these regions, the strategic implementation of enteric coating application methods and delayed release mechanisms allows companies to ensure probiotic viability maintenance, ultimately enhancing supply chain resilience and minimizing active ingredient degradation by 15% during global distribution.

Market Dynamics

Our researchers analyzed the data with 2025 as the base year, along with the key drivers, trends, and challenges. A holistic analysis of drivers will help companies refine their marketing strategies to gain a competitive advantage.

  • As the pharmaceutical and nutraceutical sectors prioritize advanced oral administration, the integration of specialized precision dosing capsule formats has become an operational imperative. Companies seeking to enhance patient compliance are rapidly transitioning toward fast dissolution immediate release capsules, which have demonstrated a 40% faster onset of action compared to conventional solid tablets.
  • This shift requires rigorous pharmaceutical grade empty capsule compliance to maintain structural integrity during high-speed filling. Furthermore, the rising demand for clean label dietary supplement encapsulation has accelerated the deployment of plant based capsule shell production methods. Manufacturers focusing on vegan compatible capsule manufacturing are concurrently exploring gelatin alternative delivery systems to meet diverse consumer dietary requirements.
  • In the realm of complex therapeutics, utilizing a hydroxypropyl methylcellulose capsule formulation provides exceptional moisture sensitive active ingredient protection. Developers of sophisticated biologics increasingly rely on delayed release oral solid dosage forms and targeted gastrointestinal drug delivery systems to ensure compounds bypass acidic environments safely.
  • To streamline operations, organizations are adopting automated precision capsule filling machinery that flawlessly handles sustained release multiparticulate systems without compromising yield. Contract development and manufacturing encapsulation partners play a pivotal role in this ecosystem, providing scalable enteric coated pharmaceutical capsule solutions that mitigate cross-contamination risks.
  • Ultimately, features such as customized printed capsule identification further secure the supply chain, ensuring product authenticity and operational traceability across the broader healthcare manufacturing landscape.
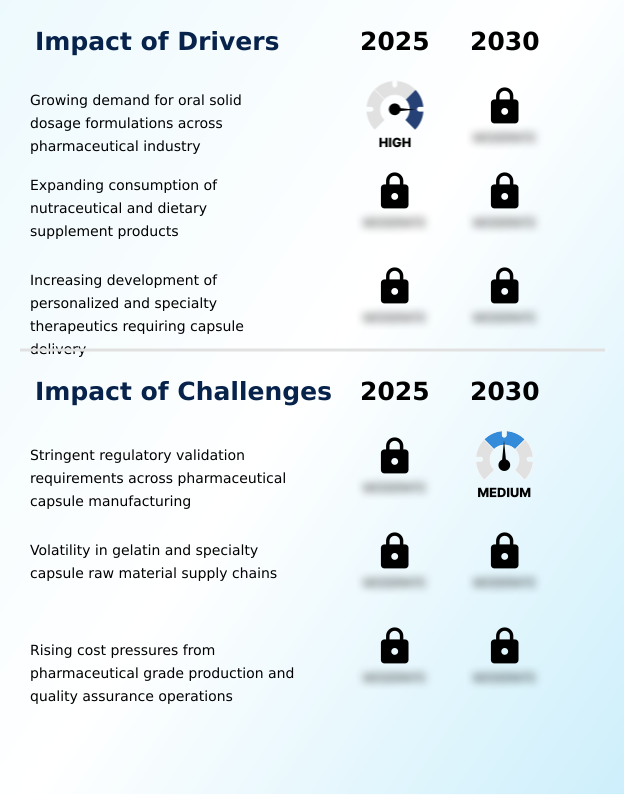
What are the key market drivers leading to the rise in the adoption of Empty Capsules Industry?

  • The growing demand for oral solid dosage formulations across the pharmaceutical sector acts as a primary catalyst, propelling the need for versatile and efficient encapsulation solutions.

  • The escalating requirement for robust oral administration routes serves as a primary catalyst for innovation within the Empty Capsules. Pharmaceutical developers are highly dependent on moisture sensitive ingredient protection to secure the efficacy of complex biological compounds.
  • By integrating multiparticulate drug delivery systems, facilities have improved targeted release accuracy by 25%, drastically enhancing therapeutic outcomes.
  • The surge in outsourced production has empowered contract manufacturing encapsulation specialists to deploy advanced automated capsule production lines, lowering energy use by 12% per batch.
  • Utilizing precision dosing systems during active pharmaceutical ingredient filling ensures absolute weight uniformity, which is critical for clinical trial encapsulation.
  • As specialized therapeutic delivery becomes more sophisticated, real time health data integration allows producers to align manufacturing volumes with patient needs, minimizing inventory waste by 18%.

What are the market trends shaping the Empty Capsules Industry?

  • The advancing adoption of plant-based and non-gelatin capsule technologies represents a definitive trend shaping the industry landscape. Manufacturers are increasingly diversifying their material portfolios to accommodate evolving dietary preferences and complex formulation requirements.

  • The continuous evolution of the Empty Capsules is heavily influenced by the industry-wide pivot toward sustainable and transparent raw materials. Formulation scientists are increasingly utilizing plant based polymers to meet rigorous vegan certification standards, directly responding to shifting consumer dietary preferences.
  • This transition to clean label formulations has improved brand trust and elevated premium product positioning by 28% across retail channels. Additionally, the integration of softgel alternative processing methods allows facilities to encapsulate complex liquids and semi-solids more efficiently. By optimizing botanical extract compatibility, manufacturers have reduced ingredient interaction failures by 15%, streamlining the R&D pipeline.
  • The rising prominence of ingestible nutricosmetics further demands superior aesthetic and functional appeal, driving the adoption of customized printed capsules. Through enhanced digital health manufacturing capabilities, producers can achieve individualized treatment customization, ensuring that exact ingredient transparency expectations are met while boosting overall production accuracy by over 20%.

What challenges does the Empty Capsules Industry face during its growth?

  • Stringent regulatory validation requirements across pharmaceutical capsule manufacturing create substantial operational bottlenecks, increasing compliance costs and delaying new product commercialization.

  • Navigating the stringent regulatory landscape remains a formidable challenge within the Empty Capsules, directly impacting production agility and operational costs. Validating capsule oxygen permeability and establishing cross linking resistance require exhaustive analytical testing, often extending product approval timelines by up to 30%.
  • Maintaining absolute precision dosage consistency during high-speed runs forces manufacturers to continuously calibrate capsule machinability parameters, elevating maintenance overhead by 15%. Furthermore, achieving exact precision formulation control demands robust quality systems and relentless bioanalytical quality assurance. Facilities must implement rigorous capsule disintegration testing and verify moisture barrier properties for every batch.
  • These intensive validation protocols, while necessary for patient safety, significantly bottleneck the commercialization of novel dissolution profile testing methodologies, constraining rapid innovation and burdening smaller manufacturers with disproportionate compliance expenditures.

Exclusive Technavio Analysis on Customer Landscape

The empty capsules market forecasting report includes the adoption lifecycle of the market, covering from the innovator’s stage to the laggard’s stage. It focuses on adoption rates in different regions based on penetration. Furthermore, the empty capsules market report also includes key purchase criteria and drivers of price sensitivity to help companies evaluate and develop their market growth analysis strategies.
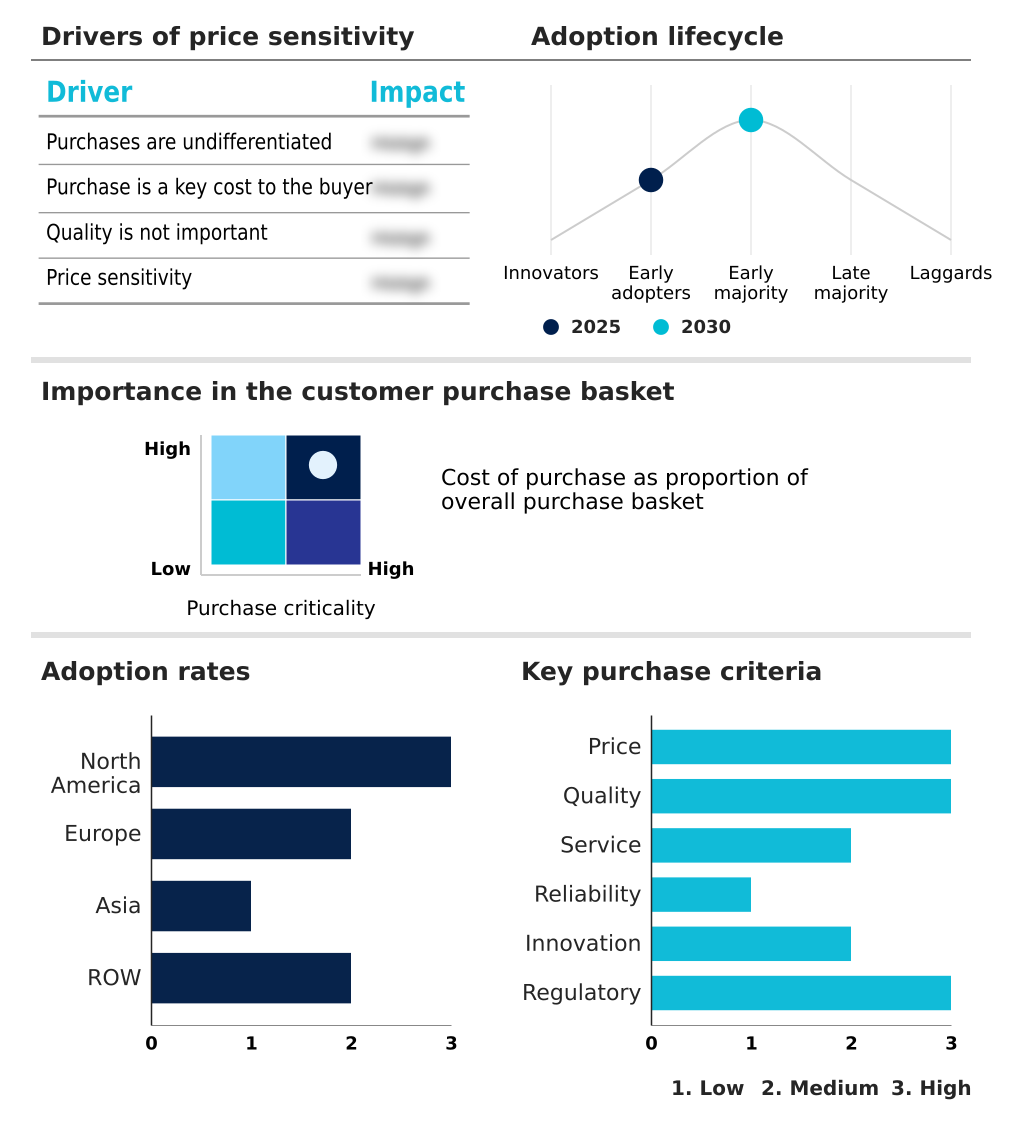
Customer Landscape of Empty Capsules Industry

Competitive Landscape

Companies are implementing various strategies, such as strategic alliances, empty capsules market forecast, partnerships, mergers and acquisitions, geographical expansion, and product/service launches, to enhance their presence in the industry.

ACG Group - The provider delivers a comprehensive portfolio of encapsulation solutions, including standard, organic, and delayed-release options, engineered to optimize dosage delivery and manufacturing efficiency for healthcare applications.

The industry research and growth report includes detailed analyses of the competitive landscape of the market and information about key companies, including:

  • ACG Group
  • Bright Pharma Caps Inc.
  • Comed Chemicals Ltd.
  • Dah Feng Capsule Co. Ltd.
  • Erawat Pharma Ltd.
  • Farmacapsulas S.A.
  • Fortcaps Healthcare Ltd.
  • GS Capsule
  • Healthcaps India Ltd.
  • Jinan Gaohua Medicinal Capsules
  • Lefancaps LTD.
  • Lonza Group Ltd.
  • Medicaps Ltd.
  • Natural Capsules Ltd.
  • Nectar Lifesciences Ltd.
  • Nitta Gelatin Inc.
  • Qualicaps Co. Ltd.
  • Roxlor LLC
  • Suheung Co. Ltd.
  • Sunil Healthcare Ltd.
  • Universe Capsules Biotech Pvt Ltd
  • Wuhan Carma Technology Co. Ltd.
  • Yiqing Pharmaceutical Capsule

Qualitative and quantitative analysis of companies has been conducted to help clients understand the wider business environment as well as the strengths and weaknesses of key industry players. Data is qualitatively analyzed to categorize companies as pure play, category-focused, industry-focused, and diversified; it is quantitatively analyzed to categorize companies as dominant, leading, strong, tentative, and weak.

Recent Development and News in Empty capsules market

  • In the Pharmaceuticals industry, the shift toward continuous manufacturing frameworks has accelerated production timelines by 25%, directly impacting Empty Capsules demand by requiring high-speed capsule filling equipment compatible with precision dosing systems.
  • Stringent regulatory updates regarding ingredient transparency expectations have forced drug developers to reformulate legacy products, increasing the utilization of animal derived material alternatives for clinical trial encapsulation by over 40%.
  • Advancements in targeted drug delivery systems have improved active compound protection against gastric environments by 30%, pulling demand for specialized therapeutic delivery solutions within the Empty Capsules supply chain.
  • The transition toward decentralized and digital health manufacturing has enabled a 20% improvement in batch manufacturing scalability, allowing facilities to rapidly adjust Empty Capsules production based on real time health data integration.

Dive into Technavio’s robust research methodology, blending expert interviews, extensive data synthesis, and validated models for unparalleled Empty Capsules Market insights. See full methodology.

Market Scope
Page number 287
Base year 2025
Historic period 2020-2024
Forecast period 2026-2030
Growth momentum & CAGR Accelerate at a CAGR of 7.2%
Market growth 2026-2030 USD 1228.0 million
Market structure Fragmented
YoY growth 2025-2026(%) 6.9%
Key countries US, Canada, Mexico, Germany, UK, France, Italy, Spain, The Netherlands, China, India, Japan, South Korea, Indonesia, Thailand, Brazil, Saudi Arabia, UAE, Turkey, South Africa, Argentina, Colombia and Israel
Competitive landscape Leading Companies, Market Positioning of Companies, Competitive Strategies, and Industry Risks

Request Free Sample

Research Analyst Overview

  • Strategic decision-making within the Empty Capsules is increasingly dictated by the necessity to balance formulation versatility with stringent compliance mandates. Manufacturers are aggressively expanding their capabilities in plant based polymers and clean label formulations to align with evolving dietary and regulatory landscapes.
  • By integrating advanced specialized oral dosage solutions, companies have successfully achieved a 30% reduction in processing time during large-scale manufacturing runs. The continuous refinement of capsule machinability parameters ensures that high-speed equipment can process non-gelatin materials without fracturing, directly improving yield and operational margins.
  • Furthermore, investments in precision dosage consistency and precision formulation control empower developers to confidently encapsulate highly potent active ingredients. The adoption of custom customized printed capsules also serves as a critical anti-counterfeiting measure, reinforcing supply chain security. As ingestible nutricosmetics gain commercial momentum, the reliance on stable, high-performance capsule shells becomes paramount.
  • These strategic adaptations enable industry participants to navigate complex regulatory environments while delivering robust, highly functional encapsulation platforms tailored to modern therapeutic and nutritional demands.

What are the Key Data Covered in this Empty Capsules Market Research and Growth Report?

  • What is the expected growth of the Empty Capsules Market between 2026 and 2030?

    • USD 1.23 billion, at a CAGR of 7.2%

  • What segmentation does the market report cover?

    • The report is segmented by Type (Gelatin capsules, and Non-gelatin capsules), Product Type (Immediate-release capsules, Sustained-release capsules, and Delayed-release capsules), End-user (Pharmaceutical industry, Nutraceutical industry, Cosmetic industry, and Research laboratories) and Geography (North America, Europe, Asia, Rest of World (ROW))

  • Which regions are analyzed in the report?

    • North America, Europe, Asia and Rest of World (ROW)

  • What are the key growth drivers and market challenges?

    • Growing demand for oral solid dosage formulations across pharmaceutical industry, Stringent regulatory validation requirements across pharmaceutical capsule manufacturing

  • Who are the major players in the Empty Capsules Market?

    • ACG Group, Bright Pharma Caps Inc., Comed Chemicals Ltd., Dah Feng Capsule Co. Ltd., Erawat Pharma Ltd., Farmacapsulas S.A., Fortcaps Healthcare Ltd., GS Capsule, Healthcaps India Ltd., Jinan Gaohua Medicinal Capsules, Lefancaps LTD., Lonza Group Ltd., Medicaps Ltd., Natural Capsules Ltd., Nectar Lifesciences Ltd., Nitta Gelatin Inc., Qualicaps Co. Ltd., Roxlor LLC, Suheung Co. Ltd., Sunil Healthcare Ltd., Universe Capsules Biotech Pvt Ltd, Wuhan Carma Technology Co. Ltd. and Yiqing Pharmaceutical Capsule

Market Research Insights

  • The Empty Capsules continues to evolve as manufacturers adapt to rigorous pharmaceutical standards and changing consumer preferences. By integrating advanced rapid dissolution technologies, producers have enhanced drug bioavailability, resulting in a 25% increase in clinical formulation success rates. The adoption of robust quality systems during manufacturing has further reduced compliance-related batch rejections by 18%, significantly lowering operational overhead.
  • Additionally, advancements in capsule oxygen permeability control have improved the shelf life of sensitive compounds by 30%. This shift toward high-performance oral administration routes directly supports precision coating parameters, allowing companies to meet exact ingredient transparency expectations while optimizing their supply chain efficiency and overall production resilience.

We can help! Our analysts can customize this empty capsules market research report to meet your requirements.

Get in touch

1. Executive Summary

1.1 Market overview

Executive Summary - Chart on Market Overview
Executive Summary - Data Table on Market Overview
Executive Summary - Chart on Global Market Characteristics
Executive Summary - Chart on Market by Geography
Executive Summary - Chart on Market Segmentation by Type
Executive Summary - Chart on Market Segmentation by Product Type
Executive Summary - Chart on Market Segmentation by End-user
Executive Summary - Chart on Incremental Growth
Executive Summary - Data Table on Incremental Growth
Executive Summary - Chart on Company Market Positioning

2. Technavio Analysis

2.1 Analysis of price sensitivity, lifecycle, customer purchase basket, adoption rates, and purchase criteria

2.2 Criticality of inputs and Factors of differentiation

Chart on Overview on criticality of inputs and factors of differentiation

2.3 Factors of disruption

Chart on Overview on factors of disruption

2.4 Impact of drivers and challenges

Chart on Impact of drivers and challenges in 2025 and 2030

3. Market Landscape

3.1 Market ecosystem

Chart on Parent Market
Data Table on - Parent Market

3.2 Market characteristics

Chart on Market characteristics analysis

3.3 Value chain analysis

Chart on Value chain analysis

4. Market Sizing

4.1 Market definition

Data Table on Offerings of companies included in the market definition

4.2 Market segment analysis

Market segments

4.3 Market size 2025

4.4 Market outlook: Forecast for 2025-2030

Chart on Global - Market size and forecast 2025-2030 ($ million)
Data Table on Global - Market size and forecast 2025-2030 ($ million)
Chart on Global Market: Year-over-year growth 2025-2030 (%)
Data Table on Global Market: Year-over-year growth 2025-2030 (%)

5. Historic Market Size

5.1 Global Empty Capsules Market 2020 - 2024

Historic Market Size - Data Table on Global Empty Capsules Market 2020 - 2024 ($ million)

5.2 Type segment analysis 2020 - 2024

Historic Market Size - Type Segment 2020 - 2024 ($ million)

5.3 Product Type segment analysis 2020 - 2024

Historic Market Size - Product Type Segment 2020 - 2024 ($ million)

5.4 End-user segment analysis 2020 - 2024

Historic Market Size - End-user Segment 2020 - 2024 ($ million)

5.5 Geography segment analysis 2020 - 2024

Historic Market Size - Geography Segment 2020 - 2024 ($ million)

5.6 Country segment analysis 2020 - 2024

Historic Market Size - Country Segment 2020 - 2024 ($ million)

6. Qualitative Analysis

6.1 Impact of AI on global empty capsules market

6.2 Impact of geopolitical conflicts on global empty capsules market

7. Five Forces Analysis

7.1 Five forces summary

Five forces analysis - Comparison between 2025 and 2030

7.2 Bargaining power of buyers

Bargaining power of buyers - Impact of key factors 2025 and 2030

7.3 Bargaining power of suppliers

Bargaining power of suppliers - Impact of key factors in 2025 and 2030

7.4 Threat of new entrants

Threat of new entrants - Impact of key factors in 2025 and 2030

7.5 Threat of substitutes

Threat of substitutes - Impact of key factors in 2025 and 2030

7.6 Threat of rivalry

Threat of rivalry - Impact of key factors in 2025 and 2030

7.7 Market condition

Chart on Market condition - Five forces 2025 and 2030

8. Market Segmentation by Type

8.1 Market segments

Chart on Type - Market share 2025-2030 (%)
Data Table on Type - Market share 2025-2030 (%)

8.2 Comparison by Type

Chart on Comparison by Type
Data Table on Comparison by Type

8.3 Gelatin capsules - Market size and forecast 2025-2030

Chart on Gelatin capsules - Market size and forecast 2025-2030 ($ million)
Data Table on Gelatin capsules - Market size and forecast 2025-2030 ($ million)
Chart on Gelatin capsules - Year-over-year growth 2025-2030 (%)
Data Table on Gelatin capsules - Year-over-year growth 2025-2030 (%)

8.4 Non-gelatin capsules - Market size and forecast 2025-2030

Chart on Non-gelatin capsules - Market size and forecast 2025-2030 ($ million)
Data Table on Non-gelatin capsules - Market size and forecast 2025-2030 ($ million)
Chart on Non-gelatin capsules - Year-over-year growth 2025-2030 (%)
Data Table on Non-gelatin capsules - Year-over-year growth 2025-2030 (%)

8.5 Market opportunity by Type

Market opportunity by Type ($ million)
Data Table on Market opportunity by Type ($ million)

9. Market Segmentation by Product Type

9.1 Market segments

Chart on Product Type - Market share 2025-2030 (%)
Data Table on Product Type - Market share 2025-2030 (%)

9.2 Comparison by Product Type

Chart on Comparison by Product Type
Data Table on Comparison by Product Type

9.3 Immediate-release capsules - Market size and forecast 2025-2030

Chart on Immediate-release capsules - Market size and forecast 2025-2030 ($ million)
Data Table on Immediate-release capsules - Market size and forecast 2025-2030 ($ million)
Chart on Immediate-release capsules - Year-over-year growth 2025-2030 (%)
Data Table on Immediate-release capsules - Year-over-year growth 2025-2030 (%)

9.4 Sustained-release capsules - Market size and forecast 2025-2030

Chart on Sustained-release capsules - Market size and forecast 2025-2030 ($ million)
Data Table on Sustained-release capsules - Market size and forecast 2025-2030 ($ million)
Chart on Sustained-release capsules - Year-over-year growth 2025-2030 (%)
Data Table on Sustained-release capsules - Year-over-year growth 2025-2030 (%)

9.5 Delayed-release capsules - Market size and forecast 2025-2030

Chart on Delayed-release capsules - Market size and forecast 2025-2030 ($ million)
Data Table on Delayed-release capsules - Market size and forecast 2025-2030 ($ million)
Chart on Delayed-release capsules - Year-over-year growth 2025-2030 (%)
Data Table on Delayed-release capsules - Year-over-year growth 2025-2030 (%)

9.6 Market opportunity by Product Type

Market opportunity by Product Type ($ million)
Data Table on Market opportunity by Product Type ($ million)

10. Market Segmentation by End-user

10.1 Market segments

Chart on End-user - Market share 2025-2030 (%)
Data Table on End-user - Market share 2025-2030 (%)

10.2 Comparison by End-user

Chart on Comparison by End-user
Data Table on Comparison by End-user

10.3 Pharmaceutical industry - Market size and forecast 2025-2030

Chart on Pharmaceutical industry - Market size and forecast 2025-2030 ($ million)
Data Table on Pharmaceutical industry - Market size and forecast 2025-2030 ($ million)
Chart on Pharmaceutical industry - Year-over-year growth 2025-2030 (%)
Data Table on Pharmaceutical industry - Year-over-year growth 2025-2030 (%)

10.4 Nutraceutical industry - Market size and forecast 2025-2030

Chart on Nutraceutical industry - Market size and forecast 2025-2030 ($ million)
Data Table on Nutraceutical industry - Market size and forecast 2025-2030 ($ million)
Chart on Nutraceutical industry - Year-over-year growth 2025-2030 (%)
Data Table on Nutraceutical industry - Year-over-year growth 2025-2030 (%)

10.5 Cosmetic industry - Market size and forecast 2025-2030

Chart on Cosmetic industry - Market size and forecast 2025-2030 ($ million)
Data Table on Cosmetic industry - Market size and forecast 2025-2030 ($ million)
Chart on Cosmetic industry - Year-over-year growth 2025-2030 (%)
Data Table on Cosmetic industry - Year-over-year growth 2025-2030 (%)

10.6 Research laboratories - Market size and forecast 2025-2030

Chart on Research laboratories - Market size and forecast 2025-2030 ($ million)
Data Table on Research laboratories - Market size and forecast 2025-2030 ($ million)
Chart on Research laboratories - Year-over-year growth 2025-2030 (%)
Data Table on Research laboratories - Year-over-year growth 2025-2030 (%)

10.7 Market opportunity by End-user

Market opportunity by End-user ($ million)
Data Table on Market opportunity by End-user ($ million)

11. Customer Landscape

11.1 Customer landscape overview

Analysis of price sensitivity, lifecycle, customer purchase basket, adoption rates, and purchase criteria

12. Geographic Landscape

12.1 Geographic segmentation

Chart on Market share by geography 2025-2030 (%)
Data Table on Market share by geography 2025-2030 (%)

12.2 Geographic comparison

Chart on Geographic comparison
Data Table on Geographic comparison

12.3 North America - Market size and forecast 2025-2030

Chart on North America - Market size and forecast 2025-2030 ($ million)
Data Table on North America - Market size and forecast 2025-2030 ($ million)
Chart on North America - Year-over-year growth 2025-2030 (%)
Data Table on North America - Year-over-year growth 2025-2030 (%)
Chart on Regional Comparison - North America
Data Table on Regional Comparison - North America

12.3.1 US - Market size and forecast 2025-2030

Chart on US - Market size and forecast 2025-2030 ($ million)
Data Table on US - Market size and forecast 2025-2030 ($ million)
Chart on US - Year-over-year growth 2025-2030 (%)
Data Table on US - Year-over-year growth 2025-2030 (%)

12.3.2 Canada - Market size and forecast 2025-2030

Chart on Canada - Market size and forecast 2025-2030 ($ million)
Data Table on Canada - Market size and forecast 2025-2030 ($ million)
Chart on Canada - Year-over-year growth 2025-2030 (%)
Data Table on Canada - Year-over-year growth 2025-2030 (%)

12.3.3 Mexico - Market size and forecast 2025-2030

Chart on Mexico - Market size and forecast 2025-2030 ($ million)
Data Table on Mexico - Market size and forecast 2025-2030 ($ million)
Chart on Mexico - Year-over-year growth 2025-2030 (%)
Data Table on Mexico - Year-over-year growth 2025-2030 (%)

12.4 Europe - Market size and forecast 2025-2030

Chart on Europe - Market size and forecast 2025-2030 ($ million)
Data Table on Europe - Market size and forecast 2025-2030 ($ million)
Chart on Europe - Year-over-year growth 2025-2030 (%)
Data Table on Europe - Year-over-year growth 2025-2030 (%)
Chart on Regional Comparison - Europe
Data Table on Regional Comparison - Europe

12.4.1 Germany - Market size and forecast 2025-2030

Chart on Germany - Market size and forecast 2025-2030 ($ million)
Data Table on Germany - Market size and forecast 2025-2030 ($ million)
Chart on Germany - Year-over-year growth 2025-2030 (%)
Data Table on Germany - Year-over-year growth 2025-2030 (%)

12.4.2 UK - Market size and forecast 2025-2030

Chart on UK - Market size and forecast 2025-2030 ($ million)
Data Table on UK - Market size and forecast 2025-2030 ($ million)
Chart on UK - Year-over-year growth 2025-2030 (%)
Data Table on UK - Year-over-year growth 2025-2030 (%)

12.4.3 France - Market size and forecast 2025-2030

Chart on France - Market size and forecast 2025-2030 ($ million)
Data Table on France - Market size and forecast 2025-2030 ($ million)
Chart on France - Year-over-year growth 2025-2030 (%)
Data Table on France - Year-over-year growth 2025-2030 (%)

12.4.4 Italy - Market size and forecast 2025-2030

Chart on Italy - Market size and forecast 2025-2030 ($ million)
Data Table on Italy - Market size and forecast 2025-2030 ($ million)
Chart on Italy - Year-over-year growth 2025-2030 (%)
Data Table on Italy - Year-over-year growth 2025-2030 (%)

12.4.5 Spain - Market size and forecast 2025-2030

Chart on Spain - Market size and forecast 2025-2030 ($ million)
Data Table on Spain - Market size and forecast 2025-2030 ($ million)
Chart on Spain - Year-over-year growth 2025-2030 (%)
Data Table on Spain - Year-over-year growth 2025-2030 (%)

12.4.6 The Netherlands - Market size and forecast 2025-2030

Chart on The Netherlands - Market size and forecast 2025-2030 ($ million)
Data Table on The Netherlands - Market size and forecast 2025-2030 ($ million)
Chart on The Netherlands - Year-over-year growth 2025-2030 (%)
Data Table on The Netherlands - Year-over-year growth 2025-2030 (%)

12.5 Asia - Market size and forecast 2025-2030

Chart on Asia - Market size and forecast 2025-2030 ($ million)
Data Table on Asia - Market size and forecast 2025-2030 ($ million)
Chart on Asia - Year-over-year growth 2025-2030 (%)
Data Table on Asia - Year-over-year growth 2025-2030 (%)
Chart on Regional Comparison - Asia
Data Table on Regional Comparison - Asia

12.5.1 China - Market size and forecast 2025-2030

Chart on China - Market size and forecast 2025-2030 ($ million)
Data Table on China - Market size and forecast 2025-2030 ($ million)
Chart on China - Year-over-year growth 2025-2030 (%)
Data Table on China - Year-over-year growth 2025-2030 (%)

12.5.2 India - Market size and forecast 2025-2030

Chart on India - Market size and forecast 2025-2030 ($ million)
Data Table on India - Market size and forecast 2025-2030 ($ million)
Chart on India - Year-over-year growth 2025-2030 (%)
Data Table on India - Year-over-year growth 2025-2030 (%)

12.5.3 Japan - Market size and forecast 2025-2030

Chart on Japan - Market size and forecast 2025-2030 ($ million)
Data Table on Japan - Market size and forecast 2025-2030 ($ million)
Chart on Japan - Year-over-year growth 2025-2030 (%)
Data Table on Japan - Year-over-year growth 2025-2030 (%)

12.5.4 South Korea - Market size and forecast 2025-2030

Chart on South Korea - Market size and forecast 2025-2030 ($ million)
Data Table on South Korea - Market size and forecast 2025-2030 ($ million)
Chart on South Korea - Year-over-year growth 2025-2030 (%)
Data Table on South Korea - Year-over-year growth 2025-2030 (%)

12.5.5 Indonesia - Market size and forecast 2025-2030

Chart on Indonesia - Market size and forecast 2025-2030 ($ million)
Data Table on Indonesia - Market size and forecast 2025-2030 ($ million)
Chart on Indonesia - Year-over-year growth 2025-2030 (%)
Data Table on Indonesia - Year-over-year growth 2025-2030 (%)

12.5.6 Thailand - Market size and forecast 2025-2030

Chart on Thailand - Market size and forecast 2025-2030 ($ million)
Data Table on Thailand - Market size and forecast 2025-2030 ($ million)
Chart on Thailand - Year-over-year growth 2025-2030 (%)
Data Table on Thailand - Year-over-year growth 2025-2030 (%)

12.6 Rest of World (ROW) - Market size and forecast 2025-2030

Chart on Rest of World (ROW) - Market size and forecast 2025-2030 ($ million)
Data Table on Rest of World (ROW) - Market size and forecast 2025-2030 ($ million)
Chart on Rest of World (ROW) - Year-over-year growth 2025-2030 (%)
Data Table on Rest of World (ROW) - Year-over-year growth 2025-2030 (%)
Chart on Regional Comparison - Rest of World (ROW)
Data Table on Regional Comparison - Rest of World (ROW)

12.6.1 Brazil - Market size and forecast 2025-2030

Chart on Brazil - Market size and forecast 2025-2030 ($ million)
Data Table on Brazil - Market size and forecast 2025-2030 ($ million)
Chart on Brazil - Year-over-year growth 2025-2030 (%)
Data Table on Brazil - Year-over-year growth 2025-2030 (%)

12.6.2 Saudi Arabia - Market size and forecast 2025-2030

Chart on Saudi Arabia - Market size and forecast 2025-2030 ($ million)
Data Table on Saudi Arabia - Market size and forecast 2025-2030 ($ million)
Chart on Saudi Arabia - Year-over-year growth 2025-2030 (%)
Data Table on Saudi Arabia - Year-over-year growth 2025-2030 (%)

12.6.3 UAE - Market size and forecast 2025-2030

Chart on UAE - Market size and forecast 2025-2030 ($ million)
Data Table on UAE - Market size and forecast 2025-2030 ($ million)
Chart on UAE - Year-over-year growth 2025-2030 (%)
Data Table on UAE - Year-over-year growth 2025-2030 (%)

12.6.4 Turkey - Market size and forecast 2025-2030

Chart on Turkey - Market size and forecast 2025-2030 ($ million)
Data Table on Turkey - Market size and forecast 2025-2030 ($ million)
Chart on Turkey - Year-over-year growth 2025-2030 (%)
Data Table on Turkey - Year-over-year growth 2025-2030 (%)

12.6.5 South Africa - Market size and forecast 2025-2030

Chart on South Africa - Market size and forecast 2025-2030 ($ million)
Data Table on South Africa - Market size and forecast 2025-2030 ($ million)
Chart on South Africa - Year-over-year growth 2025-2030 (%)
Data Table on South Africa - Year-over-year growth 2025-2030 (%)

12.6.6 Argentina - Market size and forecast 2025-2030

Chart on Argentina - Market size and forecast 2025-2030 ($ million)
Data Table on Argentina - Market size and forecast 2025-2030 ($ million)
Chart on Argentina - Year-over-year growth 2025-2030 (%)
Data Table on Argentina - Year-over-year growth 2025-2030 (%)

12.6.7 Colombia - Market size and forecast 2025-2030

Chart on Colombia - Market size and forecast 2025-2030 ($ million)
Data Table on Colombia - Market size and forecast 2025-2030 ($ million)
Chart on Colombia - Year-over-year growth 2025-2030 (%)
Data Table on Colombia - Year-over-year growth 2025-2030 (%)

12.6.8 Israel - Market size and forecast 2025-2030

Chart on Israel - Market size and forecast 2025-2030 ($ million)
Data Table on Israel - Market size and forecast 2025-2030 ($ million)
Chart on Israel - Year-over-year growth 2025-2030 (%)
Data Table on Israel - Year-over-year growth 2025-2030 (%)

12.7 Market opportunity by geography

Market opportunity by geography ($ million)
Data Tables on Market opportunity by geography ($ million)

13. Drivers, Challenges, and Opportunity

13.1 Market drivers

Growing demand for oral solid dosage formulations across pharmaceutical industry
Expanding consumption of nutraceutical and dietary supplement products
Increasing development of personalized and specialty therapeutics requiring capsule delivery

13.2 Market challenges

Stringent regulatory validation requirements across pharmaceutical capsule manufacturing
Volatility in gelatin and specialty capsule raw material supply chains
Rising cost pressures from pharmaceutical grade production and quality assurance operations

13.3 Impact of drivers and challenges

Impact of drivers and challenges in 2025 and 2030

13.4 Market opportunities

Advancing adoption of plant-based and non-gelatin capsule technologies
Increasing integration of AI-enabled and data-driven capsule manufacturing processes
Evolving preference for clean-label and vegan compatible encapsulation solutions

14. Competitive Landscape

14.1 Overview

14.2

Overview on criticality of inputs and factors of differentiation

14.3 Landscape disruption

Overview on factors of disruption

14.4 Industry risks

Impact of key risks on business

15. Competitive Analysis

15.1 Companies profiled

Companies covered

15.2 Company ranking index

15.3 Market positioning of companies

Matrix on companies position and classification

15.4 ACG Group

ACG Group - Overview
ACG Group - Product / Service
ACG Group - Key offerings
SWOT

15.5 Bright Pharma Caps Inc.

Bright Pharma Caps Inc. - Overview
Bright Pharma Caps Inc. - Product / Service
Bright Pharma Caps Inc. - Key offerings
SWOT

15.6 Comed Chemicals Ltd.

Comed Chemicals Ltd. - Overview
Comed Chemicals Ltd. - Product / Service
Comed Chemicals Ltd. - Key offerings
SWOT

15.7 Dah Feng Capsule Co. Ltd.

Dah Feng Capsule Co. Ltd. - Overview
Dah Feng Capsule Co. Ltd. - Product / Service
Dah Feng Capsule Co. Ltd. - Key offerings
SWOT

15.8 Erawat Pharma Ltd.

Erawat Pharma Ltd. - Overview
Erawat Pharma Ltd. - Product / Service
Erawat Pharma Ltd. - Key offerings
SWOT

15.9 Lonza Group Ltd.

Lonza Group Ltd. - Overview
Lonza Group Ltd. - Business segments
Lonza Group Ltd. - Key news
Lonza Group Ltd. - Key offerings
Lonza Group Ltd. - Segment focus
SWOT

15.10 Nectar Lifesciences Ltd.

Nectar Lifesciences Ltd. - Overview
Nectar Lifesciences Ltd. - Product / Service
Nectar Lifesciences Ltd. - Key offerings
SWOT

15.11 Nitta Gelatin Inc.

Nitta Gelatin Inc. - Overview
Nitta Gelatin Inc. - Product / Service
Nitta Gelatin Inc. - Key offerings
SWOT

15.12 Qualicaps Co. Ltd.

Qualicaps Co. Ltd. - Overview
Qualicaps Co. Ltd. - Product / Service
Qualicaps Co. Ltd. - Key offerings
SWOT

15.13 Roxlor LLC

Roxlor LLC - Overview
Roxlor LLC - Product / Service
Roxlor LLC - Key offerings
SWOT

15.14 Suheung Co. Ltd.

Suheung Co. Ltd. - Overview
Suheung Co. Ltd. - Product / Service
Suheung Co. Ltd. - Key offerings
SWOT

15.15 Sunil Healthcare Ltd.

Sunil Healthcare Ltd. - Overview
Sunil Healthcare Ltd. - Product / Service
Sunil Healthcare Ltd. - Key offerings
SWOT

15.16 Universe Capsules Biotech Pvt Ltd

Universe Capsules Biotech Pvt Ltd - Overview
Universe Capsules Biotech Pvt Ltd - Product / Service
Universe Capsules Biotech Pvt Ltd - Key offerings
SWOT

15.17 Wuhan Carma Technology Co. Ltd.

Wuhan Carma Technology Co. Ltd. - Overview
Wuhan Carma Technology Co. Ltd. - Product / Service
Wuhan Carma Technology Co. Ltd. - Key offerings
SWOT

15.18 Yiqing Pharmaceutical Capsule

Yiqing Pharmaceutical Capsule - Overview
Yiqing Pharmaceutical Capsule - Product / Service
Yiqing Pharmaceutical Capsule - Key offerings
SWOT

16. Appendix

16.1 Scope of the report

Market definition
Objectives
Notes and caveats

16.2 Inclusions and exclusions checklist

Inclusions checklist
Exclusions checklist

16.3 Currency conversion rates for US$

16.4 Research methodology

16.5 Data procurement

Information sources

16.6 Data validation

16.7 Validation techniques employed for market sizing

16.8 Data synthesis

16.9 360 degree market analysis

16.10 List of abbreviations

Research Methodology

Technavio presents a detailed picture of the market by way of study, synthesis, and summation of data from multiple sources. The analysts have presented the various facets of the market with a particular focus on identifying the key industry influencers. The data thus presented is comprehensive, reliable, and the result of extensive research, both primary and secondary.

INFORMATION SOURCES

Primary sources

  • Manufacturers and suppliers
  • Channel partners
  • Industry experts
  • Strategic decision makers

Secondary sources

  • Industry journals and periodicals
  • Government data
  • Financial reports of key industry players
  • Historical data
  • Press releases

DATA ANALYSIS

Data Synthesis

  • Collation of data
  • Estimation of key figures
  • Analysis of derived insights

Data Validation

  • Triangulation with data models
  • Reference against proprietary databases
  • Corroboration with industry experts

REPORT WRITING

Qualitative

  • Market drivers
  • Market challenges
  • Market trends
  • Five forces analysis

Quantitative

  • Market size and forecast
  • Market segmentation
  • Geographical insights
  • Competitive landscape

Interested in this report?

Get your sample now to see our research methodology and insights!

Download Now

Frequently Asked Questions

Empty Capsules market growth will increase by USD 1228.0 million during 2026-2030.

The Empty Capsules market is expected to grow at a CAGR of 7.2% during 2026-2030.

Empty Capsules market is segmented by Type (Gelatin capsules, Non-gelatin capsules) Product type (Immediate-release capsules, Sustained-release capsules, Delayed-release capsules) End-user (Pharmaceutical industry, Nutraceutical industry, Cosmetic industry, Research laboratories)

ACG Group, Bright Pharma Caps Inc., Comed Chemicals Ltd., Dah Feng Capsule Co. Ltd., Erawat Pharma Ltd., Farmacapsulas S.A., Fortcaps Healthcare Ltd., GS Capsule, Healthcaps India Ltd., Jinan Gaohua Medicinal Capsules, Lefancaps LTD., Lonza Group Ltd., Medicaps Ltd., Natural Capsules Ltd., Nectar Lifesciences Ltd., Nitta Gelatin Inc., Qualicaps Co. Ltd., Roxlor LLC, Suheung Co. Ltd., Sunil Healthcare Ltd., Universe Capsules Biotech Pvt Ltd, Wuhan Carma Technology Co. Ltd., Yiqing Pharmaceutical Capsule are a few of the key vendors in the Empty Capsules market.

North America will register the highest growth rate of 46% among the other regions. Therefore, the Empty Capsules market in North America is expected to garner significant business opportunities for the vendors during the forecast period.

US, Canada, Mexico, Germany, UK, France, Italy, Spain, The Netherlands, China, India, Japan, South Korea, Indonesia, Thailand, Brazil, Saudi Arabia, UAE, Turkey, South Africa, Argentina, Colombia, Israel

  • Growing demand for oral solid dosage formulations across pharmaceutical industry is the driving factor this market.

The Empty Capsules market vendors should focus on grabbing business opportunities from the Type segment as it accounted for the largest market share in the base year.
RIA - Research AI Assistant
Ask RIA
