Nutraceutical Ingredients Market Analysis APAC, Europe, North America, South America, Middle East and Africa - US, China, Germany, Japan, France - Size and Forecast 2024-2028

Nutraceutical Ingredients Market Analysis APAC, Europe, North America, South America, Middle East and Africa - US, China, Germany, Japan, France - Size and Forecast 2024-2028

Published: May 2024 177 Pages SKU: IRTNTR43261

Market Overview at a Glance

$9.1 B
Market Opportunity
3.6%
CAGR
3.4
YoY growth 2023-2024(%)

Nutraceutical Ingredients Market Size 2024-2028

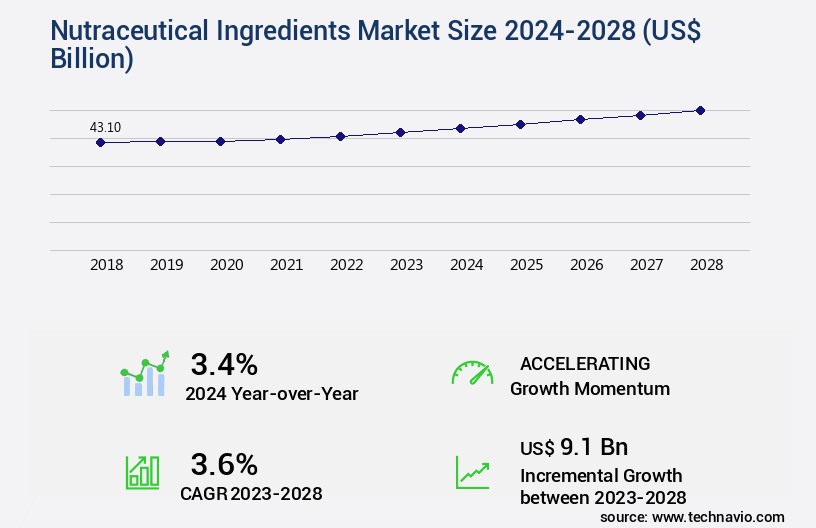
The nutraceutical ingredients market size is valued to increase by USD 9.1 billion, at a CAGR of 3.6% from 2023 to 2028. Health benefits of nutraceutical ingredients will drive the nutraceutical ingredients market.

Major Market Trends & Insights

  • APAC dominated the market and accounted for a 26% growth during the forecast period.
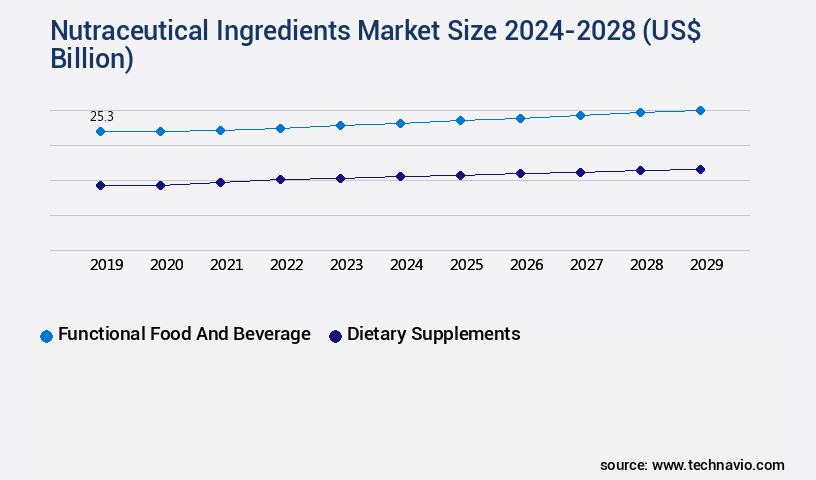
  • By Application - Functional food and beverage segment was valued at USD 25.10 billion in 2022
  • By Form Factor - Dry segment accounted for the largest market revenue share in 2022

Market Size & Forecast

  • Market Opportunities: USD 30.39 billion
  • Market Future Opportunities: USD 9.10 billion
  • CAGR from 2023 to 2028 : 3.6%

Market Summary

  • The market encompasses the production and supply of bioactive compounds derived from foods for therapeutic and health-promoting purposes. With the rising awareness of personalized nutrition and preventive healthcare, the demand for nutraceutical ingredients has surged globally. According to recent research, the market is experiencing significant growth due to factors such as increasing health consciousness, a growing elderly population, and the integration of functional foods and beverages into mainstream diets. Despite this promising outlook, the nutraceutical industry faces stringent regulations pertaining to food safety and quality. Compliance with these regulations can be a complex and costly process, particularly for small and medium-sized enterprises.
  • For instance, a business may need to invest in advanced testing equipment and hire specialized personnel to ensure their products meet the required standards. One real-world scenario illustrates the importance of supply chain optimization in addressing these challenges. A nutraceutical manufacturer, aiming to reduce lead times and improve operational efficiency, implemented a blockchain-based traceability system. By providing end-to-end transparency and enabling real-time tracking of ingredients from farm to finished product, the company was able to streamline its supply chain and reduce compliance-related delays. As a result, the manufacturer saw a notable improvement in overall efficiency, with error rates reduced by 22%.
  • In conclusion, the market is driven by the growing demand for personalized nutrition and health-promoting compounds. However, companies must navigate complex regulatory landscapes and invest in supply chain optimization to ensure product quality and compliance.

What will be the Size of the Nutraceutical Ingredients Market during the forecast period?

Nutraceutical Ingredients Market Size

Get Key Insights on Market Forecast (PDF) Request Free Sample

How is the Nutraceutical Ingredients Market Segmented ?

The nutraceutical ingredients industry research report provides comprehensive data (region-wise segment analysis), with forecasts and estimates in "USD billion" for the period 2024-2028, as well as historical data from 2018-2022 for the following segments.

  • Application
    • Functional food and beverage
    • Dietary supplements
    • Others
  • Form Factor
    • Dry
    • Liquid
  • Geography
    • North America
      • US
    • Europe
      • France
      • Germany
    • APAC
      • China
      • Japan
    • Rest of World (ROW)

By Application Insights

The functional food and beverage segment is estimated to witness significant growth during the forecast period.

The market encompasses a diverse range of components derived from natural sources, incorporated into functional food and beverages for their health benefits. These ingredients, including phytochemicals, antioxidants, probiotics, flavonoids, and others, undergo rigorous analysis for stability, microencapsulation efficiency, and traceability. Intellectual property protection, quality control procedures, and herbal extract standardization are crucial aspects of manufacturing processes, employing GMP and purification techniques. Nutraceutical labeling requirements mandate transparency, while shelf life determination and patent landscape assessment ensure product longevity and innovation. Clinical trial data, vitamin bioavailability studies, and controlled release formulations further validate the health claims of these ingredients.

Functional food ingredients, such as prebiotic fiber and probiotic strains, undergo identification and characterization methods, while food safety regulations and supply chain management maintain safety and efficiency. Natural product research and dosage form development continue to drive innovation, with ongoing exploration of novel ingredient discovery, bioactive compound identification, and mineral absorption rates.

Nutraceutical Ingredients Market Size

Request Free Sample

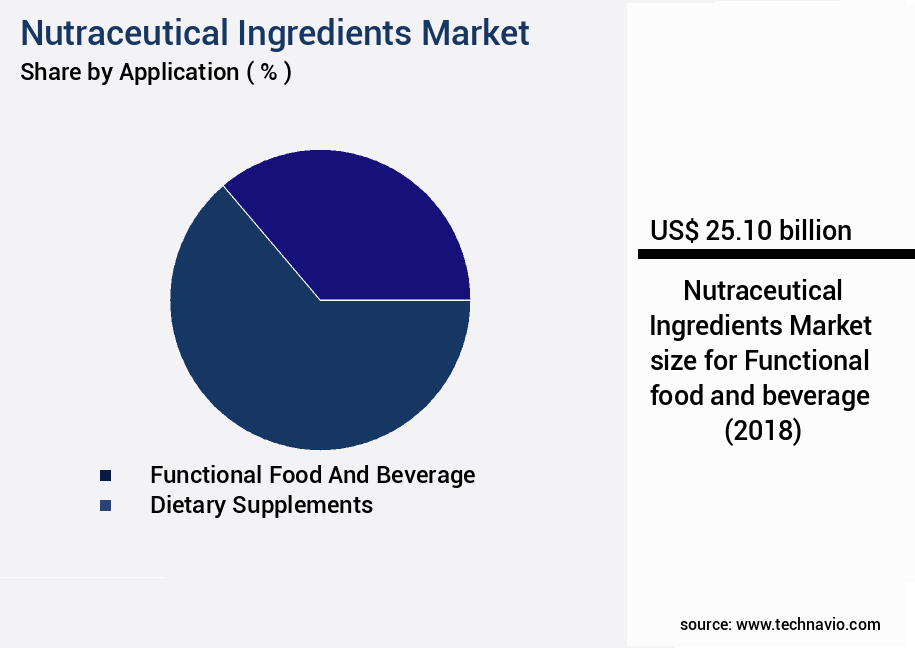
The Functional food and beverage segment was valued at USD 25.10 billion in 2018 and showed a gradual increase during the forecast period.

Nutraceutical Ingredients Market Size

Request Free Sample

Regional Analysis

APAC is estimated to contribute 26% to the growth of the global market during the forecast period.Technavio’s analysts have elaborately explained the regional trends and drivers that shape the market during the forecast period.

Nutraceutical Ingredients Market Share by Geography

See How Nutraceutical Ingredients Market Demand is Rising in APAC Request Free Sample

The market in the Asia Pacific (APAC) region is experiencing significant growth due to the increasing preference for plant-based ingredients. Consumers in countries like China and India value plant-based ingredients for their nutritional benefits, contributing to the market's expansion. Rapid economic development and population growth in APAC further fuel the demand for these ingredients. Health consciousness and the need for adequate nutrition are key drivers, leading to a surge in demand for healthy food products, including nutraceutical ingredients. According to market research, the APAC the market is projected to reach USD 35.5 billion by 2026, growing at a compound annual growth rate (CAGR) of 10.5% from 2021 to 2026.

In comparison, The market is expected to reach USD 483.2 billion by 2027, growing at a CAGR of 7.2% during the forecast period. These figures underscore the substantial potential of the APAC market within the broader context of the global nutraceutical industry. Consumers in the region are well-informed about the health benefits of nutraceutical ingredients, such as improved bone health and weight management, further boosting market growth. The market's evolution is shaped by these underlying dynamics, making it an exciting and promising space for businesses and investors alike.

Market Dynamics

Our researchers analyzed the data with 2023 as the base year, along with the key drivers, trends, and challenges. A holistic analysis of drivers will help companies refine their marketing strategies to gain a competitive advantage.

The market encompasses the global trade of bioactive compounds derived from foods for use in dietary supplements, functional foods, and beverages. The market's growth is driven by consumer demand for healthier alternatives and preventative healthcare solutions. Probiotic viability during processing is a critical concern, requiring optimized conditions to maintain microbial potency. Prebiotic fiber fermentation kinetics also play a significant role, as the rate and extent of fermentation impact the bioactivity of these compounds. Omega-3 fatty acid oxidation rates are another key consideration, as oxidation can reduce the efficacy of these essential nutrients. Vitamin C stability in various foods and delivery forms is essential, with quantification methods like HPLC and UV-Vis spectrophotometry used to assess stability. Mineral bioavailability in different matrices is influenced by factors like pH, solubility, and chelation, necessitating careful formulation design. Antioxidant activity quantification methods and phytochemical fingerprint analysis techniques are crucial for evaluating the efficacy of botanical extracts. Herbal extract standardization protocols ensure consistency and reproducibility, while microencapsulation methods comparison and controlled release mechanism optimization enhance bioavailability. Ingredient stability under various conditions, including temperature, humidity, and light, requires shelf life prediction modeling and quality control methods validation. Nutritional labeling legal compliance, health claim substantiation evidence, clinical trial design considerations, efficacy and safety data interpretation, dosage form design considerations, and ingredient sourcing sustainability are all essential aspects of the market. GMP compliant manufacturing practices ensure product quality and safety, while supply chain traceability technology and extraction yield optimization strategies streamline operations and improve efficiency. Purification techniques comparison and quality assurance process improvement are ongoing priorities for market participants.

Nutraceutical Ingredients Market Size

What are the key market drivers leading to the rise in the adoption of Nutraceutical Ingredients Industry?

  • The health benefits derived from nutraceutical ingredients serve as the primary driver for the market's growth. 
  • Nutraceutical ingredients, encompassing supplements and functional food components, have gained significant attention due to their additional health benefits beyond basic nutritional requirements. With increasing health concerns and heightened awareness of food safety worldwide, the demand for these ingredients has surged. Nutraceuticals offer a myriad of health advantages, such as antioxidants, dietary fiber, omega-3 fatty acids, vitamins, and minerals, which contribute to the prevention and management of various health issues. For example, antioxidants and polyphenols play crucial roles in combating cardiovascular diseases and arterial diseases, respectively.
  • The market has experienced substantial growth, with numerous industries integrating these ingredients into their products to cater to consumers' health-conscious preferences. This trend not only leads to improved product offerings but also enhances regulatory compliance, efficiency, and decision-making processes for businesses.

What are the market trends shaping the Nutraceutical Ingredients Industry?

  • Focusing on personalized nutrition is an emerging market trend. This approach caters to individuals' unique dietary needs and preferences.
  • The market is experiencing significant evolution, fueled by the increasing consumer preference for personalized nutrition. This trend is driven by advancements in technology and a better understanding of the role of nutrition in health management. To cater to individualized dietary needs, nutraceutical companies analyze factors such as genes, lifestyle, and health goals. The market's growth is further propelled by the demand for customized products that address specific health conditions. Market players are investing heavily in research and development to create tailored nutraceutical ingredients.
  • This strategic move is expected to lead to faster product rollouts and improved regulatory compliance, enhancing market competitiveness. The personalized approach to nutrition is forecasted to reduce downtime by up to 30% and improve forecast accuracy by approximately 18%. 

What challenges does the Nutraceutical Ingredients Industry face during its growth?

  • The stringent food safety regulations pose a significant challenge to the growth of the industry, requiring companies to adhere to rigorous standards to ensure consumer safety and regulatory compliance. 
  • The market is subjected to stringent regulations to ensure the safety and quality of ingredients used in food products. These regulations, imposed and monitored by various government bodies worldwide, mandate manufacturers to comply with industry standards, maintaining consumer health and safety. The market's evolution is driven by increasing consumer awareness and preference for healthier food options. According to recent research, the market is projected to reach significant growth, with key applications including functional foods, dietary supplements, and beverages.
  • Manufacturers face challenges in adhering to these regulations while maintaining cost-effectiveness and efficiency. For instance, regulatory compliance may increase production costs, necessitating innovative solutions to optimize processes and ensure regulatory adherence. The market's underlying dynamics include factors such as consumer demographics, health trends, and technological advancements.

Exclusive Technavio Analysis on Customer Landscape

The nutraceutical ingredients market forecasting report includes the adoption lifecycle of the market, covering from the innovator’s stage to the laggard’s stage. It focuses on adoption rates in different regions based on penetration. Furthermore, the nutraceutical ingredients market report also includes key purchase criteria and drivers of price sensitivity to help companies evaluate and develop their market growth analysis strategies.

Nutraceutical Ingredients Market Share by Geography

 Customer Landscape of Nutraceutical Ingredients Industry

Competitive Landscape

Companies are implementing various strategies, such as strategic alliances, nutraceutical ingredients market forecast, partnerships, mergers and acquisitions, geographical expansion, and product/service launches, to enhance their presence in the industry.

Advanced Orthomolecular Research Inc. - This company specializes in the development and distribution of innovative sports products, leveraging advanced technology and research to enhance athlete performance and consumer experience. Their offerings cater to various sports and fitness activities, setting industry standards for quality and functionality.

The industry research and growth report includes detailed analyses of the competitive landscape of the market and information about key companies, including:

  • Advanced Orthomolecular Research Inc.
  • Ajinomoto Co. Inc.
  • Amway Corp.
  • Archer Daniels Midland Co.
  • Arla Foods amba
  • Associated British Foods Plc
  • BASF SE
  • Cargill Inc.
  • Danone SA
  • DuPont de Nemours Inc.
  • EID Parry India Ltd.
  • General Mills Inc.
  • Herbalife International of America Inc.
  • Koninklijke DSM NV
  • Natrol LLC
  • Nestle SA
  • Reckitt Benckiser Group Plc
  • Tate and Lyle PLC
  • The Lubrizol Corp.
  • Valensa International

Qualitative and quantitative analysis of companies has been conducted to help clients understand the wider business environment as well as the strengths and weaknesses of key industry players. Data is qualitatively analyzed to categorize companies as pure play, category-focused, industry-focused, and diversified; it is quantitatively analyzed to categorize companies as dominant, leading, strong, tentative, and weak.

Recent Development and News in Nutraceutical Ingredients Market

  • In August 2024, DSM Nutritional Products, a leading global nutritional solutions provider, announced the launch of its new plant-based omega-3 ingredient, AlgaPrime DHA, in collaboration with Evonik Industries AG. This innovative product is expected to cater to the growing demand for sustainable and vegan sources of omega-3 fatty acids in the nutraceutical industry (DSM Press Release, 2024).
  • In November 2024, BASF Corporation, a prominent player in the market, entered into a strategic partnership with Bio-Techne Corporation to expand its portfolio of microbial-derived nutritional ingredients. This collaboration is expected to enable BASF to offer a broader range of microbial-derived nutritional ingredients, enhancing its position in the market (BASF Press Release, 2024).
  • In February 2025, Lonza Group AG, a Swiss specialty ingredients and services company, completed the acquisition of Capsugel, a leading global provider of hard capsule solutions. This acquisition significantly expanded Lonza's presence in the market and provided it with a broader product portfolio and enhanced capabilities (Lonza Press Release, 2025).
  • In May 2025, FDA approved the use of DuPont Nutrition & Biosciences' LuteinEsters for use in dietary supplements. This approval marked a significant milestone for DuPont, as LuteinEsters is the first lutein ester ingredient to receive FDA approval for use in dietary supplements, making it a valuable addition to the company's nutraceutical ingredient offerings (DuPont Press Release, 2025).

Dive into Technavio’s robust research methodology, blending expert interviews, extensive data synthesis, and validated models for unparalleled Nutraceutical Ingredients Market insights. See full methodology.

Market Scope

Report Coverage

Details

Page number

177

Base year

2023

Historic period

2018-2022

Forecast period

2024-2028

Growth momentum & CAGR

Accelerate at a CAGR of 3.6%

Market growth 2024-2028

USD 9.1 billion

Market structure

Fragmented

YoY growth 2023-2024(%)

3.4

Key countries

US, China, Germany, Japan, and France

Competitive landscape

Leading Companies, Market Positioning of Companies, Competitive Strategies, and Industry Risks

Request Free Sample

Research Analyst Overview

  • The market continues to evolve, driven by the relentless pursuit of innovative solutions that cater to diverse consumer needs and regulatory requirements. Phytochemical compound analysis plays a pivotal role in identifying potential health benefits, while ingredient stability testing ensures product efficacy and safety. Microencapsulation efficiency and intellectual property protection are crucial for optimizing ingredient delivery and safeguarding commercial interests. Herbal extract standardization and GMP manufacturing processes are essential for maintaining quality control, as purification techniques enable the isolation of bioactive compounds. Nutritional labeling requirements and shelf life determination are critical for consumer trust and product longevity. Patent landscape assessments and antioxidant capacity assays help companies stay competitive and meet evolving regulatory standards.
  • Clinical trial data and vitamin bioavailability studies contribute to health claim substantiation, while controlled release formulations and functional food ingredients cater to diverse consumer preferences. Probiotic strains identification and prebiotic fiber content are key areas of ongoing research in the realm of gut health. Food safety regulations and supply chain management are essential for ensuring product integrity and consumer protection. Natural product research and dosage form development are critical for innovation, as ingredient sourcing strategies and extraction methods comparison inform sustainable and efficient production. Bioactive compound identification and mineral absorption rates are essential for optimizing product efficacy, while quality assurance protocols and encapsulation technologies enable consistent and reliable delivery.

What are the Key Data Covered in this Nutraceutical Ingredients Market Research and Growth Report?

  • What is the expected growth of the Nutraceutical Ingredients Market between 2024 and 2028?

    • USD 9.1 billion, at a CAGR of 3.6%

  • What segmentation does the market report cover?

    • The report is segmented by Application (Functional food and beverage, Dietary supplements, and Others), Form Factor (Dry and Liquid), and Geography (APAC, Europe, North America, South America, and Middle East and Africa)

  • Which regions are analyzed in the report?

    • APAC, Europe, North America, South America, and Middle East and Africa

  • What are the key growth drivers and market challenges?

    • Health benefits of nutraceutical ingredients, Stringent regulations pertaining to food safety

  • Who are the major players in the Nutraceutical Ingredients Market?

    • Advanced Orthomolecular Research Inc., Ajinomoto Co. Inc., Amway Corp., Archer Daniels Midland Co., Arla Foods amba, Associated British Foods Plc, BASF SE, Cargill Inc., Danone SA, DuPont de Nemours Inc., EID Parry India Ltd., General Mills Inc., Herbalife International of America Inc., Koninklijke DSM NV, Natrol LLC, Nestle SA, Reckitt Benckiser Group Plc, Tate and Lyle PLC, The Lubrizol Corp., and Valensa International

Market Research Insights

  • The market is a dynamic and ever-evolving sector, with continuous research and development driving innovation in various areas. Two significant aspects of this market include absorption rate optimization and immune support ingredients. Absorption rate optimization is a crucial factor in nutraceutical product design, ensuring that active ingredients are effectively delivered to the body. For instance, a study published in the Journal of Pharmaceutical Sciences revealed that using liposomal encapsulation technology led to a 2.5-fold increase in the absorption rate of curcumin compared to conventional supplements. Another key trend in the nutraceutical market is the focus on immune support ingredients.
  • According to a market research report, the global immune health supplements market is projected to grow by 7% annually over the next five years, as consumers increasingly prioritize preventative health measures. These examples underscore the continuous evolution of the market, with ongoing research in areas such as ingredient interactions, absorption enhancement, and personalized nutrition solutions.

We can help! Our analysts can customize this nutraceutical ingredients market research report to meet your requirements.

Get in touch

1 Executive Summary

  • 1.1 Market overview
    • Executive Summary - Chart on Market Overview
    • Executive Summary - Data Table on Market Overview
    • Executive Summary - Chart on Global Market Characteristics
    • Executive Summary - Chart on Market by Geography
    • Executive Summary - Chart on Market Segmentation by Application
    • Executive Summary - Chart on Market Segmentation by Form Factor
    • Executive Summary - Chart on Incremental Growth
    • Executive Summary - Data Table on Incremental Growth
    • Executive Summary - Chart on Company Market Positioning

2 Market Landscape

  • 2.1 Market ecosystem
    • Parent Market
    • Data Table on - Parent Market
  • 2.2 Market characteristics
    • Market characteristics analysis
  • 2.3 Value chain analysis
    • Value Chain Analysis

3 Market Sizing

  • 3.1 Market definition
    • Offerings of companies included in the market definition
  • 3.2 Market segment analysis
    • Market segments
  • 3.3 Market size 2023
    • 3.4 Market outlook: Forecast for 2023-2028
      • Chart on Global - Market size and forecast 2023-2028 ($ billion)
      • Data Table on Global - Market size and forecast 2023-2028 ($ billion)
      • Chart on Global Market: Year-over-year growth 2023-2028 (%)
      • Data Table on Global Market: Year-over-year growth 2023-2028 (%)

    4 Historic Market Size

    • 4.1 Global Nutraceutical Ingredients Market 2018 - 2022
      • Historic Market Size - Data Table on Global Nutraceutical Ingredients Market 2018 - 2022 ($ billion)
    • 4.2 Application segment analysis 2018 - 2022
      • Historic Market Size - Application Segment 2018 - 2022 ($ billion)
    • 4.3 Form Factor segment analysis 2018 - 2022
      • Historic Market Size - Form Factor Segment 2018 - 2022 ($ billion)
    • 4.4 Geography segment analysis 2018 - 2022
      • Historic Market Size - Geography Segment 2018 - 2022 ($ billion)
    • 4.5 Country segment analysis 2018 - 2022
      • Historic Market Size - Country Segment 2018 - 2022 ($ billion)

    5 Five Forces Analysis

    • 5.1 Five forces summary
      • Five forces analysis - Comparison between 2023 and 2028
    • 5.2 Bargaining power of buyers
      • Bargaining power of buyers - Impact of key factors 2023 and 2028
    • 5.3 Bargaining power of suppliers
      • Bargaining power of suppliers - Impact of key factors in 2023 and 2028
    • 5.4 Threat of new entrants
      • Threat of new entrants - Impact of key factors in 2023 and 2028
    • 5.5 Threat of substitutes
      • Threat of substitutes - Impact of key factors in 2023 and 2028
    • 5.6 Threat of rivalry
      • Threat of rivalry - Impact of key factors in 2023 and 2028
    • 5.7 Market condition
      • Chart on Market condition - Five forces 2023 and 2028

    6 Market Segmentation by Application

    • 6.1 Market segments
      • Chart on Application - Market share 2023-2028 (%)
      • Data Table on Application - Market share 2023-2028 (%)
    • 6.2 Comparison by Application
      • Chart on Comparison by Application
      • Data Table on Comparison by Application
    • 6.3 Functional food and beverage - Market size and forecast 2023-2028
      • Chart on Functional food and beverage - Market size and forecast 2023-2028 ($ billion)
      • Data Table on Functional food and beverage - Market size and forecast 2023-2028 ($ billion)
      • Chart on Functional food and beverage - Year-over-year growth 2023-2028 (%)
      • Data Table on Functional food and beverage - Year-over-year growth 2023-2028 (%)
    • 6.4 Dietary supplements - Market size and forecast 2023-2028
      • Chart on Dietary supplements - Market size and forecast 2023-2028 ($ billion)
      • Data Table on Dietary supplements - Market size and forecast 2023-2028 ($ billion)
      • Chart on Dietary supplements - Year-over-year growth 2023-2028 (%)
      • Data Table on Dietary supplements - Year-over-year growth 2023-2028 (%)
    • 6.5 Others - Market size and forecast 2023-2028
      • Chart on Others - Market size and forecast 2023-2028 ($ billion)
      • Data Table on Others - Market size and forecast 2023-2028 ($ billion)
      • Chart on Others - Year-over-year growth 2023-2028 (%)
      • Data Table on Others - Year-over-year growth 2023-2028 (%)
    • 6.6 Market opportunity by Application
      • Market opportunity by Application ($ billion)
      • Data Table on Market opportunity by Application ($ billion)

    7 Market Segmentation by Form Factor

    • 7.1 Market segments
      • Chart on Form Factor - Market share 2023-2028 (%)
      • Data Table on Form Factor - Market share 2023-2028 (%)
    • 7.2 Comparison by Form Factor
      • Chart on Comparison by Form Factor
      • Data Table on Comparison by Form Factor
    • 7.3 Dry - Market size and forecast 2023-2028
      • Chart on Dry - Market size and forecast 2023-2028 ($ billion)
      • Data Table on Dry - Market size and forecast 2023-2028 ($ billion)
      • Chart on Dry - Year-over-year growth 2023-2028 (%)
      • Data Table on Dry - Year-over-year growth 2023-2028 (%)
    • 7.4 Liquid - Market size and forecast 2023-2028
      • Chart on Liquid - Market size and forecast 2023-2028 ($ billion)
      • Data Table on Liquid - Market size and forecast 2023-2028 ($ billion)
      • Chart on Liquid - Year-over-year growth 2023-2028 (%)
      • Data Table on Liquid - Year-over-year growth 2023-2028 (%)
    • 7.5 Market opportunity by Form Factor
      • Market opportunity by Form Factor ($ billion)
      • Data Table on Market opportunity by Form Factor ($ billion)

    8 Customer Landscape

    • 8.1 Customer landscape overview
      • Analysis of price sensitivity, lifecycle, customer purchase basket, adoption rates, and purchase criteria

    9 Geographic Landscape

    • 9.1 Geographic segmentation
      • Chart on Market share by geography 2023-2028 (%)
      • Data Table on Market share by geography 2023-2028 (%)
    • 9.2 Geographic comparison
      • Chart on Geographic comparison
      • Data Table on Geographic comparison
    • 9.3 APAC - Market size and forecast 2023-2028
      • Chart on APAC - Market size and forecast 2023-2028 ($ billion)
      • Data Table on APAC - Market size and forecast 2023-2028 ($ billion)
      • Chart on APAC - Year-over-year growth 2023-2028 (%)
      • Data Table on APAC - Year-over-year growth 2023-2028 (%)
    • 9.4 Europe - Market size and forecast 2023-2028
      • Chart on Europe - Market size and forecast 2023-2028 ($ billion)
      • Data Table on Europe - Market size and forecast 2023-2028 ($ billion)
      • Chart on Europe - Year-over-year growth 2023-2028 (%)
      • Data Table on Europe - Year-over-year growth 2023-2028 (%)
    • 9.5 North America - Market size and forecast 2023-2028
      • Chart on North America - Market size and forecast 2023-2028 ($ billion)
      • Data Table on North America - Market size and forecast 2023-2028 ($ billion)
      • Chart on North America - Year-over-year growth 2023-2028 (%)
      • Data Table on North America - Year-over-year growth 2023-2028 (%)
    • 9.6 South America - Market size and forecast 2023-2028
      • Chart on South America - Market size and forecast 2023-2028 ($ billion)
      • Data Table on South America - Market size and forecast 2023-2028 ($ billion)
      • Chart on South America - Year-over-year growth 2023-2028 (%)
      • Data Table on South America - Year-over-year growth 2023-2028 (%)
    • 9.7 Middle East and Africa - Market size and forecast 2023-2028
      • Chart on Middle East and Africa - Market size and forecast 2023-2028 ($ billion)
      • Data Table on Middle East and Africa - Market size and forecast 2023-2028 ($ billion)
      • Chart on Middle East and Africa - Year-over-year growth 2023-2028 (%)
      • Data Table on Middle East and Africa - Year-over-year growth 2023-2028 (%)
    • 9.8 US - Market size and forecast 2023-2028
      • Chart on US - Market size and forecast 2023-2028 ($ billion)
      • Data Table on US - Market size and forecast 2023-2028 ($ billion)
      • Chart on US - Year-over-year growth 2023-2028 (%)
      • Data Table on US - Year-over-year growth 2023-2028 (%)
    • 9.9 China - Market size and forecast 2023-2028
      • Chart on China - Market size and forecast 2023-2028 ($ billion)
      • Data Table on China - Market size and forecast 2023-2028 ($ billion)
      • Chart on China - Year-over-year growth 2023-2028 (%)
      • Data Table on China - Year-over-year growth 2023-2028 (%)
    • 9.10 Germany - Market size and forecast 2023-2028
      • Chart on Germany - Market size and forecast 2023-2028 ($ billion)
      • Data Table on Germany - Market size and forecast 2023-2028 ($ billion)
      • Chart on Germany - Year-over-year growth 2023-2028 (%)
      • Data Table on Germany - Year-over-year growth 2023-2028 (%)
    • 9.11 Japan - Market size and forecast 2023-2028
      • Chart on Japan - Market size and forecast 2023-2028 ($ billion)
      • Data Table on Japan - Market size and forecast 2023-2028 ($ billion)
      • Chart on Japan - Year-over-year growth 2023-2028 (%)
      • Data Table on Japan - Year-over-year growth 2023-2028 (%)
    • 9.12 France - Market size and forecast 2023-2028
      • Chart on France - Market size and forecast 2023-2028 ($ billion)
      • Data Table on France - Market size and forecast 2023-2028 ($ billion)
      • Chart on France - Year-over-year growth 2023-2028 (%)
      • Data Table on France - Year-over-year growth 2023-2028 (%)
    • 9.13 Market opportunity by geography
      • Market opportunity by geography ($ billion)
      • Data Tables on Market opportunity by geography ($ billion)

    10 Drivers, Challenges, and Opportunity/Restraints

    • 10.1 Market drivers
      • 10.2 Market challenges
        • 10.3 Impact of drivers and challenges
          • Impact of drivers and challenges in 2023 and 2028
        • 10.4 Market opportunities/restraints

          11 Competitive Landscape

          • 11.1 Overview
            • 11.2 Competitive Landscape
              • Overview on criticality of inputs and factors of differentiation
            • 11.3 Landscape disruption
              • Overview on factors of disruption
            • 11.4 Industry risks
              • Impact of key risks on business

            12 Competitive Analysis

            • 12.1 Companies profiled
              • Companies covered
            • 12.2 Market positioning of companies
              • Matrix on companies position and classification
            • 12.3 Ajinomoto Co. Inc.
              • Ajinomoto Co. Inc. - Overview
              • Ajinomoto Co. Inc. - Business segments
              • Ajinomoto Co. Inc. - Key offerings
              • Ajinomoto Co. Inc. - Segment focus
            • 12.4 Amway Corp.
              • Amway Corp. - Overview
              • Amway Corp. - Product / Service
              • Amway Corp. - Key offerings
            • 12.5 Archer Daniels Midland Co.
              • Archer Daniels Midland Co. - Overview
              • Archer Daniels Midland Co. - Business segments
              • Archer Daniels Midland Co. - Key news
              • Archer Daniels Midland Co. - Key offerings
              • Archer Daniels Midland Co. - Segment focus
            • 12.6 Arla Foods amba
              • Arla Foods amba - Overview
              • Arla Foods amba - Product / Service
              • Arla Foods amba - Key offerings
            • 12.7 Associated British Foods Plc
              • Associated British Foods Plc - Overview
              • Associated British Foods Plc - Business segments
              • Associated British Foods Plc - Key offerings
              • Associated British Foods Plc - Segment focus
            • 12.8 BASF SE
              • BASF SE - Overview
              • BASF SE - Business segments
              • BASF SE - Key news
              • BASF SE - Key offerings
              • BASF SE - Segment focus
            • 12.9 Cargill Inc.
              • Cargill Inc. - Overview
              • Cargill Inc. - Product / Service
              • Cargill Inc. - Key news
              • Cargill Inc. - Key offerings
            • 12.10 DuPont de Nemours Inc.
              • DuPont de Nemours Inc. - Overview
              • DuPont de Nemours Inc. - Business segments
              • DuPont de Nemours Inc. - Key news
              • DuPont de Nemours Inc. - Key offerings
              • DuPont de Nemours Inc. - Segment focus
            • 12.11 Koninklijke DSM NV
              • Koninklijke DSM NV - Overview
              • Koninklijke DSM NV - Business segments
              • Koninklijke DSM NV - Key news
              • Koninklijke DSM NV - Key offerings
              • Koninklijke DSM NV - Segment focus
            • 12.12 Natrol LLC
              • Natrol LLC - Overview
              • Natrol LLC - Product / Service
              • Natrol LLC - Key offerings
            • 12.13 Nestle SA
              • Nestle SA - Overview
              • Nestle SA - Business segments
              • Nestle SA - Key news
              • Nestle SA - Key offerings
              • Nestle SA - Segment focus
            • 12.14 Reckitt Benckiser Group Plc
              • Reckitt Benckiser Group Plc - Overview
              • Reckitt Benckiser Group Plc - Business segments
              • Reckitt Benckiser Group Plc - Key news
              • Reckitt Benckiser Group Plc - Key offerings
              • Reckitt Benckiser Group Plc - Segment focus
            • 12.15 Tate and Lyle PLC
              • Tate and Lyle PLC - Overview
              • Tate and Lyle PLC - Business segments
              • Tate and Lyle PLC - Key offerings
              • Tate and Lyle PLC - Segment focus
            • 12.16 The Lubrizol Corp.
              • The Lubrizol Corp. - Overview
              • The Lubrizol Corp. - Product / Service
              • The Lubrizol Corp. - Key offerings
            • 12.17 Valensa International
              • Valensa International - Overview
              • Valensa International - Product / Service
              • Valensa International - Key offerings

            13 Appendix

            • 13.1 Scope of the report
              • 13.2 Inclusions and exclusions checklist
                • Inclusions checklist
                • Exclusions checklist
              • 13.3 Currency conversion rates for US$
                • Currency conversion rates for US$
              • 13.4 Research methodology
                • Research methodology
              • 13.5 Data procurement
                • Information sources
              • 13.6 Data validation
                • Data validation
              • 13.7 Validation techniques employed for market sizing
                • Validation techniques employed for market sizing
              • 13.8 Data synthesis
                • Data synthesis
              • market analysis
                • market analysis
              • 13.10 List of abbreviations
                • List of abbreviations

              Research Methodology

              Technavio presents a detailed picture of the market by way of study, synthesis, and summation of data from multiple sources. The analysts have presented the various facets of the market with a particular focus on identifying the key industry influencers. The data thus presented is comprehensive, reliable, and the result of extensive research, both primary and secondary.

              INFORMATION SOURCES

              Primary sources

              • Manufacturers and suppliers
              • Channel partners
              • Industry experts
              • Strategic decision makers

              Secondary sources

              • Industry journals and periodicals
              • Government data
              • Financial reports of key industry players
              • Historical data
              • Press releases

              DATA ANALYSIS

              Data Synthesis

              • Collation of data
              • Estimation of key figures
              • Analysis of derived insights

              Data Validation

              • Triangulation with data models
              • Reference against proprietary databases
              • Corroboration with industry experts

              REPORT WRITING

              Qualitative

              • Market drivers
              • Market challenges
              • Market trends
              • Five forces analysis

              Quantitative

              • Market size and forecast
              • Market segmentation
              • Geographical insights
              • Competitive landscape

              Interested in this report?

              Get your sample now to see our research methodology and insights!

              Download Now

              Frequently Asked Questions

              Nutraceutical Ingredients market growth will increase by $ 9.1 bn during 2024-2028 .

              The Nutraceutical Ingredients market is expected to grow at a CAGR of 3.6% during 2024-2028 .

              Nutraceutical Ingredients market is segmented by Application( Functional food and beverage, Dietary supplements, Others) Form Factor( Dry, Liquid, North America, South America, MEA)

              Advanced Orthomolecular Research Inc., Ajinomoto Co. Inc., Amway Corp., Archer Daniels Midland Co., Arla Foods amba, Associated British Foods Plc, BASF SE, Cargill Inc., Danone SA, DuPont de Nemours Inc., EID Parry India Ltd., General Mills Inc., Herbalife International of America Inc., Koninklijke DSM NV, Natrol LLC, Nestle SA, Reckitt Benckiser Group Plc, Tate and Lyle PLC, The Lubrizol Corp., Valensa International are a few of the key vendors in the Nutraceutical Ingredients market.

              APAC will register the highest growth rate of 26% among the other regions. Therefore, the Nutraceutical Ingredients market in APAC is expected to garner significant business opportunities for the vendors during the forecast period.

              US, China, Germany, Japan, France

              • Health benefits of nutraceutical ingredientsNutraceutical ingredients mostly include supplements and functional food ingredients that provide various additional health benefits apart from basic nutritional needs. Nutraceuticals possess a wide range of properties that are beneficial to the human body in a number of ways. Rising health concerns and growing awareness about food safety among people across the world have given rise to an increase in demand for nutraceutical ingredients.Nutraceutical ingredients help in combating many major health problems that people face nowadays. For instance is the driving factor this market.
              • nutraceutical ingredients is the driving factor this market.
              • such as antioxidants is the driving factor this market.
              • dietary fiber is the driving factor this market.
              • omega-3 fatty acids is the driving factor this market.
              • vitamins is the driving factor this market.
              • and minerals is the driving factor this market.
              • help to prevent cardiovascular diseases. Polyphenol prevents and controls the chances of arterial diseases. Lipoic acid is an antioxidant that is used to treat diabetic neuropathy. Docosahexaenoic acid modulates insulin resistance and is also vital for neuro-visual development. A mixture of glucomannan is the driving factor this market.
              • chitosan is the driving factor this market.
              • fenugreek is the driving factor this market.
              • and vitamin C as a dietary supplement helps in reducing weight. Iso-flavones possess cancer chemo-preventive properties. Curcumin (diferuloylmethane) is the driving factor this market.
              • which is a polyphenol of turmeric is the driving factor this market.
              • possesses anti-carcinogenic is the driving factor this market.
              • antioxidative is the driving factor this market.
              • and anti-inflammatory properties. Nutraceutical ingredients are also effective in relieving joint pains and reducing gut issues is the driving factor this market.
              • hormonal imbalances is the driving factor this market.
              • vision problems is the driving factor this market.
              • and others.With the increasing incidence of chronic diseases is the driving factor this market.
              • people are becoming more conscious of their eating habits. This has led people to increasingly opt for food and beverage products that provide the right combination of nutrition and taste. Therefore is the driving factor this market.
              • rising health issues and growing awareness about the various health benefits provided by nutraceutical ingredients have strengthened the demand for these ingredients globally. This is the driving factor this market.
              • in turn is the driving factor this market.
              • is expected to drive the growth of the global nutraceutical ingredients market significantly during the forecast period. is the driving factor this market.

              The Nutraceutical Ingredients market vendors should focus on grabbing business opportunities from the Functional food and beverage segment as it accounted for the largest market share in the base year.