Emulsified Shortenings Market Analysis, Size, and Forecast 2025-2029: North America (US), Europe (France, Germany, and UK), Middle East and Africa (South Africa and UAE), APAC (China, India, and Japan), South America (Brazil), and Rest of World (ROW)

Emulsified Shortenings Market Analysis, Size, and Forecast 2025-2029:
North America (US), Europe (France, Germany, and UK), Middle East and Africa (South Africa and UAE), APAC (China, India, and Japan), South America (Brazil), and Rest of World (ROW)

Published: Dec 2024 205 Pages SKU: IRTNTR80428

Market Overview at a Glance

$894.4 Mn
Market Opportunity
5.9%
CAGR
4.6
YoY growth 2024-2025(%)

Emulsified Shortenings Market Size 2025-2029

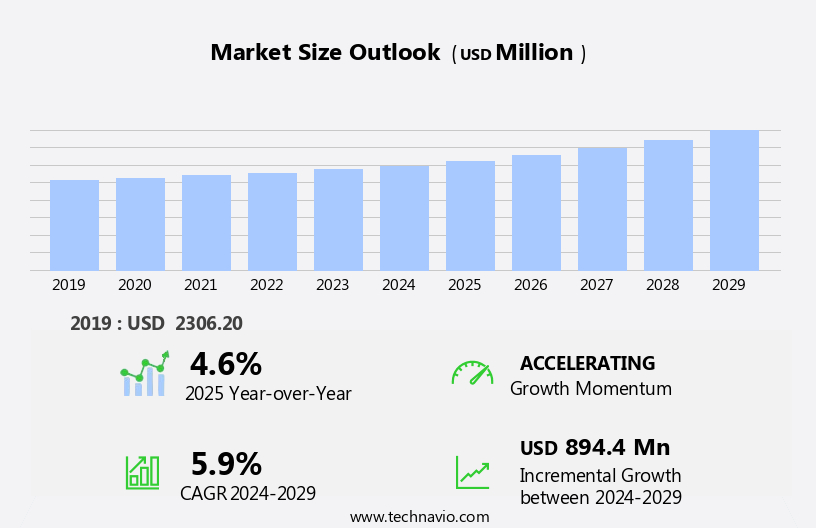
The emulsified shortenings market size is forecast to increase by USD 894.4 million, at a CAGR of 5.9% between 2024 and 2029.

  • The market is experiencing significant growth, driven by the expansion of the bakery industry and new product launches by companies. The bakery sector's continuous growth is fueled by increasing consumer preference for baked goods, particularly in developing regions. This trend presents a lucrative opportunity for emulsified shortenings manufacturers. However, rising raw material costs pose a substantial challenge for market participants. The price volatility of key raw materials, such as palm oil and soybean oil, can significantly impact the profitability of emulsified shortenings production.
  • Companies must carefully manage their supply chains and explore alternative raw material sources to mitigate these costs and maintain competitiveness. Effective supply chain management and raw material sourcing strategies will be crucial for market success.

What will be the Size of the Emulsified Shortenings Market during the forecast period?

Emulsified Shortenings Market Size

Explore in-depth regional segment analysis with market size data - historical 2019-2023 and forecasts 2025-2029 - in the full report.  
Request Free Sample

The market continues to evolve, driven by advancements in technology and consumer preferences. These complex food ingredients, which consist of a continuous oil phase stabilized by an emulsifier, offer various benefits such as improved texture, flavor stability, and viscosity control. The thermal analysis of Dispersive DSC (Differential Scanning Calorimetry) plays a crucial role in understanding the melting behavior of shortenings, impacting their performance in applications like baking and frying. The triglyceride structure, glyceride composition, and polymorphism analysis are essential factors influencing the melting point range and crystallization control. Emulsifier stability and fat bloom prevention are critical aspects of emulsion rheology, ensuring the desired texture and appearance in various food applications.

Shortening plasticity and hydrogenation degree are essential factors in determining the shortening's functionality and applicability in different sectors, such as confectionery and bakery. Coating applications, phase behavior, and texture modification are also significant considerations, as shortenings are used to enhance the sensory attributes and extend the shelf life of various food products. The interesterification process, oxidative stability, and frying stability are essential aspects of product formulation optimization. In the realm of food applications, shortenings are utilized in various sectors, including confectionery, bakery, and frying. Their unique properties, such as viscosity control, solid fat content, water activity, and fatty acid profile, enable them to contribute significantly to the desired texture, flavor, and performance in these applications.

As market dynamics continue to unfold, research and development efforts are focused on optimizing the production process, enhancing the functional properties, and expanding the applications of emulsified shortenings. The ongoing exploration of new emulsifiers, processing techniques, and formulation strategies will undoubtedly shape the future of this dynamic market.

How is this Emulsified Shortenings Industry segmented?

The emulsified shortenings industry research report provides comprehensive data (region-wise segment analysis), with forecasts and estimates in "USD million" for the period 2025-2029, as well as historical data from 2019-2023 for the following segments 

  • End-user
    • Food and beverage
    • Cosmetics and personal care
    • Pharmaceuticals
  • Source
    • Plant-based shortenings
    • Animal-based shortenings
  • Type
    • Vegetable-Based
    • Animal-Based
    • Blended
  • Form
    • Solid
    • Liquid
  • Geography
    • North America
      • US
    • Europe
      • France
      • Germany
      • UK
    • Middle East and Africa
      • South Africa
      • UAE
    • APAC
      • China
      • India
      • Japan
    • South America
      • Brazil
    • Rest of World (ROW)

By End-user Insights

The food and beverage segment is estimated to witness significant growth during the forecast period.

The market is witnessing significant growth in the food and beverage sector due to the essential role these shortenings play in enhancing texture, moisture retention, and shelf life in various products, including bakery items, snacks, confectionery, and prepared foods. The market is driven by the increasing demand for healthier and cleaner label alternatives, leading to a shift towards plant-based and trans-fat-free emulsified shortenings. This trend is fueled by consumers' growing awareness of health and wellness, as well as their preference for natural and minimally processed ingredients. Emulsifier stability, fat bloom prevention, and emulsion rheology are critical factors influencing the market's dynamics.

Triglyceride structure, solid fat content, water activity, and thermal analysis DSC are essential considerations in the production process. The interplay between these factors impacts the shortening's plasticity measurement, viscosity control, and phase behavior. Texture modification, coating application, and crystallization control are essential applications for emulsified shortenings. The fatty acid composition and hydrogenation degree significantly impact the shortening's melting point range, oxidative stability, and frying stability. Product formulation optimization, particle size distribution, and sensory attributes are crucial factors in ensuring baking performance and shelf life extension. Furthermore, the market is witnessing advancements in technologies such as polymorphism analysis, glyceride composition analysis, and process optimization techniques, enabling manufacturers to produce high-quality emulsified shortenings with improved functional properties and enhanced food applications.

Emulsified Shortenings Market Size

Request Free Sample

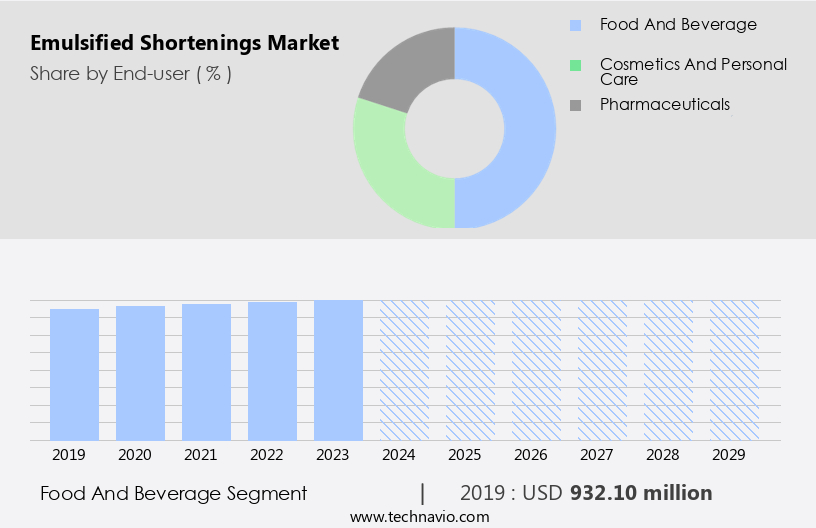
The Food and beverage segment was valued at USD 932.10 million in 2019 and showed a gradual increase during the forecast period.

Regional Analysis

Europe is estimated to contribute 39% to the growth of the global market during the forecast period.Technavio's analysts have elaborately explained the regional trends and drivers that shape the market during the forecast period.

Emulsified Shortenings Market Share by Geography

 Request Free Sample

The European the market is driven by the region's thriving food processing industry and increasing consumer demand for high-quality food products. Germany, as a major player in this market, reflects the industry's robustness with its significant role in the country's economy. In 2022, the production of processed food and beverages in Germany reached an impressive USD240 billion, marking a substantial growth of approximately 17% compared to the previous year. This expansion underscores the industry's adaptability to evolving consumer preferences and market conditions. Emulsified shortenings play a crucial role in the food processing sector due to their unique properties, including plasticity measurement, rheological properties, and viscosity control.

Triglyceride structure, emulsifier stability, and fat bloom prevention are essential factors in maintaining the desired texture and shelf life of various food applications. Emulsion rheology, solid fat content, water activity, and thermal analysis DSC are integral to understanding the behavior and performance of these shortenings. Flavor stability, emulsion viscosity, shortening plasticity, fatty acid composition, hydrogenation degree, and coating application are essential aspects of emulsified shortenings that influence the final product's sensory attributes and functionality. Phase behavior, texture modification, glyceride composition, polymorphism analysis, melting point range, and crystallization control are critical factors in optimizing the production process and ensuring consistent product quality.

Furthermore, oxidative stability, frying stability, fatty acid profile, baking performance, and shelf life extension are essential considerations in the food application of emulsified shortenings. The interesterification process, particle size distribution, and product formulation are essential aspects of the manufacturing process that impact the final product's properties and performance. In conclusion, the European the market is characterized by its dynamic nature, driven by the food processing industry's adaptability and the growing demand for high-quality food products.

Market Dynamics

Our researchers analyzed the data with 2024 as the base year, along with the key drivers, trends, and challenges. A holistic analysis of drivers will help companies refine their marketing strategies to gain a competitive advantage.

B2B shortening strategies utilize functional fat technologies for bakery applications. Emulsified shortenings prospects 2025 include shortenings for industrial baking and plant-based shortening blends, driving demand. Shortening logistics analytics optimize supply, while emulsified shortenings benchmarks highlight AAK. Sustainable shortening sourcing aligns with clean-label bakery trends. Shortening regulations 2025-2029 guide shortening demand in Europe 2025. Premium shortening products and emulsified shortenings forecasts enhance growth. Shortenings for confectionery and custom shortening formulations target niches. Emulsified shortenings hurdles and innovations address health concerns, with shortening supplier networks and shortening cost tactics boosting margins. Emulsified shortenings insights and functional fat breakthroughs accelerate momentum.

What are the key market drivers leading to the rise in the adoption of Emulsified Shortenings Industry?

  • The expansion of the bakery industry serves as the primary catalyst for market growth. 
  • The market is experiencing significant growth due to the expanding bakery industry. In 2023, the bakery sector surpassed USD600 billion in value, underscoring the substantial demand for baked goods worldwide. This trend is driven by increasing consumer preference for convenient and ready-to-eat food products, leading to a surge in the consumption of bakery items such as bread, cakes, pastries, and cookies. One key market in this regard is India, which was valued at approximately USD11 billion in 2022. This market is projected to nearly double, reaching around USD20 billion by 2028. Factors contributing to this growth include urbanization, rising disposable incomes, and changing dietary habits.
  • Emulsified shortenings play a crucial role in the production of these bakery items, providing desirable rheological properties, viscosity control, and emulsifier stability. These shortenings also help prevent fat bloom and ensure optimal emulsion rheology. The triglyceride structure of emulsified shortenings is carefully formulated to optimize solid fat content and water activity, ensuring the best possible baking results. As the bakery industry continues to expand, the demand for emulsified shortenings is expected to grow in tandem.

What are the market trends shaping the Emulsified Shortenings Industry?

  • The current market trend involves numerous new product launches from companies. It is an essential aspect of staying informed and competitive in this dynamic business environment.
  • The market is experiencing notable advancements as companies introduce innovative products to cater to the demands of food manufacturers and consumers. One recent example is Vantage Food's patent-pending SIMPLY KAKE emulsifier, launched on August 31, 2023. This product supports cleaner-label initiatives, a growing consumer preference for transparency and natural ingredients. The SIMPLY KAKE emulsifier improves baking performance for cakes and sweet goods, offering superior operational tolerance and enhancing cake volume. Consequently, it ensures a consistent and even crumb structure. Thermal analysis through DSC (Differential Scanning Calorimetry) plays a crucial role in understanding the phase behavior and texture modification of emulsified shortenings.
  • Flavor stability, emulsion viscosity, shortening plasticity, fatty acid composition, and hydrogenation degree are essential factors influencing the market dynamics. The ability of emulsified shortenings to function effectively in coating applications further expands their utility in the food industry. companies continue to focus on research and development to optimize these properties and cater to evolving consumer preferences.

What challenges does the Emulsified Shortenings Industry face during its growth?

  • The industry's growth is significantly impacted by the escalating costs of raw materials, which poses a major challenge. 
  • The market experiences challenges due to the volatile prices of key raw materials, primarily glycerides like palm and soybean oils. These price fluctuations significantly impact production costs, making it difficult for manufacturers to maintain consistent profit margins and pricing strategies. The unpredictability of raw material costs places financial pressure on producers, requiring them to adapt to market changes while remaining competitive. For instance, since mid-September 2024, the price of palm oil has risen by approximately 35%-40%, reaching around USD16 per metric ton. This volatility necessitates careful crystallization control, interesterification processes, and particle size distribution management in the formulation of emulsified shortenings.
  • Sensory attributes, such as melting point range and polymorphism analysis, are crucial to ensure the desired texture and mouthfeel in various applications, including confectionery use. Manufacturers must focus on optimizing their processes and formulations to mitigate the impact of raw material price fluctuations and deliver high-quality emulsified shortenings to their customers.

Exclusive Customer Landscape

The emulsified shortenings market forecasting report includes the adoption lifecycle of the market, covering from the innovator's stage to the laggard's stage. It focuses on adoption rates in different regions based on penetration. Furthermore, the emulsified shortenings market report also includes key purchase criteria and drivers of price sensitivity to help companies evaluate and develop their market growth analysis strategies.

Emulsified Shortenings Market Share by Geography

 Customer Landscape

Key Companies & Market Insights

Companies are implementing various strategies, such as strategic alliances, emulsified shortenings market forecast, partnerships, mergers and acquisitions, geographical expansion, and product/service launches, to enhance their presence in the industry.

AB Mauri UK Ltd. - This company specializes in the production and supply of emulsified shortenings, including fluid shortening and mauri shortening, which enhance food texture and shelf life for various industries. These innovative products contribute significantly to the food manufacturing sector by improving baking and frying processes.

The industry research and growth report includes detailed analyses of the competitive landscape of the market and information about key companies, including:

  • AB Mauri UK Ltd.
  • Archer Daniels Midland Co.
  • Bakels Philippines
  • BASF SE
  • Bunge Ltd.
  • Cargill Inc.
  • Giiava
  • Henan Chemsino Industry Co. Ltd.
  • IOI Oleo GmbH
  • Kerry Group Plc
  • MOI Foods U.S.A. Inc
  • Palsgaard AS
  • PT. PACIFIC MEDAN INDUSTRI
  • Tate and Lyle PLC
  • The J.M Smucker Co.
  • Wilmar International Ltd.

Qualitative and quantitative analysis of companies has been conducted to help clients understand the wider business environment as well as the strengths and weaknesses of key industry players. Data is qualitatively analyzed to categorize companies as pure play, category-focused, industry-focused, and diversified; it is quantitatively analyzed to categorize companies as dominant, leading, strong, tentative, and weak.

Recent Development and News in Emulsified Shortenings Market

  • In January 2024, AarhusKarlsen, a leading Danish producer of specialty fats and oils, announced the launch of its new emulsified shortening product line, "FlexiFry," designed for the foodservice sector. This innovation addresses the growing demand for healthier frying alternatives (AarhusKarlsen press release).
  • In March 2024, Cargill and Archer Daniels Midland (ADM) joined forces to expand their joint venture, WILD Flavors and Specialty Ingredients, focusing on the development and production of emulsified shortenings for the baking industry. This strategic collaboration aims to strengthen their market position and enhance their product offerings (Cargill press release).
  • In April 2025, the US Food and Drug Administration (FDA) approved the use of a new emulsifier, Sorbitan Tristearate, in emulsified shortenings. This approval opens up new possibilities for manufacturers to create healthier, more stable shortening products (FDA press release).
  • In May 2025, the Dutch multinational company, DSM, announced the acquisition of a leading Brazilian producer of emulsified shortenings, Solanova Alimentos. This strategic move expands DSM's global footprint and strengthens its position in the South American market (DSM press release).

Research Analyst Overview

  • The market experiences continuous evolution, driven by advancements in manufacturing processes and quality control measures. Lipid oxidation, a key challenge in shortening production, is mitigated through stability assessment and crystal network optimization. Yield optimization and application versatility are crucial for food ingredient suppliers, requiring a deep understanding of product consistency and processing technology. Emulsion technology plays a pivotal role in shortening functionality, with quality attributes heavily influenced by ingredient interaction and chemical composition. Thermal stability is essential for maintaining shortening's functional properties under various storage conditions. Manufacturers focus on cost optimization through process parameters fine-tuning and rheological measurements, ensuring product consistency and desirable texture analysis.
  • Physical properties, such as melting point and viscosity, are critical in shortening formulation design. Sensory evaluation and functional properties are integral to shortening's success in the food industry. Quality control measures, including strict adherence to process parameters, ensure the desired shortening characteristics are maintained. Ingredient selection and fat blend design are crucial aspects of shortening production, with each component's impact on shortening's thermal stability and sensory attributes carefully considered. Overall, the market demands a comprehensive understanding of ingredient interaction and processing technology to meet evolving consumer demands.

Dive into Technavio's robust research methodology, blending expert interviews, extensive data synthesis, and validated models for unparalleled Emulsified Shortenings Market insights. See full methodology.

Market Scope

Report Coverage

Details

Page number

205

Base year

2024

Historic period

2019-2023

Forecast period

2025-2029

Growth momentum & CAGR

Accelerate at a CAGR of 5.9%

Market growth 2025-2029

USD 894.4 million

Market structure

Fragmented

YoY growth 2024-2025(%)

4.6

Key countries

US, China, Germany, UK, and France

Competitive landscape

Leading Companies, Market Positioning of Companies, Competitive Strategies, and Industry Risks

Request Free Sample

What are the Key Data Covered in this Emulsified Shortenings Market Research and Growth Report?

  • CAGR of the Emulsified Shortenings industry during the forecast period
  • Detailed information on factors that will drive the growth and forecasting between 2025 and 2029
  • Precise estimation of the size of the market and its contribution of the industry in focus to the parent market
  • Accurate predictions about upcoming growth and trends and changes in consumer behaviour
  • Growth of the market across Europe, North America, APAC, South America, and Middle East and Africa
  • Thorough analysis of the market's competitive landscape and detailed information about companies
  • Comprehensive analysis of factors that will challenge the emulsified shortenings market growth of industry companies

We can help! Our analysts can customize this emulsified shortenings market research report to meet your requirements.

Get in touch

1 Executive Summary

  • 1.1 Market overview
    • Executive Summary - Chart on Market Overview
    • Executive Summary - Data Table on Market Overview
    • Executive Summary - Chart on Global Market Characteristics
    • Executive Summary - Chart on Market by Geography
    • Executive Summary - Chart on Market Segmentation by End-user
    • Executive Summary - Chart on Market Segmentation by Source
    • Executive Summary - Chart on Incremental Growth
    • Executive Summary - Data Table on Incremental Growth
    • Executive Summary - Chart on Company Market Positioning

2 Technavio Analysis

  • 2.1 Analysis of price sensitivity, lifecycle, customer purchase basket, adoption rates, and purchase criteria
    • Analysis of price sensitivity, lifecycle, customer purchase basket, adoption rates, and purchase criteria
  • 2.2 Criticality of inputs and Factors of differentiation
    • Overview on criticality of inputs and factors of differentiation
  • 2.3 Factors of disruption
    • Overview on factors of disruption
  • 2.4 Impact of drivers and challenges
    • Impact of drivers and challenges in 2024 and 2029

3 Market Landscape

  • 3.1 Market ecosystem
    • Parent Market
    • Data Table on - Parent Market
  • 3.2 Market characteristics
    • Market characteristics analysis
  • 3.3 Value chain analysis
    • Value chain analysis

4 Market Sizing

  • 4.1 Market definition
    • Offerings of companies included in the market definition
  • 4.2 Market segment analysis
    • Market segments
  • 4.3 Market size 2024
    • 4.4 Market outlook: Forecast for 2024-2029
      • Chart on Global - Market size and forecast 2024-2029 ($ million)
      • Data Table on Global - Market size and forecast 2024-2029 ($ million)
      • Chart on Global Market: Year-over-year growth 2024-2029 (%)
      • Data Table on Global Market: Year-over-year growth 2024-2029 (%)

    5 Historic Market Size

    • 5.1 Global Emulsified Shortenings Market 2019 - 2023
      • Historic Market Size - Data Table on Global Emulsified Shortenings Market 2019 - 2023 ($ million)
    • 5.2 End-user segment analysis 2019 - 2023
      • Historic Market Size - End-user Segment 2019 - 2023 ($ million)
    • 5.3 Source segment analysis 2019 - 2023
      • Historic Market Size - Source Segment 2019 - 2023 ($ million)
    • 5.4 Geography segment analysis 2019 - 2023
      • Historic Market Size - Geography Segment 2019 - 2023 ($ million)
    • 5.5 Country segment analysis 2019 - 2023
      • Historic Market Size - Country Segment 2019 - 2023 ($ million)

    6 Qualitative Analysis

    • 6.1 Impact of AI on the Global Emulsified Shortenings Market

      7 Five Forces Analysis

      • 7.1 Five forces summary
        • Five forces analysis - Comparison between 2024 and 2029
      • 7.2 Bargaining power of buyers
        • Bargaining power of buyers - Impact of key factors 2024 and 2029
      • 7.3 Bargaining power of suppliers
        • Bargaining power of suppliers - Impact of key factors in 2024 and 2029
      • 7.4 Threat of new entrants
        • Threat of new entrants - Impact of key factors in 2024 and 2029
      • 7.5 Threat of substitutes
        • Threat of substitutes - Impact of key factors in 2024 and 2029
      • 7.6 Threat of rivalry
        • Threat of rivalry - Impact of key factors in 2024 and 2029
      • 7.7 Market condition
        • Chart on Market condition - Five forces 2024 and 2029

      8 Market Segmentation by End-user

      • 8.1 Market segments
        • Chart on End-user - Market share (2024-2029) (%)
        • Data Table on End-user - Market share (2024-2029) (%)
      • 8.2 Comparison by End-user
        • Chart on Comparison by End-user
        • Data Table on Comparison by End-user
      • 8.3 Food and beverage - Market size and forecast (2024-2029)
        • Chart on Food and beverage - Market size and forecast (2024-2029) ($ million)
        • Data Table on Food and beverage - Market size and forecast (2024-2029) ($ million)
        • Chart on Food and beverage - Year-over-year growth (2024-2029) (%)
        • Data Table on Food and beverage - Year-over-year growth (2024-2029) (%)
      • 8.4 Cosmetics and personal care - Market size and forecast (2024-2029)
        • Chart on Cosmetics and personal care - Market size and forecast (2024-2029) ($ million)
        • Data Table on Cosmetics and personal care - Market size and forecast (2024-2029) ($ million)
        • Chart on Cosmetics and personal care - Year-over-year growth (2024-2029) (%)
        • Data Table on Cosmetics and personal care - Year-over-year growth (2024-2029) (%)
      • 8.5 Pharmaceuticals - Market size and forecast (2024-2029)
        • Chart on Pharmaceuticals - Market size and forecast (2024-2029) ($ million)
        • Data Table on Pharmaceuticals - Market size and forecast (2024-2029) ($ million)
        • Chart on Pharmaceuticals - Year-over-year growth (2024-2029) (%)
        • Data Table on Pharmaceuticals - Year-over-year growth (2024-2029) (%)
      • 8.6 Market opportunity by End-user
        • Market opportunity by End-user ($ million)
        • Data Table on Market opportunity by End-user ($ million)

      9 Market Segmentation by Source

      • 9.1 Market segments
        • Chart on Source - Market share (2024-2029) (%)
        • Data Table on Source - Market share (2024-2029) (%)
      • 9.2 Comparison by Source
        • Chart on Comparison by Source
        • Data Table on Comparison by Source
      • 9.3 Plant-based shortenings - Market size and forecast (2024-2029)
        • Chart on Plant-based shortenings - Market size and forecast (2024-2029) ($ million)
        • Data Table on Plant-based shortenings - Market size and forecast (2024-2029) ($ million)
        • Chart on Plant-based shortenings - Year-over-year growth (2024-2029) (%)
        • Data Table on Plant-based shortenings - Year-over-year growth (2024-2029) (%)
      • 9.4 Animal-based shortenings - Market size and forecast (2024-2029)
        • Chart on Animal-based shortenings - Market size and forecast (2024-2029) ($ million)
        • Data Table on Animal-based shortenings - Market size and forecast (2024-2029) ($ million)
        • Chart on Animal-based shortenings - Year-over-year growth (2024-2029) (%)
        • Data Table on Animal-based shortenings - Year-over-year growth (2024-2029) (%)
      • 9.5 Market opportunity by Source
        • Market opportunity by Source ($ million)
        • Data Table on Market opportunity by Source ($ million)

      10 Market Segmentation by Type

      • 10.1 Market segments
        • Chart on Type - Market share (2024-2029) (%)
        • Data Table on Type - Market share (2024-2029) (%)
      • 10.2 Comparison by Type
        • Chart on Comparison by Type
        • Data Table on Comparison by Type
      • 10.3 Vegetable-Based - Market size and forecast (2024-2029)
        • Chart on Vegetable-Based - Market size and forecast (2024-2029) ($ million)
        • Data Table on Vegetable-Based - Market size and forecast (2024-2029) ($ million)
        • Chart on Vegetable-Based - Year-over-year growth (2024-2029) (%)
        • Data Table on Vegetable-Based - Year-over-year growth (2024-2029) (%)
      • 10.4 Animal-Based - Market size and forecast (2024-2029)
        • Chart on Animal-Based - Market size and forecast (2024-2029) ($ million)
        • Data Table on Animal-Based - Market size and forecast (2024-2029) ($ million)
        • Chart on Animal-Based - Year-over-year growth (2024-2029) (%)
        • Data Table on Animal-Based - Year-over-year growth (2024-2029) (%)
      • 10.5 Blended - Market size and forecast (2024-2029)
        • Chart on Blended - Market size and forecast (2024-2029) ($ million)
        • Data Table on Blended - Market size and forecast (2024-2029) ($ million)
        • Chart on Blended - Year-over-year growth (2024-2029) (%)
        • Data Table on Blended - Year-over-year growth (2024-2029) (%)
      • 10.6 Market opportunity by Type
        • Market opportunity by Type ($ million)
        • Data Table on Market opportunity by Type ($ million)

      11 Market Segmentation by Form

      • 11.1 Market segments
        • Chart on Form - Market share (2024-2029) (%)
        • Data Table on Form - Market share (2024-2029) (%)
      • 11.2 Comparison by Form
        • Chart on Comparison by Form
        • Data Table on Comparison by Form
      • 11.3 Solid - Market size and forecast (2024-2029)
        • Chart on Solid - Market size and forecast (2024-2029) ($ million)
        • Data Table on Solid - Market size and forecast (2024-2029) ($ million)
        • Chart on Solid - Year-over-year growth (2024-2029) (%)
        • Data Table on Solid - Year-over-year growth (2024-2029) (%)
      • 11.4 Liquid - Market size and forecast (2024-2029)
        • Chart on Liquid - Market size and forecast (2024-2029) ($ million)
        • Data Table on Liquid - Market size and forecast (2024-2029) ($ million)
        • Chart on Liquid - Year-over-year growth (2024-2029) (%)
        • Data Table on Liquid - Year-over-year growth (2024-2029) (%)
      • 11.5 Market opportunity by Form
        • Market opportunity by Form ($ million)
        • Data Table on Market opportunity by Form ($ million)

      12 Customer Landscape

      • 12.1 Customer landscape overview
        • Analysis of price sensitivity, lifecycle, customer purchase basket, adoption rates, and purchase criteria

      13 Geographic Landscape

      • 13.1 Geographic segmentation
        • Chart on Market share by geography 2024-2029 (%)
        • Data Table on Market share by geography 2024-2029 (%)
      • 13.2 Geographic comparison
        • Chart on Geographic comparison
        • Data Table on Geographic comparison
      • 13.3 Europe - Market size and forecast 2024-2029
        • Chart on Europe - Market size and forecast 2024-2029 ($ million)
        • Data Table on Europe - Market size and forecast 2024-2029 ($ million)
        • Chart on Europe - Year-over-year growth 2024-2029 (%)
        • Data Table on Europe - Year-over-year growth 2024-2029 (%)
      • 13.4 North America - Market size and forecast 2024-2029
        • Chart on North America - Market size and forecast 2024-2029 ($ million)
        • Data Table on North America - Market size and forecast 2024-2029 ($ million)
        • Chart on North America - Year-over-year growth 2024-2029 (%)
        • Data Table on North America - Year-over-year growth 2024-2029 (%)
      • 13.5 APAC - Market size and forecast 2024-2029
        • Chart on APAC - Market size and forecast 2024-2029 ($ million)
        • Data Table on APAC - Market size and forecast 2024-2029 ($ million)
        • Chart on APAC - Year-over-year growth 2024-2029 (%)
        • Data Table on APAC - Year-over-year growth 2024-2029 (%)
      • 13.6 South America - Market size and forecast 2024-2029
        • Chart on South America - Market size and forecast 2024-2029 ($ million)
        • Data Table on South America - Market size and forecast 2024-2029 ($ million)
        • Chart on South America - Year-over-year growth 2024-2029 (%)
        • Data Table on South America - Year-over-year growth 2024-2029 (%)
      • 13.7 Middle East and Africa - Market size and forecast 2024-2029
        • Chart on Middle East and Africa - Market size and forecast 2024-2029 ($ million)
        • Data Table on Middle East and Africa - Market size and forecast 2024-2029 ($ million)
        • Chart on Middle East and Africa - Year-over-year growth 2024-2029 (%)
        • Data Table on Middle East and Africa - Year-over-year growth 2024-2029 (%)
      • 13.8 US - Market size and forecast 2024-2029
        • Chart on US - Market size and forecast 2024-2029 ($ million)
        • Data Table on US - Market size and forecast 2024-2029 ($ million)
        • Chart on US - Year-over-year growth 2024-2029 (%)
        • Data Table on US - Year-over-year growth 2024-2029 (%)
      • 13.9 China - Market size and forecast 2024-2029
        • Chart on China - Market size and forecast 2024-2029 ($ million)
        • Data Table on China - Market size and forecast 2024-2029 ($ million)
        • Chart on China - Year-over-year growth 2024-2029 (%)
        • Data Table on China - Year-over-year growth 2024-2029 (%)
      • 13.10 Germany - Market size and forecast 2024-2029
        • Chart on Germany - Market size and forecast 2024-2029 ($ million)
        • Data Table on Germany - Market size and forecast 2024-2029 ($ million)
        • Chart on Germany - Year-over-year growth 2024-2029 (%)
        • Data Table on Germany - Year-over-year growth 2024-2029 (%)
      • 13.11 UK - Market size and forecast 2024-2029
        • Chart on UK - Market size and forecast 2024-2029 ($ million)
        • Data Table on UK - Market size and forecast 2024-2029 ($ million)
        • Chart on UK - Year-over-year growth 2024-2029 (%)
        • Data Table on UK - Year-over-year growth 2024-2029 (%)
      • 13.12 France - Market size and forecast 2024-2029
        • Chart on France - Market size and forecast 2024-2029 ($ million)
        • Data Table on France - Market size and forecast 2024-2029 ($ million)
        • Chart on France - Year-over-year growth 2024-2029 (%)
        • Data Table on France - Year-over-year growth 2024-2029 (%)
      • 13.13 India - Market size and forecast 2024-2029
        • Chart on India - Market size and forecast 2024-2029 ($ million)
        • Data Table on India - Market size and forecast 2024-2029 ($ million)
        • Chart on India - Year-over-year growth 2024-2029 (%)
        • Data Table on India - Year-over-year growth 2024-2029 (%)
      • 13.14 Japan - Market size and forecast 2024-2029
        • Chart on Japan - Market size and forecast 2024-2029 ($ million)
        • Data Table on Japan - Market size and forecast 2024-2029 ($ million)
        • Chart on Japan - Year-over-year growth 2024-2029 (%)
        • Data Table on Japan - Year-over-year growth 2024-2029 (%)
      • 13.15 Canada - Market size and forecast 2024-2029
        • Chart on Canada - Market size and forecast 2024-2029 ($ million)
        • Data Table on Canada - Market size and forecast 2024-2029 ($ million)
        • Chart on Canada - Year-over-year growth 2024-2029 (%)
        • Data Table on Canada - Year-over-year growth 2024-2029 (%)
      • 13.16 Indonesia - Market size and forecast 2024-2029
        • Chart on Indonesia - Market size and forecast 2024-2029 ($ million)
        • Data Table on Indonesia - Market size and forecast 2024-2029 ($ million)
        • Chart on Indonesia - Year-over-year growth 2024-2029 (%)
        • Data Table on Indonesia - Year-over-year growth 2024-2029 (%)
      • 13.17 Italy - Market size and forecast 2024-2029
        • Chart on Italy - Market size and forecast 2024-2029 ($ million)
        • Data Table on Italy - Market size and forecast 2024-2029 ($ million)
        • Chart on Italy - Year-over-year growth 2024-2029 (%)
        • Data Table on Italy - Year-over-year growth 2024-2029 (%)
      • 13.18 Market opportunity by geography
        • Market opportunity by geography ($ million)
        • Data Tables on Market opportunity by geography ($ million)
      • 13.19 Brazil - Market size and forecast (2024-2029)
        • Chart on Brazil - Market size and forecast (2024-2029) ($ million)
        • Data Table on Brazil - Market size and forecast (2024-2029) ($ million)
        • Chart on Brazil - Year-over-year growth (2024-2029) (%)
        • Data Table on Brazil - Year-over-year growth (2024-2029) (%)
      • 13.20 South Africa - Market size and forecast (2024-2029)
        • Chart on South Africa - Market size and forecast (2024-2029) ($ million)
        • Data Table on South Africa - Market size and forecast (2024-2029) ($ million)
        • Chart on South Africa - Year-over-year growth (2024-2029) (%)
        • Data Table on South Africa - Year-over-year growth (2024-2029) (%)
      • 13.21 UAE - Market size and forecast (2024-2029)
        • Chart on UAE - Market size and forecast (2024-2029) ($ million)
        • Data Table on UAE - Market size and forecast (2024-2029) ($ million)
        • Chart on UAE - Year-over-year growth (2024-2029) (%)
        • Data Table on UAE - Year-over-year growth (2024-2029) (%)
      • 13.22 Rest of World (ROW) - Market size and forecast (2024-2029)
        • Chart on Rest of World (ROW) - Market size and forecast (2024-2029) ($ million)
        • Data Table on Rest of World (ROW) - Market size and forecast (2024-2029) ($ million)
        • Chart on Rest of World (ROW) - Year-over-year growth (2024-2029) (%)
        • Data Table on Rest of World (ROW) - Year-over-year growth (2024-2029) (%)

      14 Drivers, Challenges, and Opportunity/Restraints

      • 14.1 Market drivers
        • 14.2 Market challenges
          • 14.3 Impact of drivers and challenges
            • Impact of drivers and challenges in 2024 and 2029
          • 14.4 Market opportunities/restraints

            15 Competitive Landscape

            • 15.1 Overview
              • 15.2 Competitive Landscape
                • Overview on criticality of inputs and factors of differentiation
              • 15.3 Landscape disruption
                • Overview on factors of disruption
              • 15.4 Industry risks
                • Impact of key risks on business

              16 Competitive Analysis

              • 16.1 Companies profiled
                • Companies covered
              • 16.2 Company ranking index
                • Company ranking index
              • 16.3 Market positioning of companies
                • Matrix on companies position and classification
              • 16.4 AB Mauri UK Ltd.
                • AB Mauri UK Ltd. - Overview
                • AB Mauri UK Ltd. - Product / Service
                • AB Mauri UK Ltd. - Key offerings
                • SWOT
              • 16.5 Archer Daniels Midland Co.
                • Archer Daniels Midland Co. - Overview
                • Archer Daniels Midland Co. - Business segments
                • Archer Daniels Midland Co. - Key news
                • Archer Daniels Midland Co. - Key offerings
                • Archer Daniels Midland Co. - Segment focus
                • SWOT
              • 16.6 Bakels Philippines
                • Bakels Philippines - Overview
                • Bakels Philippines - Key offerings
                • SWOT
              • 16.7 BASF SE
                • BASF SE - Overview
                • BASF SE - Business segments
                • BASF SE - Key news
                • BASF SE - Key offerings
                • BASF SE - Segment focus
                • SWOT
              • 16.8 Bunge Ltd.
                • Bunge Ltd. - Overview
                • Bunge Ltd. - Business segments
                • Bunge Ltd. - Key news
                • Bunge Ltd. - Key offerings
                • Bunge Ltd. - Segment focus
                • SWOT
              • 16.9 Cargill Inc.
                • Cargill Inc. - Overview
                • Cargill Inc. - Product / Service
                • Cargill Inc. - Key offerings
                • SWOT
              • 16.10 Giiava
                • Giiava - Overview
                • Giiava - Product / Service
                • Giiava - Key offerings
                • SWOT
              • 16.11 Henan Chemsino Industry Co. Ltd.
                • Henan Chemsino Industry Co. Ltd. - Overview
                • Henan Chemsino Industry Co. Ltd. - Product / Service
                • Henan Chemsino Industry Co. Ltd. - Key offerings
                • SWOT
              • 16.12 IOI Oleo GmbH
                • IOI Oleo GmbH - Overview
                • IOI Oleo GmbH - Product / Service
                • IOI Oleo GmbH - Key offerings
                • SWOT
              • 16.13 Kerry Group Plc
                • Kerry Group Plc - Overview
                • Kerry Group Plc - Business segments
                • Kerry Group Plc - Key news
                • Kerry Group Plc - Key offerings
                • Kerry Group Plc - Segment focus
                • SWOT
              • 16.14 Palsgaard AS
                • Palsgaard AS - Overview
                • Palsgaard AS - Product / Service
                • Palsgaard AS - Key offerings
                • SWOT
              • 16.15 PT. PACIFIC MEDAN INDUSTRI
                • PT. PACIFIC MEDAN INDUSTRI - Overview
                • PT. PACIFIC MEDAN INDUSTRI - Product / Service
                • PT. PACIFIC MEDAN INDUSTRI - Key offerings
                • SWOT
              • 16.16 Tate and Lyle PLC
                • Tate and Lyle PLC - Overview
                • Tate and Lyle PLC - Business segments
                • Tate and Lyle PLC - Key news
                • Tate and Lyle PLC - Key offerings
                • Tate and Lyle PLC - Segment focus
                • SWOT
              • 16.17 The J.M Smucker Co.
                • The J.M Smucker Co. - Overview
                • The J.M Smucker Co. - Business segments
                • The J.M Smucker Co. - Key news
                • The J.M Smucker Co. - Key offerings
                • The J.M Smucker Co. - Segment focus
                • SWOT
              • 16.18 Wilmar International Ltd.
                • Wilmar International Ltd. - Overview
                • Wilmar International Ltd. - Business segments
                • Wilmar International Ltd. - Key offerings
                • Wilmar International Ltd. - Segment focus
                • SWOT

              17 Appendix

              • 17.1 Scope of the report
                • 17.2 Inclusions and exclusions checklist
                  • Inclusions checklist
                  • Exclusions checklist
                • 17.3 Currency conversion rates for US$
                  • Currency conversion rates for US$
                • 17.4 Research methodology
                  • Research methodology
                • 17.5 Data procurement
                  • Information sources
                • 17.6 Data validation
                  • Data validation
                • 17.7 Validation techniques employed for market sizing
                  • Validation techniques employed for market sizing
                • 17.8 Data synthesis
                  • Data synthesis
                • 17.9 360 degree market analysis
                  • 360 degree market analysis
                • 17.10 List of abbreviations
                  • List of abbreviations

                Research Methodology

                Technavio presents a detailed picture of the market by way of study, synthesis, and summation of data from multiple sources. The analysts have presented the various facets of the market with a particular focus on identifying the key industry influencers. The data thus presented is comprehensive, reliable, and the result of extensive research, both primary and secondary.

                INFORMATION SOURCES

                Primary sources

                • Manufacturers and suppliers
                • Channel partners
                • Industry experts
                • Strategic decision makers

                Secondary sources

                • Industry journals and periodicals
                • Government data
                • Financial reports of key industry players
                • Historical data
                • Press releases

                DATA ANALYSIS

                Data Synthesis

                • Collation of data
                • Estimation of key figures
                • Analysis of derived insights

                Data Validation

                • Triangulation with data models
                • Reference against proprietary databases
                • Corroboration with industry experts

                REPORT WRITING

                Qualitative

                • Market drivers
                • Market challenges
                • Market trends
                • Five forces analysis

                Quantitative

                • Market size and forecast
                • Market segmentation
                • Geographical insights
                • Competitive landscape

                Interested in this report?

                Get your sample now to see our research methodology and insights!

                Download Now

                Frequently Asked Questions

                Emulsified Shortenings market growth will increase by $ 894.4 mn during 2025-2029.

                The Emulsified Shortenings market is expected to grow at a CAGR of 5.9% during 2025-2029.

                Emulsified Shortenings market is segmented by End-user( Food and beverage, Cosmetics and personal care, Pharmaceuticals) Source( Plant-based shortenings, Animal-based shortenings)

                AB Mauri UK Ltd., Archer Daniels Midland Co., Bakels Philippines, BASF SE, Bunge Ltd., Cargill Inc., Giiava, Henan Chemsino Industry Co. Ltd., IOI Oleo GmbH, Kerry Group Plc, MOI Foods U.S.A. Inc, Palsgaard AS, PT. PACIFIC MEDAN INDUSTRI, Tate and Lyle PLC, The J.M Smucker Co., Wilmar International Ltd. are a few of the key vendors in the Emulsified Shortenings market.

                Europe will register the highest growth rate of 39% among the other regions. Therefore, the Emulsified Shortenings market in Europe is expected to garner significant business opportunities for the vendors during the forecast period.

                US, China, Germany, UK, France, Brazil, South Africa, UAE, India, Japan

                • Expansion of bakery industryThe expansion of the bakery industry is a significant driver for the global emulsified shortenings market. In 2023 is the driving factor this market.
                • the global bakery products sector was valued at over $600 billion is the driving factor this market.
                • highlighting the substantial demand for baked goods worldwide. This growth is fueled by increasing consumer preference for convenient and ready-to-eat food products is the driving factor this market.
                • which has led to a surge in the consumption of bakery items such as bread is the driving factor this market.
                • cakes is the driving factor this market.
                • pastries is the driving factor this market.
                • and cookies.In India is the driving factor this market.
                • the bakery industry reached approximately $11 billion in 2022. This market is projected to nearly double is the driving factor this market.
                • reaching around $20 billion by 2028. The rapid expansion of the bakery industry in India is driven by several factors is the driving factor this market.
                • including urbanization is the driving factor this market.
                • rising disposable incomes is the driving factor this market.
                • and changing dietary habits. As more consumers seek out convenient and tasty food options is the driving factor this market.
                • the demand for high-quality bakery products continues to rise.Emulsified shortenings play a crucial role in the bakery industry by enhancing the texture is the driving factor this market.
                • moisture retention is the driving factor this market.
                • and shelf life of baked goods. These shortenings are essential for producing products with consistent quality and desirable sensory attributes. The ability of emulsified shortenings to improve the volume and crumb structure of cakes is the driving factor this market.
                • as well as the flakiness of pastries is the driving factor this market.
                • makes them indispensable in commercial baking operations.The growth of the bakery industry is also supported by innovations in product formulations and the introduction of new bakery items. As manufacturers strive to meet the evolving tastes and preferences of consumers is the driving factor this market.
                • the demand for specialized ingredients such as emulsified shortenings is expected to increase. Additionally is the driving factor this market.
                • the trend toward clean labels and natural ingredients is driving the development of shortenings that align with these consumer preferences.Overall is the driving factor this market.
                • the expansion of the bakery industry is a key driver for the global emulsified shortenings market. The increasing demand for high-quality baked goods is the driving factor this market.
                • coupled with innovations in product formulations is the driving factor this market.
                • ensures that emulsified shortenings will continue to play a vital role in the growth and success of the bakery sector. is the driving factor this market.

                The Emulsified Shortenings market vendors should focus on grabbing business opportunities from the Food and beverage segment as it accounted for the largest market share in the base year.