Palm Oil Market Analysis, Size, and Forecast 2026-2030: APAC (Indonesia, India, and China), Middle East and Africa (Saudi Arabia, South Africa, and UAE), Europe (Germany, The Netherlands, and France), North America (US, Canada, and Mexico), South America (Brazil, Argentina, and Colombia), and Rest of World (ROW)

Palm Oil Market Analysis, Size, and Forecast 2026-2030:
APAC (Indonesia, India, and China), Middle East and Africa (Saudi Arabia, South Africa, and UAE), Europe (Germany, The Netherlands, and France), North America (US, Canada, and Mexico), South America (Brazil, Argentina, and Colombia), and Rest of World (ROW)

Published: Mar 2026 299 Pages SKU: IRTNTR71765

Market Overview at a Glance

$23.67 B
Market Opportunity
4.3%
CAGR 2025 - 2030
75.9%
APAC Growth
$67.37 B
Edible oil segment 2024

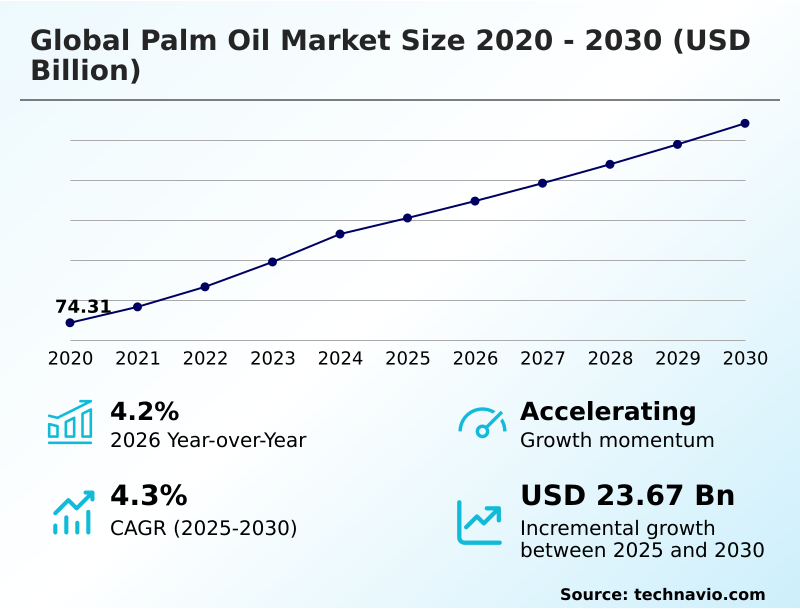
Palm Oil Market Size 2026-2030

The palm oil market size is valued to increase by USD 23.67 billion, at a CAGR of 4.3% from 2025 to 2030. Versatility and cost-effectiveness driving food and beverage sector demand will drive the palm oil market.

Major Market Trends & Insights

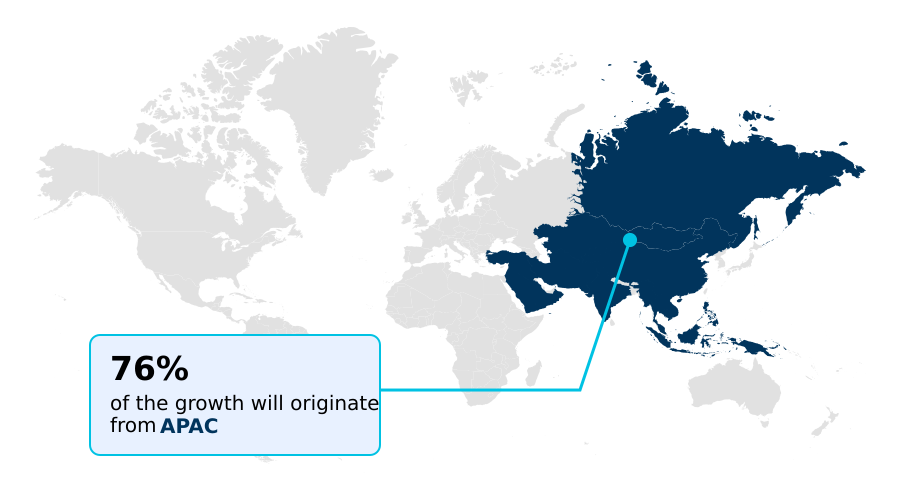
  • APAC dominated the market and accounted for a 75.9% growth during the forecast period.
  • By Application - Edible oil segment was valued at USD 67.37 billion in 2024
  • By Type - Conventional segment accounted for the largest market revenue share in 2024

Market Size & Forecast

  • Market Opportunities: USD 49.87 billion
  • Market Future Opportunities: USD 23.67 billion
  • CAGR from 2025 to 2030 : 4.3%

Market Summary

  • The palm oil market is shaped by the convergence of robust demand and significant sustainability pressures. Its utility as a cost-effective, versatile ingredient ensures its central role in the food, oleochemical, and biofuel sectors. Demand is driven by population growth and increased consumption of processed foods in developing nations.
  • However, the industry grapples with challenges tied to deforestation and social issues, spurring a market-wide shift towards traceability and certification. For instance, a food manufacturer aiming to comply with new import regulations must now invest in a transparent supply chain.
  • This involves integrating technologies to verify the origin of its raw materials, ensuring they are sourced from plantations that adhere to strict no-deforestation policies and fair labor standards. This pivot from a commodity-based approach to a quality-and-compliance model is redefining operational strategies and competitive positioning for all stakeholders involved.

What will be the Size of the Palm Oil Market during the forecast period?

Get Key Insights on Market Forecast (PDF) Request Free Sample

How is the Palm Oil Market Segmented?

The palm oil industry research report provides comprehensive data (region-wise segment analysis), with forecasts and estimates in "USD million" for the period 2026-2030, as well as historical data from 2020-2024 for the following segments.
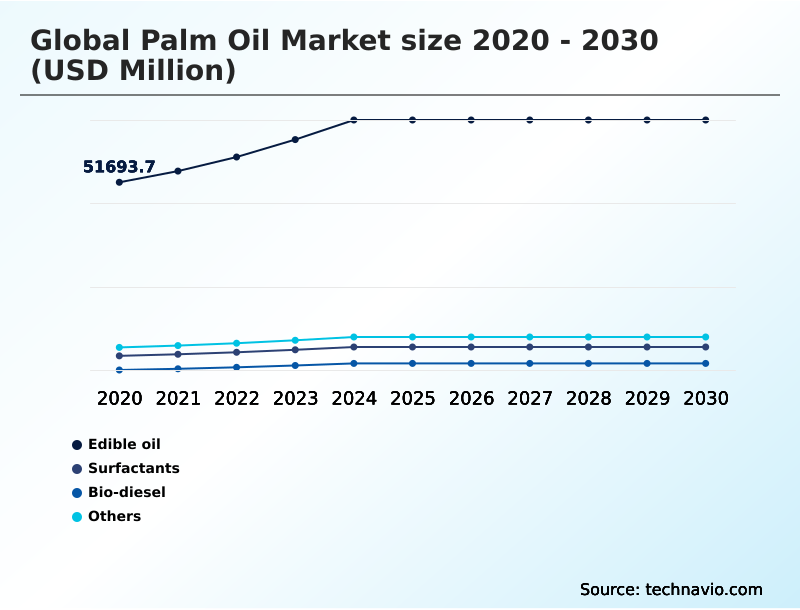
  • Application
    • Edible oil
    • Surfactants
    • Bio-diesel
    • Others
  • Type
    • Conventional
    • Organic
  • Product type
    • Crude palm oil
    • Fractionated palm oil
    • Palm kernel oil
  • Geography
    • APAC
      • Indonesia
      • India
      • China
    • Middle East and Africa
      • Saudi Arabia
      • South Africa
      • UAE
    • Europe
      • Germany
      • The Netherlands
      • France
    • North America
      • US
      • Canada
      • Mexico
    • South America
      • Brazil
      • Argentina
      • Colombia
    • Rest of World (ROW)

By Application Insights

The edible oil segment is estimated to witness significant growth during the forecast period.

The edible oil segment is foundational, driven by palm oil’s functional versatility and economic efficiency in food manufacturing ingredient applications.

The process of fractionation separates crude palm oil into liquid olein and solid stearin, creating tailored specialty fats and non-hydrogenated fats for diverse edible oil applications.

Its high oxidative stability and semi-solid fat texture make it ideal for bakery shortenings and confectionery fats, providing structure without hydrogenation. For frying oil stability, its resistance to thermal degradation extends shelf life.

The refining, bleaching, and deodorizing (RBD) process ensures a neutral profile essential for bio-based ingredients.

This functional adaptability, combined with its high-yield production that delivers a more than five-fold output advantage over other oilseed crops, secures its role in the food supply chain.

Request Free Sample

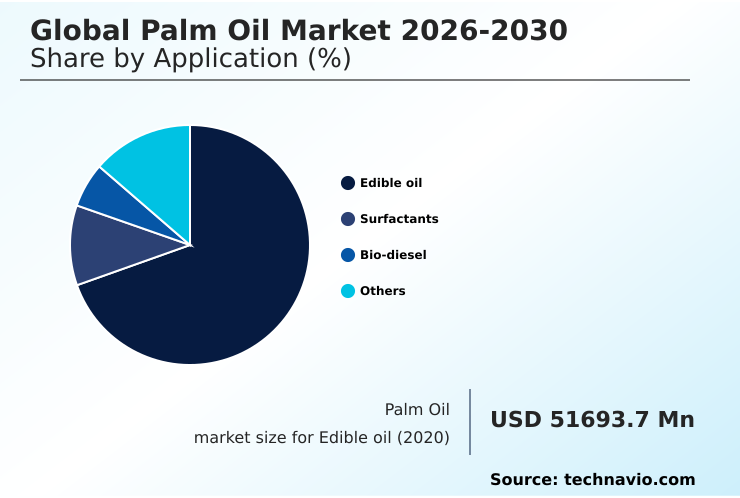
The Edible oil segment was valued at USD 67.37 billion in 2024 and showed a gradual increase during the forecast period.

Request Free Sample

Regional Analysis

APAC is estimated to contribute 75.9% to the growth of the global market during the forecast period.Technavio’s analysts have elaborately explained the regional trends and drivers that shape the market during the forecast period.

See How Palm Oil Market Demand is Rising in APAC Request Free Sample

The geographic landscape is dominated by APAC, which functions as both the primary production hub and a major consumption zone, accounting for over 75% of the market's incremental growth.

Countries in this region are central to the global supply of palm kernel oil, a key source of lauric acid and glycerin for surfactant production and personal care formulations.

In contrast, Europe and North America act as regulatory epicenters, driving the adoption of advanced supply chain traceability technologies like blockchain traceability and geospatial mapping.

This pressure compels producers to focus on sustainable intensification and improve the oil extraction rate (OER).

The industry is also seeing greater smallholder farmer integration into certified supply chains, a crucial step for achieving sector-wide compliance with international standards for fractionated palm oil.

Market Dynamics

Our researchers analyzed the data with 2025 as the base year, along with the key drivers, trends, and challenges. A holistic analysis of drivers will help companies refine their marketing strategies to gain a competitive advantage.

  • Understanding the global palm oil market 2026-2030 requires a nuanced view of its entire value chain. The debate over sustainable palm oil production methods is central, with a clear distinction between conventional vs organic palm oil processing. The role of technology in palm oil is critical, especially for improving palm oil crop yield sustainably.
  • After harvesting, the crude palm oil refining process and the subsequent palm oil fractionation process explained through technical documentation, are key to creating products for various sectors. For instance, using palm oil in biodiesel production is a major economic driver for the palm oil market, though it fuels the biofuel mandates effect on palm oil.
  • The palm oil vs soybean oil comparison is constantly evaluated by industrial buyers. In other sectors, palm kernel oil in cosmetics formulation relies on palm kernel oil lauric acid extraction. The future of palm oil oleochemicals looks robust, driven by the palm oil market in emerging economies.
  • However, operators face the impact of esg on palm oil and must contend with managing palm oil supply chain volatility.
  • Meeting the challenges in palm oil traceability and achieving deforestation-free palm oil sourcing are now essential for market access, with producers that have rspo certified palm oil benefits seeing a competitive advantage that can be as significant as a 15% price premium in certain European markets.

What are the key market drivers leading to the rise in the adoption of Palm Oil Industry?

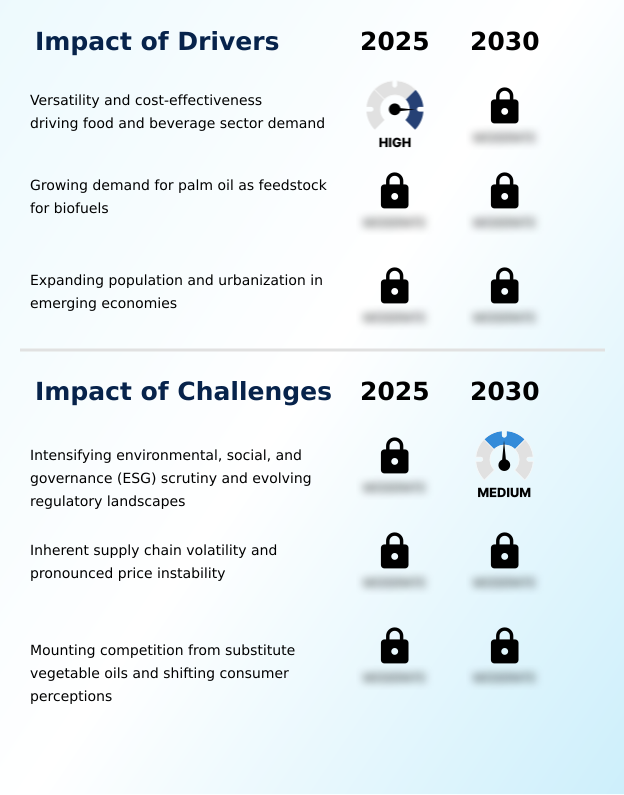
  • The key market driver is sustained demand from the food and beverage sector, fueled by the versatility and cost-effectiveness of palm oil as a primary food ingredient.

  • Robust demand from emerging economy demand, driven by rapid urban consumption patterns, underpins market expansion. The food vs.
  • fuel debate intensifies as biodiesel becomes a primary demand driver, with government energy security policy and biofuel feedstock mandates absorbing a significant portion of supply. For example, Indonesia’s B35 mandate diverts over 30% of its domestic production to transesterification processes.
  • Concurrently, agricultural advancements focusing on high-yielding seed varieties are boosting the output of fresh fruit bunches (FFB) per hectare, which enhances supply chain risk management against commodity price volatility.
  • This focus on yield improvement as a renewable feedstock source helps stabilize the supply of essential fatty acids for both food and industrial applications without requiring further land expansion.

What are the market trends shaping the Palm Oil Industry?

  • The ascendancy of sustainability mandates and the increasing demand for certified palm oil are prominent market trends. These factors are compelling producers and end-users to overhaul supply chains to meet stringent ESG criteria.

  • A significant trend is the strategic diversification into downstream processing to create value-added derivatives. This pivot towards the oleochemical industry growth is fueled by demand for sustainable ingredients in consumer goods. The circular economy model is being actively implemented through waste-to-value conversion, where palm oil mill effluent (POME) is used for biogas generation and solid waste is turned into bio-fertilizers.
  • Adherence to sustainability certification, including RSPO certification and MSPO certification, is no longer optional. Leading vertically integrated companies have achieved over 98% traceability in their sustainable sourcing efforts. This focus on creating a transparent oleochemicals supply chain is enabling companies to meet stringent regulatory demands while capturing higher margins, with some specialized derivatives commanding a 20% premium over crude oil.

What challenges does the Palm Oil Industry face during its growth?

  • A key challenge affecting industry growth is intensifying environmental, social, and governance (ESG) scrutiny, which is compounded by an evolving and complex regulatory landscape.

  • The market faces intense challenges from environmental, social, and governance (ESG) scrutiny and complex regulatory compliance, which now dictate market access. The pressure of consumer perception management has spurred a product reformulation trend, leading to increased competition from vegetable oil substitutes. For example, the 'palm-free' movement has contributed to a 5% market share decline in certain European consumer goods categories.
  • Producers must now prove their deforestation-free supply chain credentials by documenting that plantations are not on high-carbon-stock or high-conservation-value lands and by upholding strict labor practice standards and land tenure rights. The operational cost to meet these NDPE commitments and obtain ISPO certification can increase production expenses by up to 10% for some operators, squeezing margins amidst price pressures.

Exclusive Technavio Analysis on Customer Landscape

The palm oil market forecasting report includes the adoption lifecycle of the market, covering from the innovator’s stage to the laggard’s stage. It focuses on adoption rates in different regions based on penetration. Furthermore, the palm oil market report also includes key purchase criteria and drivers of price sensitivity to help companies evaluate and develop their market growth analysis strategies.

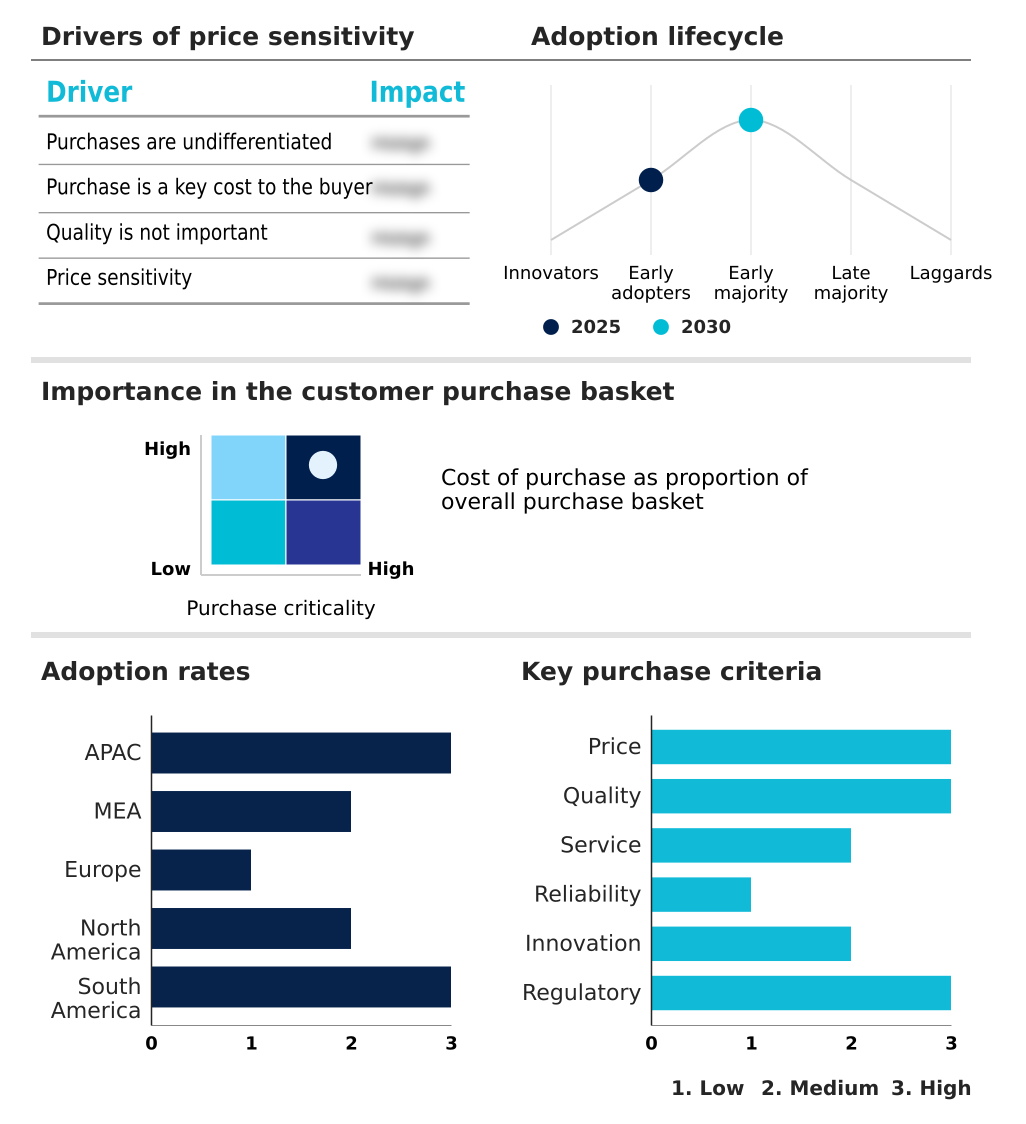
Customer Landscape of Palm Oil Industry

Competitive Landscape

Companies are implementing various strategies, such as strategic alliances, palm oil market forecast, partnerships, mergers and acquisitions, geographical expansion, and product/service launches, to enhance their presence in the industry.

Alami Commodities Sdn Bhd - Offerings span from crude and fractionated oils for food applications to specialized oleochemicals and biodiesel, addressing diverse industrial needs with versatile feedstocks.

The industry research and growth report includes detailed analyses of the competitive landscape of the market and information about key companies, including:

  • Alami Commodities Sdn Bhd
  • Archer Daniels Midland Co.
  • Asian Agri
  • Best Industry Group
  • Bunge Global SA
  • Cargill Inc.
  • Charleston Holdings Pte Ltd.
  • FGV Holdings Berhad
  • Gujarat Ambuja Exports Ltd.
  • IOI Corp. Berhad
  • Kuala Lumpur Kepong Berhad
  • Musim Mas Group
  • Nisshin Oillio Group Ltd.
  • Oil Palm India Ltd.
  • Olam Group Ltd.
  • Patanjali Ayurved Ltd.
  • Sinar Mas Group
  • Univanich Palm Oil PCL
  • Wilmar International Ltd.

Qualitative and quantitative analysis of companies has been conducted to help clients understand the wider business environment as well as the strengths and weaknesses of key industry players. Data is qualitatively analyzed to categorize companies as pure play, category-focused, industry-focused, and diversified; it is quantitatively analyzed to categorize companies as dominant, leading, strong, tentative, and weak.

Recent Development and News in Palm oil market

  • In November 2024, Cargill Inc. announced the expansion of its smallholder partnership program to over 26,400 participants as part of its strategy to build a deforestation-free supply chain.
  • In February 2025, palm oil producer associations from Colombia, Ecuador, and Brazil signed the Latin American Charter for Sustainable Palm Oil, committing to 100% deforestation-free production across the region.
  • In March 2025, a consortium of major North American food manufacturers and retailers launched the North American Responsible Palm Oil Sourcing Charter, creating unified requirements for supply chain traceability and labor rights.
  • In May 2025, Malaysia announced a strategic relocation of its regional palm oil council office to Kenya, aiming to establish the country as a central processing and distribution hub for East Africa.

Dive into Technavio’s robust research methodology, blending expert interviews, extensive data synthesis, and validated models for unparalleled Palm Oil Market insights. See full methodology.

Market Scope
Page number 299
Base year 2025
Historic period 2020-2024
Forecast period 2026-2030
Growth momentum & CAGR Accelerate at a CAGR of 4.3%
Market growth 2026-2030 USD 23672.9 million
Market structure Fragmented
YoY growth 2025-2026(%) 4.2%
Key countries Indonesia, Malaysia, India, China, Thailand, Japan, Nigeria, Egypt, Saudi Arabia, South Africa, UAE, Germany, The Netherlands, France, UK, Spain, Italy, US, Canada, Mexico, Brazil, Argentina and Colombia
Competitive landscape Leading Companies, Market Positioning of Companies, Competitive Strategies, and Industry Risks

Request Free Sample

Research Analyst Overview

  • The palm oil market is undergoing a fundamental transformation where environmental, social, and governance compliance is now a primary determinant of corporate strategy. Boardroom decisions are increasingly focused on capital expenditures for sustainable intensification and advanced supply chain traceability to mitigate risks and secure market access.
  • This involves deploying technologies like blockchain traceability and geospatial mapping to verify NDPE commitments and ensure no sourcing from high-carbon-stock or high-conservation-value areas. Operationally, this shift promotes a circular economy, with investments in biogas generation from palm oil mill effluent (POME) and the creation of bio-fertilizers.
  • The entire production chain, from managing fresh fruit bunches (FFB) to optimizing the oil extraction rate (OER) and monitoring free fatty acid (FFA) content, is being re-engineered. The adoption of high-yielding seed varieties and precision agriculture is becoming standard.
  • Downstream, the value chain extends from crude palm oil through the refining, bleaching, and deodorizing (RBD) process to create fractionated palm oil, semi-solid fat, and specialty fats.
  • These bio-based ingredients, known for oxidative stability, are a renewable feedstock for biodiesel through transesterification, and for oleochemicals like fatty acids, lauric acid, and glycerin, all underpinned by robust RSPO, ISPO, and MSPO sustainability certification frameworks. For instance, leading producers now demonstrate over 98% traceability to the mill, a critical benchmark for stakeholders.

What are the Key Data Covered in this Palm Oil Market Research and Growth Report?

  • What is the expected growth of the Palm Oil Market between 2026 and 2030?

    • USD 23.67 billion, at a CAGR of 4.3%

  • What segmentation does the market report cover?

    • The report is segmented by Application (Edible oil, Surfactants, Bio-diesel, and Others), Type (Conventional, and Organic), Product Type (Crude palm oil, Fractionated palm oil, and Palm kernel oil) and Geography (APAC, Middle East and Africa, Europe, North America, South America)

  • Which regions are analyzed in the report?

    • APAC, Middle East and Africa, Europe, North America and South America

  • What are the key growth drivers and market challenges?

    • Versatility and cost-effectiveness driving food and beverage sector demand, Intensifying environmental, social, and governance (ESG) scrutiny and evolving regulatory landscapes

  • Who are the major players in the Palm Oil Market?

    • Alami Commodities Sdn Bhd, Archer Daniels Midland Co., Asian Agri, Best Industry Group, Bunge Global SA, Cargill Inc., Charleston Holdings Pte Ltd., FGV Holdings Berhad, Gujarat Ambuja Exports Ltd., IOI Corp. Berhad, Kuala Lumpur Kepong Berhad, Musim Mas Group, Nisshin Oillio Group Ltd., Oil Palm India Ltd., Olam Group Ltd., Patanjali Ayurved Ltd., Sinar Mas Group, Univanich Palm Oil PCL and Wilmar International Ltd.

Market Research Insights

  • The market is shaped by a dynamic interplay between cost efficiency and stringent sustainability requirements. While its functional properties drive demand in food and industrial applications, regulatory compliance and consumer perception management are increasingly influential. A clear bifurcation is evident, with sustainably sourced palm oil commanding a market advantage.
  • For instance, major producers have achieved over 98% traceability to the mill, a critical metric for retaining access to regulated markets. Concurrently, partnership programs have successfully integrated more than 26,000 smallholders into deforestation-free supply chains, showcasing a commitment to social responsibility. This focus on verifiable sustainability is reshaping supply chain risk management and sourcing strategies globally.

We can help! Our analysts can customize this palm oil market research report to meet your requirements.

Get in touch

1. Executive Summary

1.1 Market overview

Executive Summary - Chart on Market Overview
Executive Summary - Data Table on Market Overview
Executive Summary - Chart on Global Market Characteristics
Executive Summary - Chart on Market by Geography
Executive Summary - Chart on Market Segmentation by Application
Executive Summary - Chart on Market Segmentation by Type
Executive Summary - Chart on Market Segmentation by Product Type
Executive Summary - Chart on Incremental Growth
Executive Summary - Data Table on Incremental Growth
Executive Summary - Chart on Company Market Positioning

2. Technavio Analysis

2.1 Analysis of price sensitivity, lifecycle, customer purchase basket, adoption rates, and purchase criteria

2.2 Criticality of inputs and Factors of differentiation

Chart on Overview on criticality of inputs and factors of differentiation

2.3 Factors of disruption

Chart on Overview on factors of disruption

2.4 Impact of drivers and challenges

Chart on Impact of drivers and challenges in 2025 and 2030

3. Market Landscape

3.1 Market ecosystem

Chart on Parent Market
Data Table on - Parent Market

3.2 Market characteristics

Chart on Market characteristics analysis

3.3 Value chain analysis

Chart on Value chain analysis

4. Market Sizing

4.1 Market definition

Data Table on Offerings of companies included in the market definition

4.2 Market segment analysis

Market segments

4.3 Market size 2025

4.4 Market outlook: Forecast for 2025-2030

Chart on Global - Market size and forecast 2025-2030 ($ million)
Data Table on Global - Market size and forecast 2025-2030 ($ million)
Chart on Global Market: Year-over-year growth 2025-2030 (%)
Data Table on Global Market: Year-over-year growth 2025-2030 (%)

5. Historic Market Size

5.1 Global Palm Oil Market 2020 - 2024

Historic Market Size - Data Table on Global Palm Oil Market 2020 - 2024 ($ million)

5.2 Application segment analysis 2020 - 2024

Historic Market Size - Application Segment 2020 - 2024 ($ million)

5.3 Type segment analysis 2020 - 2024

Historic Market Size - Type Segment 2020 - 2024 ($ million)

5.4 Product Type segment analysis 2020 - 2024

Historic Market Size - Product Type Segment 2020 - 2024 ($ million)

5.5 Geography segment analysis 2020 - 2024

Historic Market Size - Geography Segment 2020 - 2024 ($ million)

5.6 Country segment analysis 2020 - 2024

Historic Market Size - Country Segment 2020 - 2024 ($ million)

6. Qualitative Analysis

6.1 The impact of AI on global palm oil market

7. Five Forces Analysis

7.1 Five forces summary

Five forces analysis - Comparison between 2025 and 2030

7.2 Bargaining power of buyers

Bargaining power of buyers - Impact of key factors 2025 and 2030

7.3 Bargaining power of suppliers

Bargaining power of suppliers - Impact of key factors in 2025 and 2030

7.4 Threat of new entrants

Threat of new entrants - Impact of key factors in 2025 and 2030

7.5 Threat of substitutes

Threat of substitutes - Impact of key factors in 2025 and 2030

7.6 Threat of rivalry

Threat of rivalry - Impact of key factors in 2025 and 2030

7.7 Market condition

Chart on Market condition - Five forces 2025 and 2030

8. Market Segmentation by Application

8.1 Market segments

Chart on Application - Market share 2025-2030 (%)
Data Table on Application - Market share 2025-2030 (%)

8.2 Comparison by Application

Chart on Comparison by Application
Data Table on Comparison by Application

8.3 Edible oil - Market size and forecast 2025-2030

Chart on Edible oil - Market size and forecast 2025-2030 ($ million)
Data Table on Edible oil - Market size and forecast 2025-2030 ($ million)
Chart on Edible oil - Year-over-year growth 2025-2030 (%)
Data Table on Edible oil - Year-over-year growth 2025-2030 (%)

8.4 Surfactants - Market size and forecast 2025-2030

Chart on Surfactants - Market size and forecast 2025-2030 ($ million)
Data Table on Surfactants - Market size and forecast 2025-2030 ($ million)
Chart on Surfactants - Year-over-year growth 2025-2030 (%)
Data Table on Surfactants - Year-over-year growth 2025-2030 (%)

8.5 Bio-diesel - Market size and forecast 2025-2030

Chart on Bio-diesel - Market size and forecast 2025-2030 ($ million)
Data Table on Bio-diesel - Market size and forecast 2025-2030 ($ million)
Chart on Bio-diesel - Year-over-year growth 2025-2030 (%)
Data Table on Bio-diesel - Year-over-year growth 2025-2030 (%)

8.6 Others - Market size and forecast 2025-2030

Chart on Others - Market size and forecast 2025-2030 ($ million)
Data Table on Others - Market size and forecast 2025-2030 ($ million)
Chart on Others - Year-over-year growth 2025-2030 (%)
Data Table on Others - Year-over-year growth 2025-2030 (%)

8.7 Market opportunity by Application

Market opportunity by Application ($ million)
Data Table on Market opportunity by Application ($ million)

9. Market Segmentation by Type

9.1 Market segments

Chart on Type - Market share 2025-2030 (%)
Data Table on Type - Market share 2025-2030 (%)

9.2 Comparison by Type

Chart on Comparison by Type
Data Table on Comparison by Type

9.3 Conventional - Market size and forecast 2025-2030

Chart on Conventional - Market size and forecast 2025-2030 ($ million)
Data Table on Conventional - Market size and forecast 2025-2030 ($ million)
Chart on Conventional - Year-over-year growth 2025-2030 (%)
Data Table on Conventional - Year-over-year growth 2025-2030 (%)

9.4 Organic - Market size and forecast 2025-2030

Chart on Organic - Market size and forecast 2025-2030 ($ million)
Data Table on Organic - Market size and forecast 2025-2030 ($ million)
Chart on Organic - Year-over-year growth 2025-2030 (%)
Data Table on Organic - Year-over-year growth 2025-2030 (%)

9.5 Market opportunity by Type

Market opportunity by Type ($ million)
Data Table on Market opportunity by Type ($ million)

10. Market Segmentation by Product Type

10.1 Market segments

Chart on Product Type - Market share 2025-2030 (%)
Data Table on Product Type - Market share 2025-2030 (%)

10.2 Comparison by Product Type

Chart on Comparison by Product Type
Data Table on Comparison by Product Type

10.3 Crude palm oil - Market size and forecast 2025-2030

Chart on Crude palm oil - Market size and forecast 2025-2030 ($ million)
Data Table on Crude palm oil - Market size and forecast 2025-2030 ($ million)
Chart on Crude palm oil - Year-over-year growth 2025-2030 (%)
Data Table on Crude palm oil - Year-over-year growth 2025-2030 (%)

10.4 Fractionated palm oil - Market size and forecast 2025-2030

Chart on Fractionated palm oil - Market size and forecast 2025-2030 ($ million)
Data Table on Fractionated palm oil - Market size and forecast 2025-2030 ($ million)
Chart on Fractionated palm oil - Year-over-year growth 2025-2030 (%)
Data Table on Fractionated palm oil - Year-over-year growth 2025-2030 (%)

10.5 Palm kernel oil - Market size and forecast 2025-2030

Chart on Palm kernel oil - Market size and forecast 2025-2030 ($ million)
Data Table on Palm kernel oil - Market size and forecast 2025-2030 ($ million)
Chart on Palm kernel oil - Year-over-year growth 2025-2030 (%)
Data Table on Palm kernel oil - Year-over-year growth 2025-2030 (%)

10.6 Market opportunity by Product Type

Market opportunity by Product Type ($ million)
Data Table on Market opportunity by Product Type ($ million)

11. Customer Landscape

11.1 Customer landscape overview

Analysis of price sensitivity, lifecycle, customer purchase basket, adoption rates, and purchase criteria

12. Geographic Landscape

12.1 Geographic segmentation

Chart on Market share by geography 2025-2030 (%)
Data Table on Market share by geography 2025-2030 (%)

12.2 Geographic comparison

Chart on Geographic comparison
Data Table on Geographic comparison

12.3 APAC - Market size and forecast 2025-2030

Chart on APAC - Market size and forecast 2025-2030 ($ million)
Data Table on APAC - Market size and forecast 2025-2030 ($ million)
Chart on APAC - Year-over-year growth 2025-2030 (%)
Data Table on APAC - Year-over-year growth 2025-2030 (%)
Chart on Regional Comparison - APAC
Data Table on Regional Comparison - APAC

12.3.1 Indonesia - Market size and forecast 2025-2030

Chart on Indonesia - Market size and forecast 2025-2030 ($ million)
Data Table on Indonesia - Market size and forecast 2025-2030 ($ million)
Chart on Indonesia - Year-over-year growth 2025-2030 (%)
Data Table on Indonesia - Year-over-year growth 2025-2030 (%)

12.3.2 Malaysia - Market size and forecast 2025-2030

Chart on Malaysia - Market size and forecast 2025-2030 ($ million)
Data Table on Malaysia - Market size and forecast 2025-2030 ($ million)
Chart on Malaysia - Year-over-year growth 2025-2030 (%)
Data Table on Malaysia - Year-over-year growth 2025-2030 (%)

12.3.3 India - Market size and forecast 2025-2030

Chart on India - Market size and forecast 2025-2030 ($ million)
Data Table on India - Market size and forecast 2025-2030 ($ million)
Chart on India - Year-over-year growth 2025-2030 (%)
Data Table on India - Year-over-year growth 2025-2030 (%)

12.3.4 China - Market size and forecast 2025-2030

Chart on China - Market size and forecast 2025-2030 ($ million)
Data Table on China - Market size and forecast 2025-2030 ($ million)
Chart on China - Year-over-year growth 2025-2030 (%)
Data Table on China - Year-over-year growth 2025-2030 (%)

12.3.5 Thailand - Market size and forecast 2025-2030

Chart on Thailand - Market size and forecast 2025-2030 ($ million)
Data Table on Thailand - Market size and forecast 2025-2030 ($ million)
Chart on Thailand - Year-over-year growth 2025-2030 (%)
Data Table on Thailand - Year-over-year growth 2025-2030 (%)

12.3.6 Japan - Market size and forecast 2025-2030

Chart on Japan - Market size and forecast 2025-2030 ($ million)
Data Table on Japan - Market size and forecast 2025-2030 ($ million)
Chart on Japan - Year-over-year growth 2025-2030 (%)
Data Table on Japan - Year-over-year growth 2025-2030 (%)

12.4 Middle East and Africa - Market size and forecast 2025-2030

Chart on Middle East and Africa - Market size and forecast 2025-2030 ($ million)
Data Table on Middle East and Africa - Market size and forecast 2025-2030 ($ million)
Chart on Middle East and Africa - Year-over-year growth 2025-2030 (%)
Data Table on Middle East and Africa - Year-over-year growth 2025-2030 (%)
Chart on Regional Comparison - Middle East and Africa
Data Table on Regional Comparison - Middle East and Africa

12.4.1 Nigeria - Market size and forecast 2025-2030

Chart on Nigeria - Market size and forecast 2025-2030 ($ million)
Data Table on Nigeria - Market size and forecast 2025-2030 ($ million)
Chart on Nigeria - Year-over-year growth 2025-2030 (%)
Data Table on Nigeria - Year-over-year growth 2025-2030 (%)

12.4.2 Egypt - Market size and forecast 2025-2030

Chart on Egypt - Market size and forecast 2025-2030 ($ million)
Data Table on Egypt - Market size and forecast 2025-2030 ($ million)
Chart on Egypt - Year-over-year growth 2025-2030 (%)
Data Table on Egypt - Year-over-year growth 2025-2030 (%)

12.4.3 Saudi Arabia - Market size and forecast 2025-2030

Chart on Saudi Arabia - Market size and forecast 2025-2030 ($ million)
Data Table on Saudi Arabia - Market size and forecast 2025-2030 ($ million)
Chart on Saudi Arabia - Year-over-year growth 2025-2030 (%)
Data Table on Saudi Arabia - Year-over-year growth 2025-2030 (%)

12.4.4 South Africa - Market size and forecast 2025-2030

Chart on South Africa - Market size and forecast 2025-2030 ($ million)
Data Table on South Africa - Market size and forecast 2025-2030 ($ million)
Chart on South Africa - Year-over-year growth 2025-2030 (%)
Data Table on South Africa - Year-over-year growth 2025-2030 (%)

12.4.5 UAE - Market size and forecast 2025-2030

Chart on UAE - Market size and forecast 2025-2030 ($ million)
Data Table on UAE - Market size and forecast 2025-2030 ($ million)
Chart on UAE - Year-over-year growth 2025-2030 (%)
Data Table on UAE - Year-over-year growth 2025-2030 (%)

12.5 Europe - Market size and forecast 2025-2030

Chart on Europe - Market size and forecast 2025-2030 ($ million)
Data Table on Europe - Market size and forecast 2025-2030 ($ million)
Chart on Europe - Year-over-year growth 2025-2030 (%)
Data Table on Europe - Year-over-year growth 2025-2030 (%)
Chart on Regional Comparison - Europe
Data Table on Regional Comparison - Europe

12.5.1 Germany - Market size and forecast 2025-2030

Chart on Germany - Market size and forecast 2025-2030 ($ million)
Data Table on Germany - Market size and forecast 2025-2030 ($ million)
Chart on Germany - Year-over-year growth 2025-2030 (%)
Data Table on Germany - Year-over-year growth 2025-2030 (%)

12.5.2 The Netherlands - Market size and forecast 2025-2030

Chart on The Netherlands - Market size and forecast 2025-2030 ($ million)
Data Table on The Netherlands - Market size and forecast 2025-2030 ($ million)
Chart on The Netherlands - Year-over-year growth 2025-2030 (%)
Data Table on The Netherlands - Year-over-year growth 2025-2030 (%)

12.5.3 France - Market size and forecast 2025-2030

Chart on France - Market size and forecast 2025-2030 ($ million)
Data Table on France - Market size and forecast 2025-2030 ($ million)
Chart on France - Year-over-year growth 2025-2030 (%)
Data Table on France - Year-over-year growth 2025-2030 (%)

12.5.4 UK - Market size and forecast 2025-2030

Chart on UK - Market size and forecast 2025-2030 ($ million)
Data Table on UK - Market size and forecast 2025-2030 ($ million)
Chart on UK - Year-over-year growth 2025-2030 (%)
Data Table on UK - Year-over-year growth 2025-2030 (%)

12.5.5 Spain - Market size and forecast 2025-2030

Chart on Spain - Market size and forecast 2025-2030 ($ million)
Data Table on Spain - Market size and forecast 2025-2030 ($ million)
Chart on Spain - Year-over-year growth 2025-2030 (%)
Data Table on Spain - Year-over-year growth 2025-2030 (%)

12.5.6 Italy - Market size and forecast 2025-2030

Chart on Italy - Market size and forecast 2025-2030 ($ million)
Data Table on Italy - Market size and forecast 2025-2030 ($ million)
Chart on Italy - Year-over-year growth 2025-2030 (%)
Data Table on Italy - Year-over-year growth 2025-2030 (%)

12.6 North America - Market size and forecast 2025-2030

Chart on North America - Market size and forecast 2025-2030 ($ million)
Data Table on North America - Market size and forecast 2025-2030 ($ million)
Chart on North America - Year-over-year growth 2025-2030 (%)
Data Table on North America - Year-over-year growth 2025-2030 (%)
Chart on Regional Comparison - North America
Data Table on Regional Comparison - North America

12.6.1 US - Market size and forecast 2025-2030

Chart on US - Market size and forecast 2025-2030 ($ million)
Data Table on US - Market size and forecast 2025-2030 ($ million)
Chart on US - Year-over-year growth 2025-2030 (%)
Data Table on US - Year-over-year growth 2025-2030 (%)

12.6.2 Canada - Market size and forecast 2025-2030

Chart on Canada - Market size and forecast 2025-2030 ($ million)
Data Table on Canada - Market size and forecast 2025-2030 ($ million)
Chart on Canada - Year-over-year growth 2025-2030 (%)
Data Table on Canada - Year-over-year growth 2025-2030 (%)

12.6.3 Mexico - Market size and forecast 2025-2030

Chart on Mexico - Market size and forecast 2025-2030 ($ million)
Data Table on Mexico - Market size and forecast 2025-2030 ($ million)
Chart on Mexico - Year-over-year growth 2025-2030 (%)
Data Table on Mexico - Year-over-year growth 2025-2030 (%)

12.7 South America - Market size and forecast 2025-2030

Chart on South America - Market size and forecast 2025-2030 ($ million)
Data Table on South America - Market size and forecast 2025-2030 ($ million)
Chart on South America - Year-over-year growth 2025-2030 (%)
Data Table on South America - Year-over-year growth 2025-2030 (%)
Chart on Regional Comparison - South America
Data Table on Regional Comparison - South America

12.7.1 Brazil - Market size and forecast 2025-2030

Chart on Brazil - Market size and forecast 2025-2030 ($ million)
Data Table on Brazil - Market size and forecast 2025-2030 ($ million)
Chart on Brazil - Year-over-year growth 2025-2030 (%)
Data Table on Brazil - Year-over-year growth 2025-2030 (%)

12.7.2 Argentina - Market size and forecast 2025-2030

Chart on Argentina - Market size and forecast 2025-2030 ($ million)
Data Table on Argentina - Market size and forecast 2025-2030 ($ million)
Chart on Argentina - Year-over-year growth 2025-2030 (%)
Data Table on Argentina - Year-over-year growth 2025-2030 (%)

12.7.3 Colombia - Market size and forecast 2025-2030

Chart on Colombia - Market size and forecast 2025-2030 ($ million)
Data Table on Colombia - Market size and forecast 2025-2030 ($ million)
Chart on Colombia - Year-over-year growth 2025-2030 (%)
Data Table on Colombia - Year-over-year growth 2025-2030 (%)

12.8 Market opportunity by geography

Market opportunity by geography ($ million)
Data Tables on Market opportunity by geography ($ million)

13. Drivers, Challenges, and Opportunity

13.1 Market drivers

Versatility and cost-effectiveness driving food and beverage sector demand
Growing demand for palm oil as feedstock for biofuels
Expanding population and urbanization in emerging economies

13.2 Market challenges

Intensifying environmental, social, and governance (ESG) scrutiny and evolving regulatory landscapes
Inherent supply chain volatility and pronounced price instability
Mounting competition from substitute vegetable oils and shifting consumer perceptions

13.3 Impact of drivers and challenges

Impact of drivers and challenges in 2025 and 2030

13.4 Market opportunities

Ascendancy of sustainability mandates and certified palm oil
Diversification into high-value downstream applications oleochemicals
Integration of technological advancements for enhanced productivity and traceability

14. Competitive Landscape

14.1 Overview

14.2

Overview on criticality of inputs and factors of differentiation

14.3 Landscape disruption

Overview on factors of disruption

14.4 Industry risks

Impact of key risks on business

15. Competitive Analysis

15.1 Companies profiled

Companies covered

15.2 Company ranking index

15.3 Market positioning of companies

Matrix on companies position and classification

15.4 Alami Commodities Sdn Bhd

Alami Commodities Sdn Bhd - Overview
Alami Commodities Sdn Bhd - Product / Service
Alami Commodities Sdn Bhd - Key offerings
SWOT

15.5 Archer Daniels Midland Co.

Archer Daniels Midland Co. - Overview
Archer Daniels Midland Co. - Business segments
Archer Daniels Midland Co. - Key news
Archer Daniels Midland Co. - Key offerings
Archer Daniels Midland Co. - Segment focus
SWOT

15.6 Asian Agri

Asian Agri - Overview
Asian Agri - Product / Service
Asian Agri - Key offerings
SWOT

15.7 Bunge Global SA

Bunge Global SA - Overview
Bunge Global SA - Business segments
Bunge Global SA - Key news
Bunge Global SA - Key offerings
Bunge Global SA - Segment focus
SWOT

15.8 Cargill Inc.

Cargill Inc. - Overview
Cargill Inc. - Product / Service
Cargill Inc. - Key offerings
SWOT

15.9 Charleston Holdings Pte Ltd.

Charleston Holdings Pte Ltd. - Overview
Charleston Holdings Pte Ltd. - Product / Service
Charleston Holdings Pte Ltd. - Key offerings
SWOT

15.10 FGV Holdings Berhad

FGV Holdings Berhad - Overview
FGV Holdings Berhad - Business segments
FGV Holdings Berhad - Key offerings
FGV Holdings Berhad - Segment focus
SWOT

15.11 Gujarat Ambuja Exports Ltd.

Gujarat Ambuja Exports Ltd. - Overview
Gujarat Ambuja Exports Ltd. - Business segments
Gujarat Ambuja Exports Ltd. - Key offerings
Gujarat Ambuja Exports Ltd. - Segment focus
SWOT

15.12 IOI Corp. Berhad

IOI Corp. Berhad - Overview
IOI Corp. Berhad - Business segments
IOI Corp. Berhad - Key offerings
IOI Corp. Berhad - Segment focus
SWOT

15.13 Kuala Lumpur Kepong Berhad

Kuala Lumpur Kepong Berhad - Overview
Kuala Lumpur Kepong Berhad - Business segments
Kuala Lumpur Kepong Berhad - Key offerings
Kuala Lumpur Kepong Berhad - Segment focus
SWOT

15.14 Musim Mas Group

Musim Mas Group - Overview
Musim Mas Group - Product / Service
Musim Mas Group - Key offerings
SWOT

15.15 Nisshin Oillio Group Ltd.

Nisshin Oillio Group Ltd. - Overview
Nisshin Oillio Group Ltd. - Business segments
Nisshin Oillio Group Ltd. - Key offerings
Nisshin Oillio Group Ltd. - Segment focus
SWOT

15.16 Olam Group Ltd.

Olam Group Ltd. - Overview
Olam Group Ltd. - Business segments
Olam Group Ltd. - Key offerings
Olam Group Ltd. - Segment focus
SWOT

15.17 Univanich Palm Oil PCL

Univanich Palm Oil PCL - Overview
Univanich Palm Oil PCL - Business segments
Univanich Palm Oil PCL - Key offerings
Univanich Palm Oil PCL - Segment focus
SWOT

15.18 Wilmar International Ltd.

Wilmar International Ltd. - Overview
Wilmar International Ltd. - Business segments
Wilmar International Ltd. - Key offerings
Wilmar International Ltd. - Segment focus
SWOT

16. Appendix

16.1 Scope of the report

Market definition
Objectives
Notes and caveats

16.2 Inclusions and exclusions checklist

Inclusions checklist
Exclusions checklist

16.3 Currency conversion rates for US$

16.4 Research methodology

16.5 Data procurement

Information sources

16.6 Data validation

16.7 Validation techniques employed for market sizing

16.8 Data synthesis

16.9 360 degree market analysis

16.10 List of abbreviations

Research Methodology

Technavio presents a detailed picture of the market by way of study, synthesis, and summation of data from multiple sources. The analysts have presented the various facets of the market with a particular focus on identifying the key industry influencers. The data thus presented is comprehensive, reliable, and the result of extensive research, both primary and secondary.

INFORMATION SOURCES

Primary sources

  • Manufacturers and suppliers
  • Channel partners
  • Industry experts
  • Strategic decision makers

Secondary sources

  • Industry journals and periodicals
  • Government data
  • Financial reports of key industry players
  • Historical data
  • Press releases

DATA ANALYSIS

Data Synthesis

  • Collation of data
  • Estimation of key figures
  • Analysis of derived insights

Data Validation

  • Triangulation with data models
  • Reference against proprietary databases
  • Corroboration with industry experts

REPORT WRITING

Qualitative

  • Market drivers
  • Market challenges
  • Market trends
  • Five forces analysis

Quantitative

  • Market size and forecast
  • Market segmentation
  • Geographical insights
  • Competitive landscape

Interested in this report?

Get your sample now to see our research methodology and insights!

Download Now

Frequently Asked Questions

Palm Oil market growth will increase by USD 23672.9 million during 2026-2030.

The Palm Oil market is expected to grow at a CAGR of 4.3% during 2026-2030.

Palm Oil market is segmented by Application (Edible oil, Surfactants, Bio-diesel, Others) Type (Conventional, Organic) Product type (Crude palm oil, Fractionated palm oil, Palm kernel oil)

Alami Commodities Sdn Bhd, Archer Daniels Midland Co., Asian Agri, Best Industry Group, Bunge Global SA, Cargill Inc., Charleston Holdings Pte Ltd., FGV Holdings Berhad, Gujarat Ambuja Exports Ltd., IOI Corp. Berhad, Kuala Lumpur Kepong Berhad, Musim Mas Group, Nisshin Oillio Group Ltd., Oil Palm India Ltd., Olam Group Ltd., Patanjali Ayurved Ltd., Sinar Mas Group, Univanich Palm Oil PCL, Wilmar International Ltd. are a few of the key vendors in the Palm Oil market.

APAC will register the highest growth rate of 75.9% among the other regions. Therefore, the Palm Oil market in APAC is expected to garner significant business opportunities for the vendors during the forecast period.

Indonesia, Malaysia, India, China, Thailand, Japan, Nigeria, Egypt, Saudi Arabia, South Africa, UAE, Germany, The Netherlands, France, UK, Spain, Italy, US, Canada, Mexico, Brazil, Argentina, Colombia

  • Versatility and cost-effectiveness driving food and beverage sector demand is the driving factor this market.

The Palm Oil market vendors should focus on grabbing business opportunities from the Application segment as it accounted for the largest market share in the base year.
RIA - Research AI Assistant
Ask RIA