
EMV POS Terminals Market Size 2024-2028
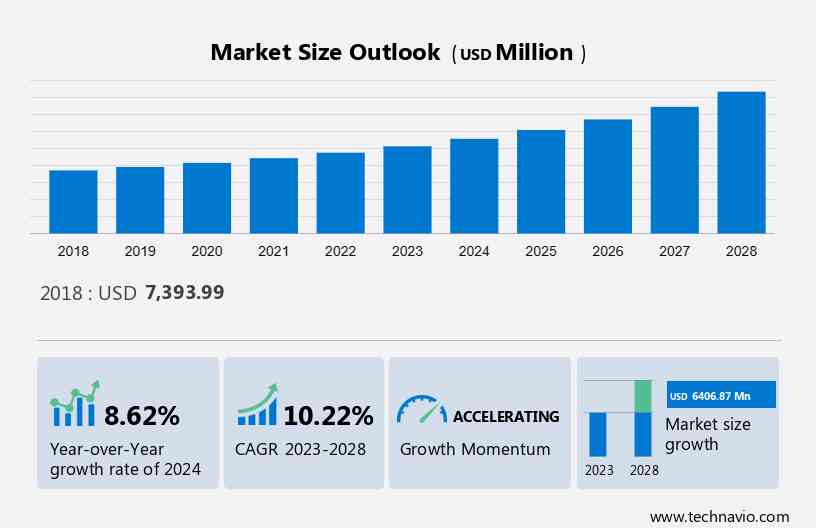
The emv pos terminals market size is forecast to increase by USD 6.41 billion at a CAGR of 10.22% between 2023 and 2028.
- The market is experiencing significant growth due to several key trends. The increasing volume of e-commerce transactions is driving the demand for mobile point-of-sale (mPOS) terminals, which offer convenience and flexibility for merchants and consumers alike. Another trend is the use of magnetic secure transmission (MST) technology by mobile phone Original Equipment Manufacturers (OEMs), enabling contactless payments using smartphones. Additionally, the growing number of online transactions necessitates the adoption of secure and reliable POS terminals to ensure data security and prevent fraud. These factors are expected to boost market growth In the coming years.
What will be the Size of the EMV POS Terminals Market During the Forecast Period?
- The market encompasses technology that facilitates secure financial transactions using chip cards. Europay, Mastercard, and Visa, leading digital payment brands, have spearheaded the adoption of EMV technology to enhance security and reduce fraud. Chip cards, embedded with microchips and PIN pads, offer enhanced transaction authentication and liability shift from merchants to issuers in case of fraud. Fraudsters continue to target sensitive card data, necessitating the need for robust security measures. EMV Pos Terminals provide a significant defense against clone cards and transaction code manipulation. The retail sector, healthcare, entertainment, transportation, and other industries have embraced EMV technology to safeguard customer data and mitigate fraud risks.
- The market's growth is driven by the increasing prevalence of smart chip cards and the shift towards contactless NFC technology. Smart Pos Terminals, equipped with advanced cybersecurity features, cater to the evolving needs of businesses. Despite these advancements, the market faces cybersecurity risks, necessitating continuous innovation and improvement. Overall, the market is poised for growth, driven by the need for secure and convenient payment solutions.
How is this EMV POS Terminals Industry segmented and which is the largest segment?
The emv pos terminals industry research report provides comprehensive data (region-wise segment analysis), with forecasts and estimates in "USD million" for the period 2024-2028, as well as historical data from 2018-2022 for the following segments.
- End-user
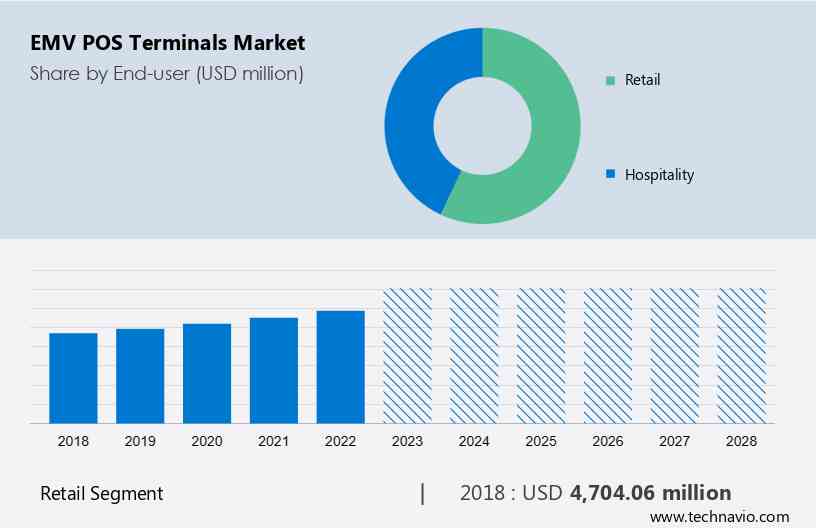
- Retail
- Hospitality
- Product
- Conventional EMV POS terminals
- Mobile card readers
- Geography
- APAC
- China
- India
- North America
- Canada
- US
- Europe
- UK
- South America
- Middle East and Africa
- APAC
By End-user Insights
The retail segment is estimated to witness significant growth during the forecast period. The retail industry, comprising hypermarkets, supermarkets, drug stores, gas stations, specialty stores, and mass merchandise outlets, has experienced substantial growth due to foreign investments, increasing competition, and expanding global economies. This evolution has led to the widespread adoption of secure payment technologies, specifically EMV standards, for POS terminals. Consumers seek faster and more convenient checkout experiences, driving merchants to implement contactless EMV POS terminals. NFC technology enables contactless transactions for both mobile and fixed EMV POS terminals, significantly reducing checkout times. Keywords: retail sector, EMV POS terminals, contactless payments, NFC technology, secure payment methods, checkout time, merchants.
Get a glance at the market report of various segments Request Free Sample
The Retail segment was valued at USD 4.7 billion in 2018 and showed a gradual increase during the forecast period.
Regional Analysis
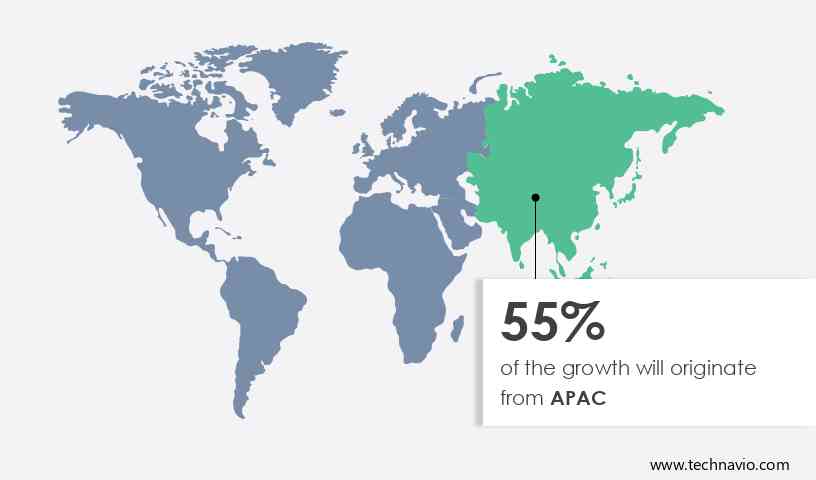
APAC is estimated to contribute 55% to the growth of the global market during the forecast period. Technavio's analysts have elaborately explained the regional trends and drivers that shape the market during the forecast period.
For more insights on the market size of various regions, Request Free Sample
The Asia-Pacific (APAC) market holds significant potential for EMV POS terminals due to the region's expanding retail sector and increasing focus on secure and efficient transaction processing. Key contributors to market growth include China and India, where the demand for EMV technology is high due to the large number of retail outlets and the importance of information management for merchants. Additionally, the presence of a vast number of unorganized retailers in APAC presents an opportunity for market expansion and increased adoption of EMV POS terminals. The hospitality, retail, healthcare, and transportation industries are major sectors driving the demand for EMV POS terminals in APAC.
These terminals offer security benefits, including protection against transactional and card present fraud, and support for contactless payment options and payment processing platforms making them a preferred choice for businesses and consumers alike. The market is also witnessing the integration of NFC technology, tokenization, cloud-based solutions, and virtual terminals to enhance security and convenience.
Market Dynamics
Our researchers analyzed the data with 2023 as the base year, along with the key drivers, trends, and challenges. A holistic analysis of drivers will help companies refine their marketing strategies to gain a competitive advantage.
What are the key market drivers leading to the rise In the adoption of EMV POS Terminals Industry?
- Increasing volume of e-commerce transactions spurring use of mPOS terminals is the key driver of the market.The EMV POS terminal market is experiencing significant growth due to the increasing adoption of digital payment methods and the rise of e-commerce transactions. EMV technology, which includes chip cards and microchip-enabled transactions, offers enhanced security benefits against fraudsters attempting to clone sensitive card data. Payment networks, such as Europay, Mastercard, and Visa, are promoting the use of EMV technology to mitigate fraud liability. The retail and hospitality sectors, including small businesses, are integrating EMV POS terminals for secure payment methods and convenient transaction processing. The market is also witnessing the emergence of portable countertops, mPOS, smart POS, and cloud-based solutions, enabling businesses to accept various payment methods, including NFC technology and cryptocurrency.
The increasing prevalence of transactional and card present fraud necessitates the adoption of EMV technology to ensure secure payment processing. The market is also addressing compatibility issues and cybersecurity risks through tokenization, integrated software solutions, virtual terminals, and authentication mechanisms. The projection timeframe indicates continued growth as businesses seek to provide secure and convenient payment options for their customers, enabling omnichannel integration and inventory management. The e-commerce sector, in particular, is expected to benefit significantly from the adoption of EMV POS terminals, ensuring secure processing of sensitive information for digital transactions.
What are the market trends shaping the EMV POS Terminals market?
- Use of magnetic secure transmission (MST) technology by mobile phone OEMs is the upcoming market trend.EMV technology, implemented through chip cards and microchips, enhances payment security by generating a unique transaction code for each purchase. This code prevents fraudsters from cloning sensitive card data. Both Europay, Mastercard, and Visa have implemented EMV technology to minimize fraud liability. The security benefits extend to portable countertop terminals, pin pad interfaces, mPOS solutions, smart POS terminals, and virtual terminals. These solutions are widely used in retail, hospitality, healthcare, and e-commerce sectors. Fraudsters continue to target transactional and card present fraud, leading to regulatory changes and cybersecurity risks. To address these concerns, integrated software solutions and cloud-based platforms offer tokenization and omnichannel integration.
Contactless payment options, such as mobile wallet technology and NFC technology, also provide secure and convenient payment methods. Compatibility issues with cryptocurrency acceptance and the projection timeframe for widespread adoption remain ongoing concerns. However, the retail sector, including small businesses, is increasingly adopting EMV POS terminals for secure payment methods. The hospitality segment, including international hotel chains and online reservations, also benefits from the convenience and portability of these terminals. In summary, EMV POS terminals offer enhanced security, convenience, and compatibility with various payment methods and industries. As the market continues to evolve, businesses can look forward to secure and efficient payment processing solutions.
What challenges does the EMV POS Terminals Industry face during its growth?
- Growing number of online transactions is a key challenge affecting the industry growth.EMV POS terminals, which utilize Europay, Mastercard, and Visa (EMV) technology, have become essential for businesses accepting card payments due to the enhanced security benefits they offer. Chip cards, featuring a microchip and a transaction code, provide greater protection against fraudsters attempting to clone sensitive card data. This technology shifts fraud liability from merchants to banks in case of counterfeit card use. Retail and hospitality industries, including physical stores and international hotel chains, heavily rely on EMV POS terminals for secure payment methods. These terminals are available in various forms, such as portable countertops, smart POS, MPOS solutions, and virtual terminals.
The retail sector, particularly small businesses, has seen a significant shift towards EMV technology as it offers secure transaction processing and convenient payment methods for customers. The hospitality segment, including restaurants and bars, has also adopted EMV POS terminals for their omnichannel integration, allowing for seamless transactions during online reservations and e-commerce sectors. Moreover, EMV POS terminals support contactless payment options, digital payments, and mobile wallet technology, making transactions more convenient for consumers. However, compatibility issues and cybersecurity risks are concerns for businesses adopting these technologies. Regulatory changes may also impact the market dynamics, driving companies to provide integrated software solutions and cloud-based services to meet the evolving needs of businesses.
In summary, EMV POS terminals play a crucial role in securing payment transactions and providing convenient payment methods for businesses across various industries, including retail, hospitality, healthcare, transportation, and entertainment. The market is expected to grow as businesses continue to prioritize secure and convenient payment options for their customers.
Exclusive Customer Landscape
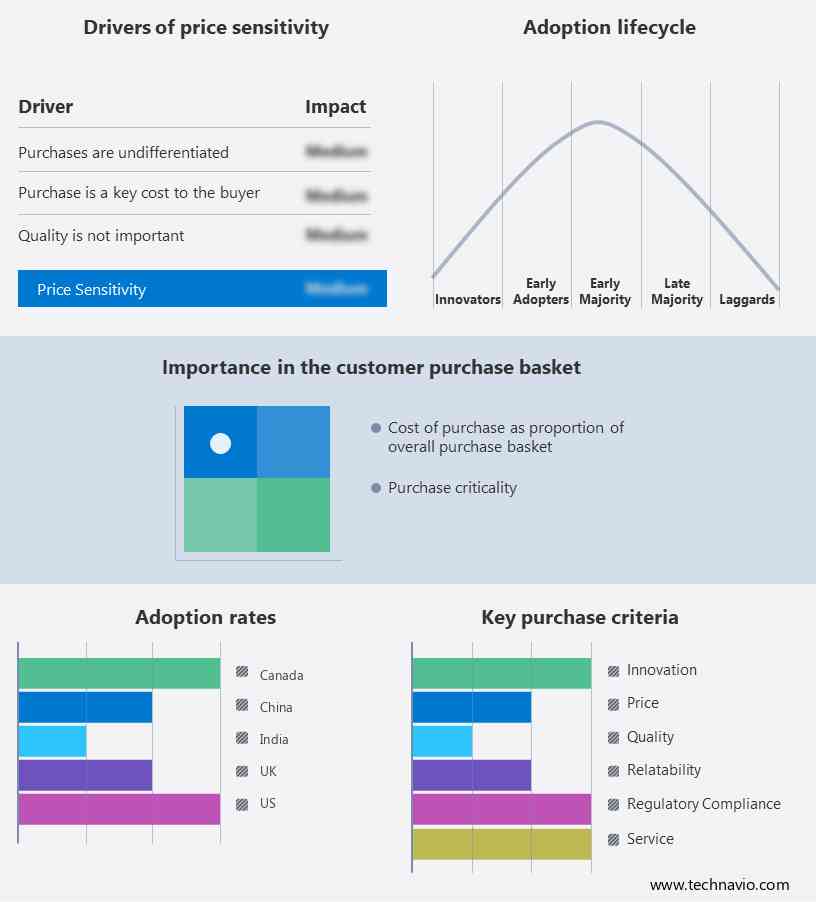
The emv pos terminals market forecasting report includes the adoption lifecycle of the market, covering from the innovator's stage to the laggard's stage. It focuses on adoption rates in different regions based on penetration. Furthermore, the emv pos terminals market report also includes key purchase criteria and drivers of price sensitivity to help companies evaluate and develop their market growth analysis strategies.
Customer Landscape
Key Companies & Market Insights
Companies are implementing various strategies, such as strategic alliances, emv pos terminals market forecast, partnerships, mergers and acquisitions, geographical expansion, and product/service launches, to enhance their presence In the industry.
BBPOS International Ltd. - The BBPOS WisePOS E EMV POS terminal is a cutting-edge solution In the market, providing merchants with secure and efficient payment processing capabilities. This terminal adheres to the EMV chip card standard, ensuring enhanced security against fraudulent transactions.
The industry research and growth report includes detailed analyses of the competitive landscape of the market and information about key companies, including:
- BBPOS International Ltd.
- Block Inc.
- Bluebird Inc.
- Brookfield Equinox LLC
- Cantaloupe Inc
- DATECS Ltd.
- Diebold Nixdorf Inc.
- Global Payments Inc.
- NCR Corp.
- NEC Corp.
- Newland Digital Technology Co. Ltd.
- Panasonic Holdings Corp.
- PAX Global Technology Ltd.
- Shenzhen Xinguodu Technology Co. Ltd.
- Telepower Communication Co. Ltd.
- Toshiba Corp.
- U.S. Bancorp
- UIC Payworld Inc.
- VeriFone Inc.
- Worldline SA
Qualitative and quantitative analysis of companies has been conducted to help clients understand the wider business environment as well as the strengths and weaknesses of key industry players. Data is qualitatively analyzed to categorize companies as pure play, category-focused, industry-focused, and diversified; it is quantitatively analyzed to categorize companies as dominant, leading, strong, tentative, and weak.
Research Analyst Overview
The EMV pos terminal market encompasses a range of technologies designed to facilitate secure and efficient payment transactions. These terminals utilize chip technology, which offers enhanced security features compared to traditional magnetic stripe cards. The Europay, Mastercard, and Visa (EMV) standard sets the protocol for these chip cards, ensuring interoperability and security. The adoption of EMV pos terminals has gained momentum due to the security benefits they provide. The microchip In these terminals generates a unique transaction code for each transaction, making it difficult for fraudsters to clone sensitive card data. Moreover, EMV pos terminals offer fraud liability shifts, incentivizing merchants to invest In these systems and reducing the burden of fraudulent transactions on payment networks.
EMV pos terminals cater to various industries, including retail, hospitality, healthcare, and transportation. In retail, these terminals facilitate seamless transactions, enabling merchants to manage sales data and inventory more effectively. In the hospitality sector, international hotel chains and smaller establishments alike have adopted EMV pos terminals for their online reservation systems and physical point-of-sale (POS) interfaces. The EMV pos terminal market offers a range of solutions to cater to diverse business needs. Portable countertop terminals provide flexibility and convenience for small businesses, while smart POS systems offer advanced features such as integrated software solutions and cloud-based services. Virtual terminals enable merchants to process transactions online, while MPOS solutions allow for mobile payments and omnichannel integration.
Cryptocurrency acceptance is an emerging trend In the EMV pos terminal market. These terminals enable merchants to accept digital payments, catering to the growing demand for convenient and secure payment methods. Despite the numerous benefits, the EMV pos terminal market faces challenges. Compatibility issues between different systems and cybersecurity risks pose threats to the security of sensitive transactional information. Regulatory changes and evolving consumer preferences also impact market dynamics. The hospitality segment has seen significant growth In the adoption of EMV pos terminals, driven by the need for secure and convenient payment methods. NFC technology integration enables contactless payment options, enhancing the customer experience.
The retail sector has also witnessed a shift towards EMV pos terminals, driven by the need for secure and efficient payment processing. The e-commerce sector's growth has further fueled the demand for secure payment methods, leading to the adoption of EMV pos terminals for online shopping and mobile wallet technology. In conclusion, the EMV pos terminal market offers a range of solutions to cater to diverse business needs, enabling secure and efficient payment transactions across various industries. Despite challenges, the market continues to grow, driven by the need for secure and convenient payment methods and regulatory requirements.
|
Market Scope |
|
|
Report Coverage |
Details |
|
Page number |
165 |
|
Base year |
2023 |
|
Historic period |
2018-2022 |
|
Forecast period |
2024-2028 |
|
Growth momentum & CAGR |
Accelerate at a CAGR of 10.22% |
|
Market growth 2024-2028 |
USD 6406.87 million |
|
Market structure |
Fragmented |
|
YoY growth 2023-2024(%) |
8.62 |
|
Key countries |
US, Canada, China, India, and UK |
|
Competitive landscape |
Leading Companies, Market Positioning of Companies, Competitive Strategies, and Industry Risks |
What are the Key Data Covered in this EMV POS Terminals Market Research and Growth Report?
- CAGR of the EMV POS Terminals industry during the forecast period
- Detailed information on factors that will drive the growth and forecasting between 2024 and 2028
- Precise estimation of the size of the market and its contribution of the industry in focus to the parent market
- Accurate predictions about upcoming growth and trends and changes in consumer behaviour
- Growth of the market across APAC, North America, Europe, South America, and Middle East and Africa
- Thorough analysis of the market's competitive landscape and detailed information about companies
- Comprehensive analysis of factors that will challenge the emv pos terminals market growth of industry companies
We can help! Our analysts can customize this emv pos terminals market research report to meet your requirements.
 RIA -
RIA - 
