North America Energy Bar Market Size 2024-2028
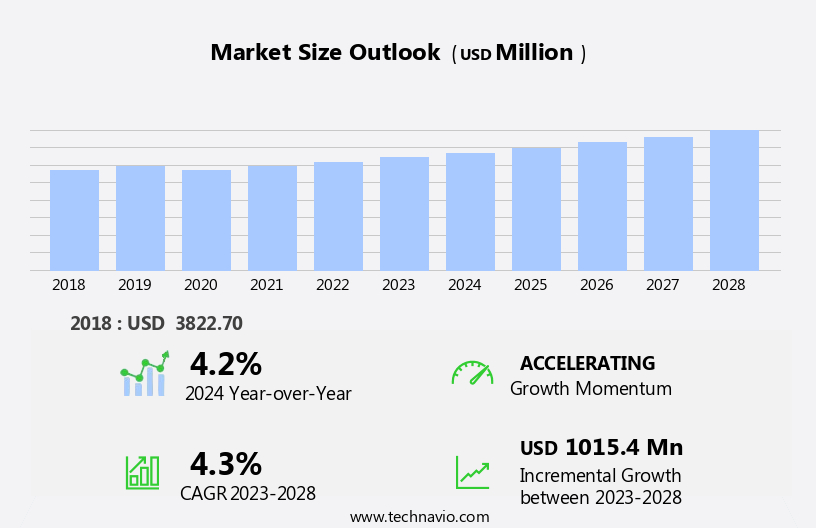
North America energy bar market size is forecast to increase by USD 1.02 billion billion at a CAGR of 4.3% between 2023 and 2028.
- The market is experiencing significant growth, driven by the increasing demand for convenient and nutritious sports and nutrition solutions. With consumers prioritizing active lifestyles and healthier food choices, energy bars have become a popular option for on-the-go sustenance. Additionally, the sales of energy bars through online retailing channels are on the rise, making these products more accessible than ever before. However, the market faces challenges from the easy availability of substitutes, such as protein bars and other energy-dense snacks.
- As the market continues to evolve, players must innovate to differentiate their offerings and meet the unique needs of various consumer segments. Stay tuned for a comprehensive analysis of these trends and more in our Market Trends and Analysis report.
What will be the size of the North America Energy Bar Market during the forecast period?

Request Free Sample
- In the dynamic North American energy bar market, supply chain optimization plays a crucial role in ensuring efficient manufacturing processes. Manufacturing equipment is continually evolving to meet the demand for high-quality, ethical sourcing of ingredients. Packaging design, with its focus on transparency and sustainability, is a key trend, as consumers increasingly demand ingredient traceability. Sales data analysis and customer feedback are integral to new product development, with health claims and nutritional information driving consumer interest. Product testing and quality assurance are essential to maintaining brand awareness and adhering to food safety regulations. Marketing campaigns and advertising strategies leverage promotional materials to reach consumers directly, while ethical sourcing and sustainability initiatives resonate with environmentally-conscious buyers.
- The distribution network, encompassing wholesale and e-commerce sales, is a critical component of a successful pricing model. Ingredient suppliers and distribution partners collaborate to optimize the product lifecycle, with direct-to-consumer sales and retail distribution channels complementing one another. Brand awareness and consumer research inform ingredient choices and product testing, shaping the competitive landscape and driving innovation in the energy bar market.
How is this market segmented and which is the largest segment?
The market research report provides comprehensive data (region-wise segment analysis), with forecasts and estimates in "USD million" for the period 2024-2028, as well as historical data from 2018-2022 for the following segments.
- Distribution Channel
- Type
- Protein Bars
- Nutrition Bars
- Meal Replacement Bars
- Others
- End-User
- Athletes
- Health-Conscious Consumers
- General Consumers
- Flavor
- Chocolate
- Fruit
- Nut-Based
- Others
- Geography
By Distribution Channel Insights
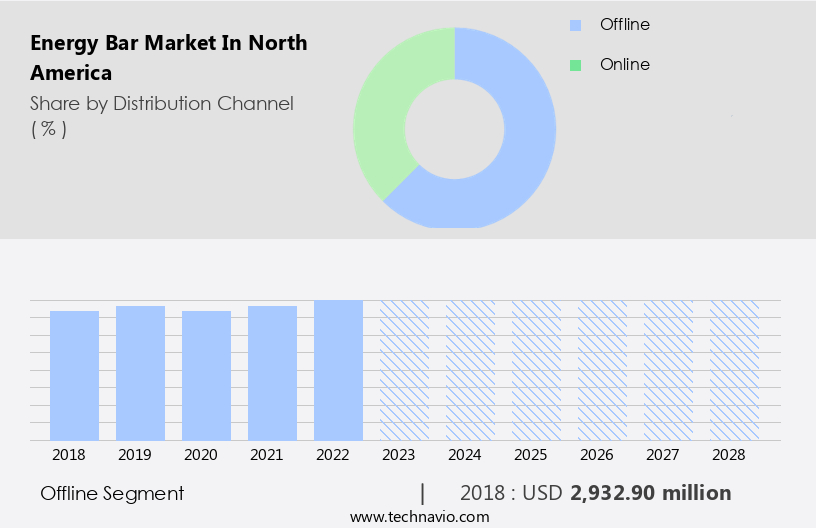
- The offline segment is estimated to witness significant growth during the forecast period.
In the North American market, energy bars continue to gain popularity due to their nutritional value claims, with organic certification and vegan formulations catering to diverse consumer preferences. Flavor profile development and ingredient sourcing are key focus areas for manufacturers to differentiate their offerings. Production efficiency and food safety standards are essential for maintaining competitiveness, while cost analysis models help optimize pricing strategies. Competitor benchmarking and quality control metrics ensure product consistency and customer satisfaction. Gluten-free options and high-protein formulations cater to specific consumer segments. Product diversification, including protein bars and low-sugar options, broadens market reach. Functional ingredients, such as vitamins and minerals, enhance product appeal.
Distribution channels, including supermarkets, hypermarkets, convenience stores, and discount stores, play a significant role in energy bar sales. Supermarkets and hypermarkets, with their wide product offerings and competitive pricing, dominate the market. Consumer preference data informs marketing strategies and brand positioning. Texture optimization and product innovation keep the market dynamic. Regulatory compliance, sales performance tracking, and supply chain management are crucial for maintaining a competitive edge. Shelf life extension and promotional campaigns further boost sales. Overall, the market is characterized by continuous innovation, consumer-centric strategies, and a focus on operational efficiency.

Get a glance at the market share of various segments Request Free Sample
The Offline segment was valued at USD 2932.90 million in 2018 and showed a gradual increase during the forecast period.
Market Dynamics
Our researchers analyzed the data with 2023 as the base year, along with the key drivers, trends, and challenges. A holistic analysis of drivers will help companies refine their marketing strategies to gain a competitive advantage.
What are the key market drivers leading to the rise in adoption of North America Energy Bar Market?
- Increasing demand for sports nutrition is the key driver of the market. The North American energy bar market is experiencing notable growth due to the expanding consumer base, comprised of professional athletes and fitness enthusiasts. These consumers seek nutritionally balanced foods, including carbohydrates, protein, healthy fats, vitamins, and minerals, to meet their energy demands. Energy bars, alongside shakes and other supplements, are popular choices for enriched and fortified food intake. The market demographic is evolving, with a shift from core and casual users to lifestyle users. Core users are professional athletes, while casual users are recreational athletes. To cater to this market, energy bar manufacturers focus on various aspects such as nutritional value claims, organic certification, flavor profile development, ingredient sourcing, and vegan formulations.
- Cost analysis models and food safety standards are essential for production efficiency. Ingredient sourcing involves selecting high-quality, natural, and sustainable ingredients to meet the evolving consumer preferences. Additionally, manufacturers prioritize vegan formulations to cater to the increasing demand for plant-based products. The market's future growth is expected to be driven by these trends and the ongoing consumer focus on health and wellness.
What are the market trends shaping the North America Energy Bar Market?
- Increasing sales of energy bars through online retailing is the upcoming trend in the market.The online market for packaged nutritional foods, including energy bars, in North America is experiencing significant growth. Factors such as the increasing urban population, growing millennial demographic, and rising disposable income are key drivers. The online grocery channel's sales value is increasing due to the elimination of supply chain intermediaries. Energy bars are a popular choice among consumers, with both pure-play online retailers and traditional food retailers' websites seeing increased sales. The proliferation of mobile users and their use of health and wellness apps, trackers, and wearables is also crucial to the online sale of energy bars. Modern consumers, particularly fitness enthusiasts, value convenience when purchasing nutritional foods.
- Nutrient content labeling, functional ingredients, and texture optimization are essential considerations for brands seeking to differentiate themselves. Pricing strategies and consumer segmentation are also critical elements in brand positioning. Product innovation, including low-sugar options, is essential to cater to evolving consumer preferences.
What challenges does North America Energy Bar Market face during the growth?
Easy availability of substitutes is a key challenge affecting the market growth.
- Energy bars continue to be a popular choice for individuals seeking a quick energy boost, particularly among those engaged in physical activities and outdoor pursuits. However, the market faces competition from alternative snack bars, such as protein bars, cereal bars, and granola bars. Consumers increasingly demand functional and convenient foods, prioritizing taste, wholesome ingredients, and organic materials. Yet, energy bars often contain higher sugar content than their counterparts, leading to concerns. Transparency regarding ingredient composition is crucial for consumer satisfaction, with many seeking high-protein options and gluten-free alternatives.
- Product diversification is essential for companies to cater to these preferences, ensuring quality control metrics are met. Effective competitor benchmarking and understanding consumer preference data are vital for success in this dynamic market. Distribution channels also play a significant role in reaching the target audience effectively.
Exclusive North America Energy Bar Market Customer Landscape
The market forecasting report includes the adoption lifecycle of the market, covering from the innovator's stage to the laggard's stage. It focuses on adoption rates in different regions based on penetration. Furthermore, the report also includes key purchase criteria and drivers of price sensitivity to help companies evaluate and develop their market growth analysis strategies.
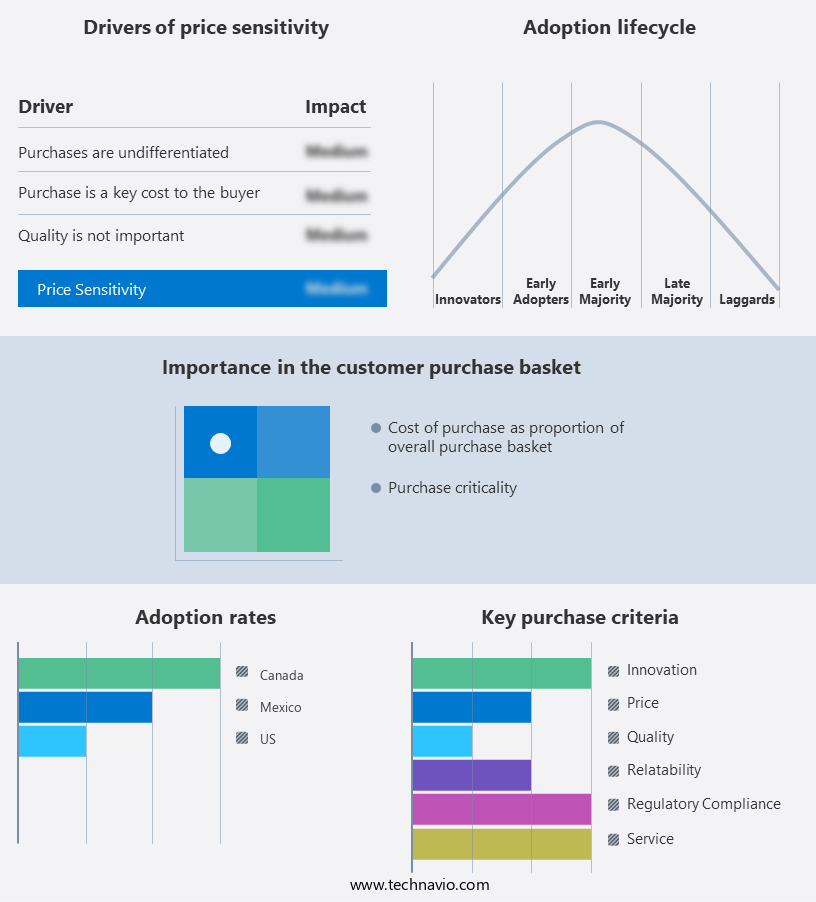
Customer Landscape
Key Companies & Market Insights
Companies are implementing various strategies, such as strategic alliances, market forecast partnerships, mergers and acquisitions, geographical expansion, and product/service launches, to enhance their presence in the market.
The market research and growth report includes detailed analyses of the competitive landscape of the market and information about key companies, including:
- Abbott Laboratories
- Amrita Health Foods
- Bearded Brothers LLC
- Caveman Foods
- Clif Bar and Co.
- Empact Bars LLC
- Garuka Bars
- General Mills Inc.
- Hormel Foods Corp.
- Kellogg Co.
- Mars Inc.
- McKee Foods
- Mondelez International Inc.
- Nestle SA
- NuGo Nutrition
- PepsiCo Inc.
- Post Holdings Inc.
- PROBAR Inc.
- The Hershey Co.
- The Simply Good Foods Co.
Qualitative and quantitative analysis of companies has been conducted to help clients understand the wider business environment as well as the strengths and weaknesses of key market players. Data is qualitatively analyzed to categorize companies as pure play, category-focused, industry-focused, and diversified; it is quantitatively analyzed to categorize companies as dominant, leading, strong, tentative, and weak.
Research Analyst Overview
The market continues to evolve, driven by consumer preferences for convenient, nutritious, and sustainable food options. Nutritional value claims, such as high protein, low sugar, and gluten-free, are increasingly important, leading to the development of vegan formulations and organic certification. Flavor profile development and ingredient sourcing are key areas of focus, with a trend towards functional ingredients and locally-sourced materials. Cost analysis models are essential for energy bar manufacturers, balancing production efficiency and ingredient costs. Food safety standards and regulatory compliance are non-negotiable, with ongoing efforts to improve quality control metrics and production processes. Competitor benchmarking and consumer preference data inform pricing strategies and brand positioning.
Texture optimization and product innovation are crucial for differentiating offerings in a crowded market. Product diversification, including protein bar formulations and low-sugar options, cater to various consumer segments. Shelf life extension and promotional campaigns are effective marketing tools, while distribution channels and nutrient content labeling ensure transparency and customer satisfaction. Regulatory compliance, sales performance tracking, and supply chain management are critical aspects of the energy bar market's ongoing dynamism. The bar manufacturing process is continually refined to meet evolving consumer demands and industry standards, ensuring the production of high-quality, nutritious, and sustainable energy bars.
|
Market Scope
|
|
Report Coverage
|
Details
|
|
Page number
|
137
|
|
Base year
|
2023
|
|
Historic period
|
2018-2022 |
|
Forecast period
|
2024-2028
|
|
Growth momentum & CAGR
|
Accelerate at a CAGR of 4.3%
|
|
Market growth 2024-2028
|
USD 1015.4 million
|
|
Market structure
|
Fragmented
|
|
YoY growth 2023-2024(%)
|
4.2
|
|
Competitive landscape
|
Leading Companies, Market Positioning of Companies, Competitive Strategies, and Industry Risks
|
Request Free Sample
What are the Key Data Covered in this Market Research Report?
- CAGR of the market during the forecast period
- Detailed information on factors that will drive the market growth and forecasting between 2024 and 2028
- Precise estimation of the size of the market and its contribution of the market in focus to the parent market
- Accurate predictions about upcoming market growth and trends and changes in consumer behaviour
- Growth of the market across North America
- Thorough analysis of the market's competitive landscape and detailed information about companies
- Comprehensive analysis of factors that will challenge the growth of market companies
We can help! Our analysts can customize this market research report to meet your requirements Get in touch
1 Executive Summary
- 1.1 Market overview
- Executive Summary - Chart on Market Overview
- Executive Summary - Data Table on Market Overview
- Executive Summary - Chart on Country Market Characteristics
- Executive Summary - Chart on Market by Geography
- Executive Summary - Chart on Market Segmentation by Distribution Channel
- Executive Summary - Chart on Incremental Growth
- Executive Summary - Data Table on Incremental Growth
- Executive Summary - Chart on Company Market Positioning
2 Technavio Analysis
- 2.1 Analysis of price sensitivity, lifecycle, customer purchase basket, adoption rates, and purchase criteria
- Analysis of price sensitivity, lifecycle, customer purchase basket, adoption rates, and purchase criteria
- 2.2 Criticality of inputs and Factors of differentiation
- Overview on criticality of inputs and factors of differentiation
- 2.3 Factors of disruption
- Overview on factors of disruption
- 2.4 Impact of drivers and challenges
- Impact of drivers and challenges in 2023 and 2028
3 Market Landscape
- 3.1 Market ecosystem
- Parent Market
- Data Table on - Parent Market
- 3.2 Market characteristics
- Market characteristics analysis
4 Market Sizing
- 4.1 Market definition
- Offerings of companies included in the market definition
- 4.2 Market segment analysis
- 4.4 Market outlook: Forecast for 2023-2028
- Chart on North America - Market size and forecast 2023-2028 ($ million)
- Data Table on Regional - Market size and forecast 2023-2028 ($ million)
- Chart on North America: Year-over-year growth 2023-2028 (%)
- Data Table on Regional - Market size and forecast 2023-2028 ($ million)
5 Historic Market Size
- 5.1 Energy Bar Market in North America 2018 - 2022
- Historic Market Size - Data Table on Energy Bar Market in North America 2018 - 2022 ($ million)
- 5.2 Distribution Channel segment analysis 2018 - 2022
- Historic Market Size - Distribution Channel Segment 2018 - 2022 ($ million)
- 5.3 Geography segment analysis 2018 - 2022
- Historic Market Size - Geography Segment 2018 - 2022 ($ million)
6 Qualitative Analysis
- 6.1 The impact of AI in Energy Bar Market in North America
7 Five Forces Analysis
- 7.1 Five forces summary
- Five forces analysis - Comparison between 2023 and 2028
- 7.2 Bargaining power of buyers
- Bargaining power of buyers - Impact of key factors 2023 and 2028
- 7.3 Bargaining power of suppliers
- Bargaining power of suppliers - Impact of key factors in 2023 and 2028
- 7.4 Threat of new entrants
- Threat of new entrants - Impact of key factors in 2023 and 2028
- 7.5 Threat of substitutes
- Threat of substitutes - Impact of key factors in 2023 and 2028
- 7.6 Threat of rivalry
- Threat of rivalry - Impact of key factors in 2023 and 2028
- 7.7 Market condition
- Chart on Market condition - Five forces 2023 and 2028
8 Market Segmentation by Distribution Channel
- 8.1 Market segments
- Chart on Distribution Channel - Market share (2023-2028) (%)
- Data Table on Distribution Channel - Market share (2023-2028) (%)
- 8.2 Comparison by Distribution Channel
- Chart on Comparison by Distribution Channel
- Data Table on Comparison by Distribution Channel
- 8.3 Offline - Market size and forecast (2023-2028)
- Chart on Offline - Market size and forecast (2023-2028) ($ million)
- Data Table on Offline - Market size and forecast (2023-2028) ($ million)
- Chart on Offline - Year-over-year growth (2023-2028) (%)
- Data Table on Offline - Year-over-year growth (2023-2028) (%)
- 8.4 Online - Market size and forecast (2023-2028)
- Chart on Online - Market size and forecast (2023-2028) ($ million)
- Data Table on Online - Market size and forecast (2023-2028) ($ million)
- Chart on Online - Year-over-year growth (2023-2028) (%)
- Data Table on Online - Year-over-year growth (2023-2028) (%)
- 8.5 Market opportunity by Distribution Channel
- Market opportunity by Distribution Channel ($ million)
- Data Table on Market opportunity by Distribution Channel ($ million)
9 Market Segmentation by Type
- 9.1 Market segments
- Chart on Type - Market share (2023-2028) (%)
- Data Table on Type - Market share (2023-2028) (%)
- 9.2 Comparison by Type
- Chart on Comparison by Type
- Data Table on Comparison by Type
- 9.3 Protein Bars - Market size and forecast (2023-2028)
- Chart on Protein Bars - Market size and forecast (2023-2028) ($ million)
- Data Table on Protein Bars - Market size and forecast (2023-2028) ($ million)
- Chart on Protein Bars - Year-over-year growth (2023-2028) (%)
- Data Table on Protein Bars - Year-over-year growth (2023-2028) (%)
- 9.4 Nutrition Bars - Market size and forecast (2023-2028)
- Chart on Nutrition Bars - Market size and forecast (2023-2028) ($ million)
- Data Table on Nutrition Bars - Market size and forecast (2023-2028) ($ million)
- Chart on Nutrition Bars - Year-over-year growth (2023-2028) (%)
- Data Table on Nutrition Bars - Year-over-year growth (2023-2028) (%)
- 9.5 Meal Replacement Bars - Market size and forecast (2023-2028)
- Chart on Meal Replacement Bars - Market size and forecast (2023-2028) ($ million)
- Data Table on Meal Replacement Bars - Market size and forecast (2023-2028) ($ million)
- Chart on Meal Replacement Bars - Year-over-year growth (2023-2028) (%)
- Data Table on Meal Replacement Bars - Year-over-year growth (2023-2028) (%)
- 9.6 Others - Market size and forecast (2023-2028)
- Chart on Others - Market size and forecast (2023-2028) ($ million)
- Data Table on Others - Market size and forecast (2023-2028) ($ million)
- Chart on Others - Year-over-year growth (2023-2028) (%)
- Data Table on Others - Year-over-year growth (2023-2028) (%)
- 9.7 Market opportunity by Type
- Market opportunity by Type ($ million)
- Data Table on Market opportunity by Type ($ million)
10 Market Segmentation by End-User
- 10.1 Market segments
- Chart on End-User - Market share (2023-2028) (%)
- Data Table on End-User - Market share (2023-2028) (%)
- 10.2 Comparison by End-User
- Chart on Comparison by End-User
- Data Table on Comparison by End-User
- 10.3 Athletes - Market size and forecast (2023-2028)
- Chart on Athletes - Market size and forecast (2023-2028) ($ million)
- Data Table on Athletes - Market size and forecast (2023-2028) ($ million)
- Chart on Athletes - Year-over-year growth (2023-2028) (%)
- Data Table on Athletes - Year-over-year growth (2023-2028) (%)
- 10.4 Health-Conscious Consumers - Market size and forecast (2023-2028)
- Chart on Health-Conscious Consumers - Market size and forecast (2023-2028) ($ million)
- Data Table on Health-Conscious Consumers - Market size and forecast (2023-2028) ($ million)
- Chart on Health-Conscious Consumers - Year-over-year growth (2023-2028) (%)
- Data Table on Health-Conscious Consumers - Year-over-year growth (2023-2028) (%)
- 10.5 General Consumers - Market size and forecast (2023-2028)
- Chart on General Consumers - Market size and forecast (2023-2028) ($ million)
- Data Table on General Consumers - Market size and forecast (2023-2028) ($ million)
- Chart on General Consumers - Year-over-year growth (2023-2028) (%)
- Data Table on General Consumers - Year-over-year growth (2023-2028) (%)
- 10.6 Market opportunity by End-User
- Market opportunity by End-User ($ million)
- Data Table on Market opportunity by End-User ($ million)
11 Market Segmentation by Flavor
- 11.1 Market segments
- Chart on Flavor - Market share (2023-2028) (%)
- Data Table on Flavor - Market share (2023-2028) (%)
- 11.2 Comparison by Flavor
- Chart on Comparison by Flavor
- Data Table on Comparison by Flavor
- 11.3 Chocolate - Market size and forecast (2023-2028)
- Chart on Chocolate - Market size and forecast (2023-2028) ($ million)
- Data Table on Chocolate - Market size and forecast (2023-2028) ($ million)
- Chart on Chocolate - Year-over-year growth (2023-2028) (%)
- Data Table on Chocolate - Year-over-year growth (2023-2028) (%)
- 11.4 Fruit - Market size and forecast (2023-2028)
- Chart on Fruit - Market size and forecast (2023-2028) ($ million)
- Data Table on Fruit - Market size and forecast (2023-2028) ($ million)
- Chart on Fruit - Year-over-year growth (2023-2028) (%)
- Data Table on Fruit - Year-over-year growth (2023-2028) (%)
- 11.5 Nut-Based - Market size and forecast (2023-2028)
- Chart on Nut-Based - Market size and forecast (2023-2028) ($ million)
- Data Table on Nut-Based - Market size and forecast (2023-2028) ($ million)
- Chart on Nut-Based - Year-over-year growth (2023-2028) (%)
- Data Table on Nut-Based - Year-over-year growth (2023-2028) (%)
- 11.6 Others - Market size and forecast (2023-2028)
- Chart on Others - Market size and forecast (2023-2028) ($ million)
- Data Table on Others - Market size and forecast (2023-2028) ($ million)
- Chart on Others - Year-over-year growth (2023-2028) (%)
- Data Table on Others - Year-over-year growth (2023-2028) (%)
- 11.7 Market opportunity by Flavor
- Market opportunity by Flavor ($ million)
- Data Table on Market opportunity by Flavor ($ million)
12 Customer Landscape
- 12.1 Customer landscape overview
- Analysis of price sensitivity, lifecycle, customer purchase basket, adoption rates, and purchase criteria
13 Geographic Landscape
- 13.1 Geographic segmentation
- Chart on Market share by geography - 2023-2028 (%)
- Data Table on Market share by geography - 2023-2028 (%)
- 13.2 Geographic comparison
- Chart on Geographic comparison
- Data Table on Geographic comparison
- 13.3 US - Market size and forecast 2023-2028
- Chart on US - Market size and forecast 2023-2028 ($ million)
- Data Table on US - Market size and forecast 2023-2028 ($ million)
- Chart on US - Year-over-year growth 2023-2028 (%)
- Data Table on US - Year-over-year growth 2023-2028 (%)
- 13.4 Canada - Market size and forecast 2023-2028
- Chart on Canada - Market size and forecast 2023-2028 ($ million)
- Data Table on Canada - Market size and forecast 2023-2028 ($ million)
- Chart on Canada - Year-over-year growth 2023-2028 (%)
- Data Table on Canada - Year-over-year growth 2023-2028 (%)
- 13.5 Mexico - Market size and forecast 2023-2028
- Chart on Mexico - Market size and forecast 2023-2028 ($ million)
- Data Table on Mexico - Market size and forecast 2023-2028 ($ million)
- Chart on Mexico - Year-over-year growth 2023-2028 (%)
- Data Table on Mexico - Year-over-year growth 2023-2028 (%)
- 13.6 Market opportunity by geography
- Market opportunity by geography ($ million)
- Data Table on Market opportunity by geography ($ million)
14 Drivers, Challenges, and Opportunity/Restraints
- 14.3 Impact of drivers and challenges
- Impact of drivers and challenges in 2023 and 2028
- 14.4 Market opportunities/restraints
15 Competitive Landscape
- 15.2 Competitive Landscape
- Overview on criticality of inputs and factors of differentiation
- 15.3 Landscape disruption
- Overview on factors of disruption
- 15.4 Industry risks
- Impact of key risks on business
16 Competitive Analysis
- 16.2 Company ranking index
- 16.3 Market positioning of companies
- Matrix on companies position and classification
- 16.4 Clif Bar and Co.
- Clif Bar and Co. - Overview
- Clif Bar and Co. - Product / Service
- Clif Bar and Co. - Key offerings
- SWOT
- 16.5 General Mills Inc.
- General Mills Inc. - Overview
- General Mills Inc. - Business segments
- General Mills Inc. - Key news
- General Mills Inc. - Key offerings
- General Mills Inc. - Segment focus
- SWOT
- 16.6 Kellogg Co.
- Kellogg Co. - Overview
- Kellogg Co. - Business segments
- Kellogg Co. - Key news
- Kellogg Co. - Key offerings
- Kellogg Co. - Segment focus
- SWOT
- 16.7 Mars Inc.
- Mars Inc. - Overview
- Mars Inc. - Product / Service
- Mars Inc. - Key news
- Mars Inc. - Key offerings
- SWOT
- 16.8 McKee Foods
- McKee Foods - Overview
- McKee Foods - Product / Service
- McKee Foods - Key news
- McKee Foods - Key offerings
- SWOT
- 16.9 NuGo Nutrition
- NuGo Nutrition - Overview
- NuGo Nutrition - Product / Service
- NuGo Nutrition - Key offerings
- SWOT
- 16.10 PepsiCo Inc.
- PepsiCo Inc. - Overview
- PepsiCo Inc. - Business segments
- PepsiCo Inc. - Key news
- PepsiCo Inc. - Key offerings
- PepsiCo Inc. - Segment focus
- SWOT
- 16.11 Post Holdings Inc.
- Post Holdings Inc. - Overview
- Post Holdings Inc. - Business segments
- Post Holdings Inc. - Key news
- Post Holdings Inc. - Key offerings
- Post Holdings Inc. - Segment focus
- SWOT
- 16.12 PROBAR Inc.
- PROBAR Inc. - Overview
- PROBAR Inc. - Product / Service
- PROBAR Inc. - Key offerings
- SWOT
- 16.13 The Simply Good Foods Co.
- The Simply Good Foods Co. - Overview
- The Simply Good Foods Co. - Product / Service
- The Simply Good Foods Co. - Key offerings
- SWOT
17 Appendix
- 17.2 Inclusions and exclusions checklist
- Inclusions checklist
- Exclusions checklist
- 17.3 Currency conversion rates for US$
- Currency conversion rates for US$
- 17.4 Research methodology
- 17.7 Validation techniques employed for market sizing
- Validation techniques employed for market sizing
- 17.9 360 degree market analysis
- 360 degree market analysis
- 17.10 List of abbreviations
- List of abbreviations
- o Strong financial performance
Research Framework
Technavio presents a detailed picture of the market by way of study, synthesis, and summation of data from multiple sources. The analysts have presented the various facets of the market with a particular focus on identifying the key industry influencers. The data thus presented is comprehensive, reliable, and the result of extensive research, both primary and secondary.
INFORMATION SOURCES
Primary sources
- Manufacturers and suppliers
- Channel partners
- Industry experts
- Strategic decision makers
Secondary sources
- Industry journals and periodicals
- Government data
- Financial reports of key industry players
- Historical data
- Press releases

DATA ANALYSIS
Data Synthesis
- Collation of data
- Estimation of key figures
- Analysis of derived insights
Data Validation
- Triangulation with data models
- Reference against proprietary databases
- Corroboration with industry experts

REPORT WRITING
Qualitative
- Market drivers
- Market challenges
- Market trends
- Five forces analysis
Quantitative
- Market size and forecast
- Market segmentation
- Geographical insights
- Competitive landscape