Non Carbonated Soft Drinks Market Size 2025-2029
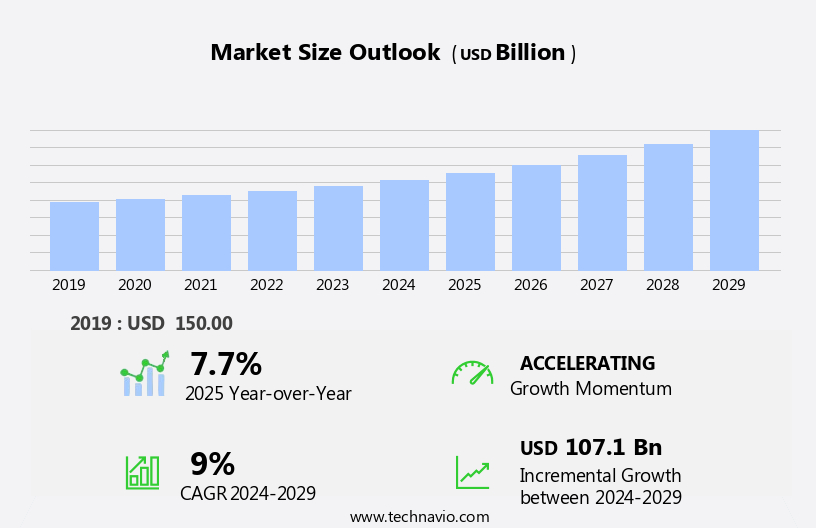
The non carbonated soft drinks market size is forecast to increase by USD 107.1 billion, at a CAGR of 9% between 2024 and 2029.
- The market is experiencing significant shifts driven by evolving consumer preferences and the digital transformation of the beverage industry. Health and wellness concerns are increasingly influencing consumer choices, leading to a surge in demand for non-carbonated options. This trend is further amplified by the easy accessibility of substitutes, such as fruit juices, sports drinks, and functional beverages, which cater to health-conscious consumers. Meanwhile, the online presence of non-carbonated soft drinks is growing rapidly, enabling brands to reach consumers directly and expand their market reach. However, this digital transformation also presents challenges, as companies face increased competition and the need to differentiate their offerings to stand out in a crowded market.
- Additionally, the availability of various substitutes puts pressure on prices and margins, requiring companies to innovate and adapt to remain competitive. To capitalize on opportunities and navigate challenges effectively, market players must focus on product innovation, digital marketing strategies, and competitive pricing.
What will be the Size of the Non Carbonated Soft Drinks Market during the forecast period?
Explore in-depth regional segment analysis with market size data - historical 2019-2023 and forecasts 2025-2029 - in the full report.
Request Free Sample
The non-carbonated soft drinks market continues to evolve, shaped by dynamic consumer preferences, industry trends, and technological advancements. Functional beverages, flavors, and extracts are increasingly popular, with a focus on natural and organic ingredients. Zero-sugar options and low-calorie alternatives are also gaining traction, driven by consumer health consciousness. Price sensitivity remains a significant factor, leading to various pricing strategies and distribution channels. Grocery stores and online retailers are major sales outlets, with sustainable packaging and recyclable materials becoming essential for brand loyalty. Innovation trends include plant-based beverages, ready-to-drink tea, and sustainable packaging. Digital marketing and social media campaigns are crucial for reaching consumers, while nutritional labeling and health claims are essential for transparency.
Sustainability trends, such as raw material sourcing and production processes, are essential for reducing environmental footprint. Beverage industry trends include refrigerated storage, energy drinks, and sports drinks. Manufacturing facilities prioritize quality control and innovation, ensuring product differentiation and consumer preferences are met. Ingredient sourcing and sustainability are key considerations, with a focus on organic and natural ingredients. Growth potential is significant, with new product launches and distribution channels continually emerging. Beverage industry trends, such as high-intensity sweeteners and carbonated water, offer opportunities for expansion. The non-carbonated soft drinks market is a continuously unfolding landscape, shaped by consumer trends, industry innovations, and evolving market dynamics.
How is this Non Carbonated Soft Drinks Industry segmented?
The non carbonated soft drinks industry research report provides comprehensive data (region-wise segment analysis), with forecasts and estimates in "USD billion" for the period 2025-2029, as well as historical data from 2019-2023 for the following segments.
- Product Type
- Fruit juices
- Sports drinks
- Distribution Channel
- Offline
- Online
- Packaging
- Bottles
- Cans
- Tetra packs
- Others
- Geography
- North America
- US
- Canada
- Europe
- France
- Germany
- Italy
- UK
- Middle East and Africa
- Egypt
- KSA
- Oman
- UAE
- APAC
- China
- India
- Japan
- South America
- Argentina
- Brazil
- Rest of World (ROW)
- North America
By Product Type Insights
The fruit juices segment is estimated to witness significant growth during the forecast period.
In the evolving non-carbonated soft drink market, quality assurance and ingredient transparency are paramount. Consumers increasingly demand natural and organic ingredients, leading to a preference for juices made from fresh fruits without preservatives, artificial flavors, or excessive sugar. This trend extends to ready-to-drink teas, bottled water, and plant-based beverages, which often boast no artificial colors or high-fructose corn syrup. Product innovation and differentiation are key marketing strategies, with low-calorie options, zero-sugar alternatives, and functional beverages gaining traction. Digital marketing and social media campaigns play a significant role in reaching consumers, while sustainable packaging and recyclable materials align with environmental consciousness.
Brand loyalty is a crucial factor, with consumers drawn to familiar names and trusted labels. Consumer preferences for long shelf life, convenience, and affordability influence sales in retail stores, convenience stores, and online retailers. Innovation trends include natural flavors, agave nectar, and high-intensity sweeteners, as well as flavors and extracts derived from fruits, coffee, and herbs. Manufacturing facilities prioritize food safety standards and production processes that minimize environmental footprint. Sales forecasts indicate continued growth potential for this market, driven by consumer trends and distribution channels that cater to diverse preferences.
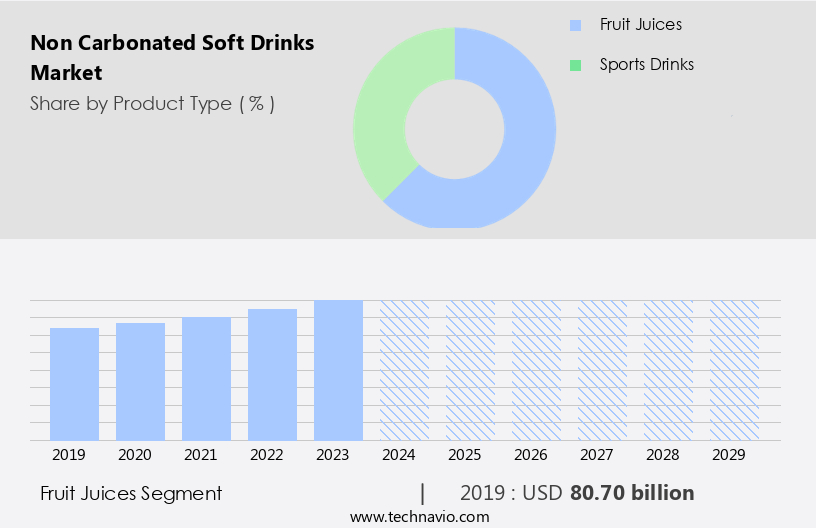
The Fruit juices segment was valued at USD 80.70 billion in 2019 and showed a gradual increase during the forecast period.
Regional Analysis
APAC is estimated to contribute 37% to the growth of the global market during the forecast period.Technavio’s analysts have elaborately explained the regional trends and drivers that shape the market during the forecast period.
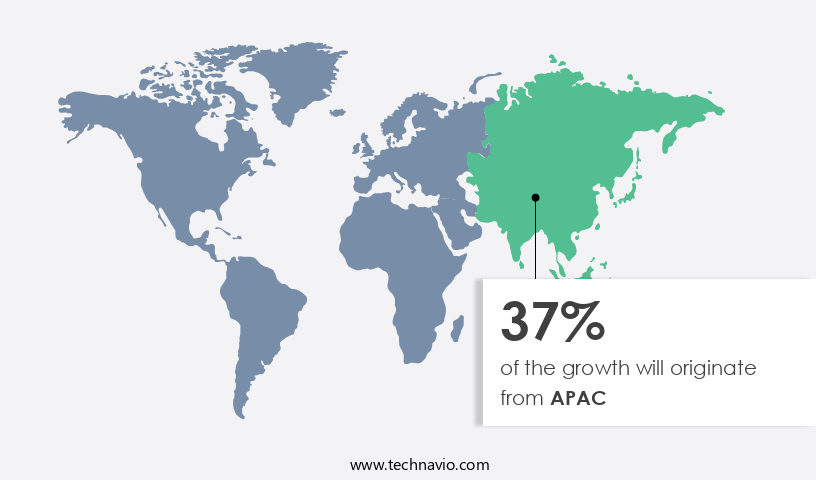
The non-carbonated soft drinks market is witnessing significant growth, particularly in the Asia Pacific (APAC) region. With increasing economic prosperity and a growing middle class in countries like China, India, Japan, and South Korea, consumer preferences are shifting towards healthier options. Non-carbonated beverages, including fruit juices, flavored water, and ready-to-drink teas, are gaining popularity due to their perceived health benefits. Quality assurance and ingredient transparency are crucial factors in this market. Brands are focusing on using natural flavors, organic ingredients, and recyclable materials in their packaging to cater to health-conscious consumers. Product differentiation is also a key marketing strategy, with brands offering low-calorie, zero-sugar, and functional beverage options.
Digital marketing and social media campaigns are essential tools for reaching consumers. Sales forecasts indicate continued growth in online retail sales, making it essential for brands to have a strong online presence. Sustainability trends, such as sustainable packaging and raw material sourcing, are also influencing consumer choices. Retail stores, including grocery stores and convenience stores, remain important distribution channels. Shelf life and refrigerated storage are critical considerations for these channels. Manufacturing facilities must adhere to strict food safety standards to ensure product quality and consumer safety. Product innovation is a major trend, with brands introducing new flavors, product lines, and packaging formats to differentiate themselves.
Energy drinks, sports drinks, and carbonated water are also gaining popularity. Pricing strategies, including discounts and promotions, are used to attract price-sensitive consumers. Innovation trends include the use of high-intensity sweeteners, plant-based beverages, and natural sweeteners like agave nectar. Health claims and functional benefits are also driving consumer interest. Brands must balance innovation with cost control and maintain quality control to meet consumer expectations. Overall, the non-carbonated soft drinks market is dynamic and evolving, with a focus on health, sustainability, and innovation. Brands that can effectively meet consumer preferences and expectations while maintaining quality and affordability will thrive in this competitive landscape.
Market Dynamics
Our researchers analyzed the data with 2024 as the base year, along with the key drivers, trends, and challenges. A holistic analysis of drivers will help companies refine their marketing strategies to gain a competitive advantage.
In the ever-evolving beverage landscape, the market continues to gain momentum. This segment caters to health-conscious consumers seeking refreshing alternatives to traditional carbonated beverages. Natural fruit juices, flavored waters, and plant-based drinks dominate the market, with innovative offerings such as herbal infusions, functional beverages, and coconut water gaining popularity. Brands prioritize sustainable sourcing, reducing sugar content, and offering on-trend flavors to meet consumer demands. Consumers increasingly seek out beverages with functional benefits, such as antioxidants, vitamins, and electrolytes, driving growth in the market. The market is a dynamic and competitive space, with innovation and consumer preferences shaping its future trajectory.
What are the key market drivers leading to the rise in the adoption of Non Carbonated Soft Drinks Industry?
- Consumers' growing focus on health and wellness is the primary factor fueling market expansion.
- Non-carbonated soft drinks, including natural juices, flavored water, and functional beverages, have gained popularity due to shifting consumer preferences towards healthier options. These beverages are perceived as more health-conscious alternatives to carbonated sodas, as they generally contain less added sugar. With increasing health consciousness, consumers are prioritizing weight management and adopting healthier eating habits, leading to a rise in demand for non-carbonated soft drinks. Flavor profiles are a significant factor in consumer preferences for these beverages. Plant-based beverages, such as almond milk and soy milk, are popular choices for those seeking natural and organic options. Low-calorie and sugar-free alternatives, sweetened with high-intensity sweeteners, cater to those looking to reduce calorie intake.
- Packaging formats, such as pet bottles and aluminum cans, are essential considerations for retailers. Social media marketing plays a crucial role in promoting these beverages, reaching a broad audience and generating buzz around new flavors and product innovations. Quality control is essential in the production and distribution of non-carbonated soft drinks to ensure freshness, taste, and safety. Innovation trends include the use of refrigerated storage and the incorporation of functional ingredients, such as vitamins and minerals, to enhance the health benefits of these beverages. Online retailers have made it easier for consumers to access a wide range of non-carbonated soft drink options, allowing for greater convenience and flexibility in purchasing.
- Despite the growing popularity of these healthier beverage choices, it is essential to maintain a balance and enjoy them as part of a balanced diet.
What are the market trends shaping the Non Carbonated Soft Drinks Industry?
- Non-carbonated soft drinks are gaining increased online presence, representing a notable market trend. This growing trend underscores the shifting consumer preference towards healthier beverage options.
- Non-carbonated soft drinks continue to gain popularity in the beverage industry due to consumer trends towards functional beverages and healthier options. Manufacturers respond by introducing a variety of flavors and extracts, including coffee beverages and zero-sugar alternatives. Health claims, such as natural flavors and the use of sweeteners like agave nectar, resonate with health-conscious consumers. Price sensitivity remains a factor, driving demand for recyclable materials and efficient ingredient sourcing. Organic ingredients and the use of natural sweeteners further cater to this market.
- The growth potential for non-carbonated soft drinks is significant, with distribution channels expanding beyond traditional retail to include e-commerce platforms. Artificial sweeteners remain a topic of debate, with some consumers preferring natural alternatives. Overall, the non-carbonated soft drink market is poised for continued growth, driven by consumer preferences and industry trends.
What challenges does the Non Carbonated Soft Drinks Industry face during its growth?
- The easy accessibility of substitutes, particularly non-carbonated beverages, poses a significant challenge to the expansion of the soft drink industry.
- Non-carbonated soft drinks face significant competition from various beverage alternatives, including sparkling water, unsweetened tea, and tap water. These substitutes offer consumers diverse choices, making it essential for non-carbonated soft drink brands to differentiate themselves. However, the pricing advantage of some substitutes, such as tap water or plain water, can pose a challenge for non-carbonated brands, potentially leading to reduced profit margins and market share. Additionally, some consumers may prefer the taste and carbonation of carbonated soft drinks, further impacting the market for non-carbonated beverages. Environmental footprint and raw material sourcing are critical factors influencing non-carbonated soft drink production processes.
- Brands are focusing on sustainable sourcing and reducing their carbon footprint to meet evolving consumer demands. Manufacturing facilities must adhere to stringent food safety standards to ensure product quality and consumer safety. Pricing strategies, product testing, and supply chain management are essential components of the non-carbonated soft drink market. Energy drinks, sports drinks, fruit juices, and sugar-free options cater to various consumer preferences. Brands are investing in research and development to introduce innovative flavors and healthier alternatives to attract consumers. The non-carbonated soft drink market encompasses a wide range of beverage categories, including bottled water, juice drinks, and ready-to-drink tea.
- Understanding consumer preferences, market trends, and competition dynamics is crucial for brands to succeed in this competitive landscape. Sales forecasts indicate steady growth for the non-carbonated soft drink market, driven by consumer demand for healthier and more sustainable beverage options.
Exclusive Customer Landscape
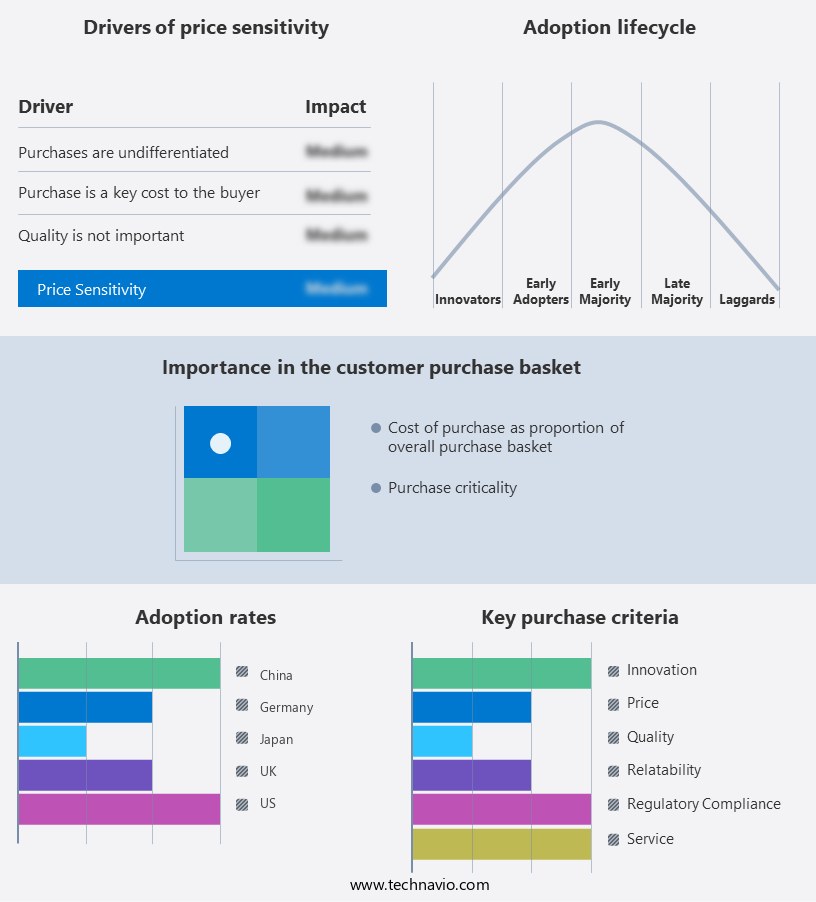
The non carbonated soft drinks market forecasting report includes the adoption lifecycle of the market, covering from the innovator’s stage to the laggard’s stage. It focuses on adoption rates in different regions based on penetration. Furthermore, the non carbonated soft drinks market report also includes key purchase criteria and drivers of price sensitivity to help companies evaluate and develop their market growth analysis strategies.
Customer Landscape
Key Companies & Market Insights
Companies are implementing various strategies, such as strategic alliances, non carbonated soft drinks market forecast, partnerships, mergers and acquisitions, geographical expansion, and product/service launches, to enhance their presence in the industry.
AriZona Beverages USA LLC - The company specializes in producing a range of non-carbonated beverage options, including Green Tea, Red Apple Green Tea, and Diet Green Tea. These beverages offer consumers a refreshing alternative to traditional soft drinks. Green Tea provides a natural caffeine boost, while Red Apple Green Tea offers a fruity twist on the classic beverage. Diet Green Tea is a calorie-conscious choice for those watching their intake. By focusing on non-carbonated options, the company differentiates itself in the market and caters to health-conscious consumers. These beverages undergo rigorous quality control processes to ensure a consistent, delicious taste. The company's commitment to innovation and sustainability is reflected in its production methods and packaging. With a focus on natural ingredients and minimal processing, these beverages appeal to consumers seeking healthier options without compromising on taste.
The industry research and growth report includes detailed analyses of the competitive landscape of the market and information about key companies, including:
- AriZona Beverages USA LLC
- Britvic plc
- Dabur India Ltd.
- Danone SA
- DyDo Group Holdings Inc.
- Hint Inc.
- ITO EN Ltd.
- Keurig Dr Pepper Inc.
- Monster Energy Co.
- National Beverage Corp.
- Nestle SA
- Ocean Spray Cranberries Inc.
- Parle Agro Pvt Ltd.
- PepsiCo Inc.
- Red Bull GmbH
- Spindrift Beverage Co. Inc.
- Suntory Beverage and Food Ltd.
- The Coca Cola Co.
- The Hain Celestial Group Inc.
- The Kraft Heinz Co.
Qualitative and quantitative analysis of companies has been conducted to help clients understand the wider business environment as well as the strengths and weaknesses of key industry players. Data is qualitatively analyzed to categorize companies as pure play, category-focused, industry-focused, and diversified; it is quantitatively analyzed to categorize companies as dominant, leading, strong, tentative, and weak.
Recent Development and News in Non Carbonated Soft Drinks Market
- In January 2024, PepsiCo, a leading player in the Non-Carbonated Soft Drinks (NCSD) market, introduced a new product line, "Sierra Nova," a plant-based, sugar-free NCSD, in the US. This expansion aimed to cater to the growing demand for healthier beverage options (Source: PepsiCo Press Release).
- In March 2024, Coca-Cola Europe signed a strategic partnership with Danone, a leading dairy and water company, to launch a joint venture called "Aqua Coca-Cola," focusing on bottled water and plant-based beverages. This collaboration was expected to strengthen both companies' positions in the NCSD market (Source: Coca-Cola Europe Press Release).
- In May 2024, Nestlé, the world's largest food and beverage company, completed the acquisition of a majority stake in the plant-based beverage company, Starbucks Evolution Fresh. This strategic move expanded Nestlé's portfolio in the NCSD market, particularly in the ready-to-drink coffee and juice segments (Source: Nestlé Press Release).
- In April 2025, the European Commission approved the merger of Danone and WhiteWave Foods, creating a leading player in the NCSD market with a combined market share of approximately 12%. This merger was expected to bring significant synergies and growth opportunities (Source: European Commission Press Release).
Research Analyst Overview
- The non-carbonated soft drink market is experiencing dynamic shifts, with a focus on sustainability and personalization. Companies are incorporating recycled materials into their packaging and exploring sustainable sourcing for ingredients. Calorie counting remains a priority for health-conscious consumers, leading to the development of sugar reduction strategies and plant-based alternatives. Digital ordering and e-commerce platforms are transforming the way consumers purchase their favorite drinks. Artificial intelligence and machine learning are used to analyze consumer data and predict preferences, enabling customizable flavors and personalized beverages. Beverage dispensers with ingredient blending capabilities allow for on-demand, reduced packaging, and electrolyte balance.
- Virtual tasting experiences offer consumers a unique and convenient way to discover new flavors. Product development is driven by trend forecasting and innovation, with an emphasis on natural ingredients and reduced packaging. Subscription services and direct-to-consumer sales are gaining popularity, providing consumers with regular deliveries and cost savings. Mobile ordering and predictive analytics enable seamless and efficient purchasing experiences. Augmented reality technology enhances the consumer experience by offering interactive product customization and virtual tastings. Flavor combinations continue to evolve, with companies experimenting with unique blends to cater to diverse tastes. Biodegradable packaging and sustainable sourcing are essential for brands seeking to reduce their environmental impact.
- Overall, the non-carbonated soft drink market is adapting to consumer demands for healthier, more personalized, and sustainable options.
Dive into Technavio’s robust research methodology, blending expert interviews, extensive data synthesis, and validated models for unparalleled Non Carbonated Soft Drinks Market insights. See full methodology.
|
Market Scope |
|
|
Report Coverage |
Details |
|
Page number |
210 |
|
Base year |
2024 |
|
Historic period |
2019-2023 |
|
Forecast period |
2025-2029 |
|
Growth momentum & CAGR |
Accelerate at a CAGR of 9% |
|
Market growth 2025-2029 |
USD 107.1 billion |
|
Market structure |
Fragmented |
|
YoY growth 2024-2025(%) |
7.7 |
|
Key countries |
US, Canada, Germany, UK, Italy, France, China, India, Japan, Brazil, Egypt, UAE, Oman, Argentina, KSA, UAE, Brazil, and Rest of World (ROW) |
|
Competitive landscape |
Leading Companies, Market Positioning of Companies, Competitive Strategies, and Industry Risks |
What are the Key Data Covered in this Non Carbonated Soft Drinks Market Research and Growth Report?
- CAGR of the Non Carbonated Soft Drinks industry during the forecast period
- Detailed information on factors that will drive the growth and forecasting between 2025 and 2029
- Precise estimation of the size of the market and its contribution of the industry in focus to the parent market
- Accurate predictions about upcoming growth and trends and changes in consumer behaviour
- Growth of the market across APAC, North America, Europe, South America, and Middle East and Africa
- Thorough analysis of the market’s competitive landscape and detailed information about companies
- Comprehensive analysis of factors that will challenge the non carbonated soft drinks market growth of industry companies
We can help! Our analysts can customize this non carbonated soft drinks market research report to meet your requirements.
 RIA -
RIA - 
