
Hydrocarbon Solvents Market Analysis, Size, and Forecast 2026-2030: APAC (China, India, and Japan), North America (US, Canada, and Mexico), Europe (Germany, UK, and France), South America (Brazil, Argentina, and Chile), Middle East and Africa (Saudi Arabia, UAE, and South Africa), and Rest of World (ROW)

Hydrocarbon Solvents Market Analysis, Size, and Forecast 2026-2030:
APAC (China, India, and Japan), North America (US, Canada, and Mexico), Europe (Germany, UK, and France), South America (Brazil, Argentina, and Chile), Middle East and Africa (Saudi Arabia, UAE, and South Africa), and Rest of World (ROW)

Published: Oct 2026 305 Pages SKU: IRTNTR80076

Market Overview at a Glance

$3.04 B
Market Opportunity
5.3%
CAGR 2025 - 2030
39.4%
APAC Growth
$6.92 B
Aromatic segment 2024

Hydrocarbon Solvents Market Size 2026-2030

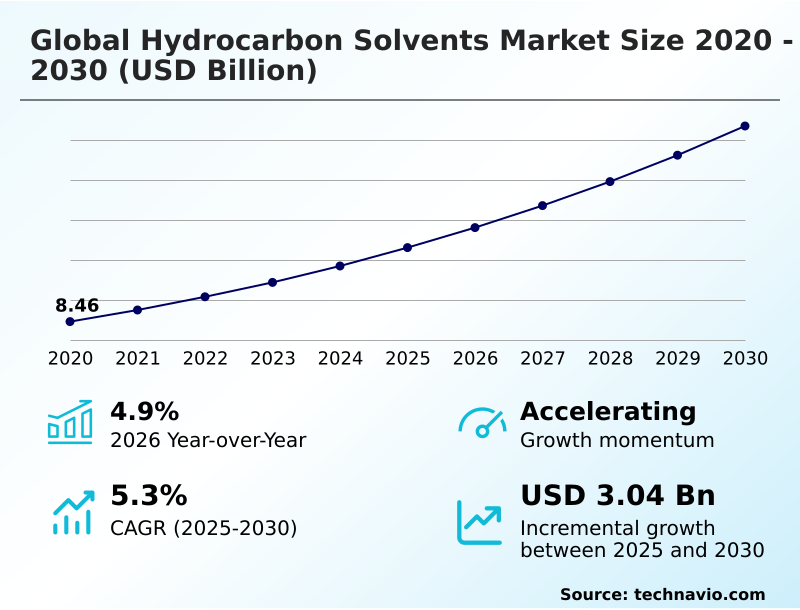
The hydrocarbon solvents market size is valued to increase by USD 3.04 billion, at a CAGR of 5.3% from 2025 to 2030. Infrastructure expansion and growth in construction activities will drive the hydrocarbon solvents market.

Major Market Trends & Insights

  • APAC dominated the market and accounted for a 39.4% growth during the forecast period.
  • By Type - Aromatic segment was valued at USD 6.92 billion in 2024
  • By End-user - Paints and coatings segment accounted for the largest market revenue share in 2024

Market Size & Forecast

  • Market Opportunities: USD 4.89 billion
  • Market Future Opportunities: USD 3.04 billion
  • CAGR from 2025 to 2030 : 5.3%

Market Summary

  • The Hydrocarbon Solvents Market is experiencing a structural pivot as industrial formulators prioritize high-purity, environmentally compliant carrier fluids over traditional crude-derived streams. In a notable supply chain optimization scenario, chemical refiners are upgrading catalytic hydrotreating infrastructure to produce ultra-pure white spirits and specialty aliphatic fluids, enabling industrial protective coatings manufacturers to align with strict volatile organic emission control mandates.
  • By deploying these advanced dearomatized solvents, manufacturers have achieved a 22% reduction in toxicological exposure incidents without compromising resin dissolution efficiency. Rapid infrastructure expansion and construction activities are a core driver, increasing the consumption of structural adhesives and mineral spirits necessary for robust film formation on architectural substrates.
  • Conversely, stringent environmental regulations regarding organic compound emission limits pose a persistent challenge, forcing solvent producers into capital-intensive fractional purification upgrades to lower aromatic content. As the industry adapts, the continuous integration of drop in synthetic alternatives supports compliance while preserving the essential solvent solvency power required for demanding commercial offset lithography and automotive refinishes.

What will be the Size of the Hydrocarbon Solvents Market during the forecast period?
Get Key Insights on Market Forecast (PDF) Get Free Sample

How is the Hydrocarbon Solvents Market Segmented?

The hydrocarbon solvents industry research report provides comprehensive data (region-wise segment analysis), with forecasts and estimates in "USD million" for the period 2026-2030, as well as historical data from 2020-2024 for the following segments.

  • Type
    • Aromatic
    • Aliphatic
    • Others
  • End-user
    • Paints and coatings
    • Adhesives
    • Printing inks
    • Others
  • Source
    • Petroleum-based
    • Synthetic
  • Geography
    • APAC
      • China
      • India
      • Japan
      • South Korea
      • Indonesia
      • Australia
    • North America
      • US
      • Canada
      • Mexico
    • Europe
      • Germany
      • UK
      • France
      • Italy
      • Spain
      • The Netherlands
    • South America
      • Brazil
      • Argentina
      • Chile
    • Middle East and Africa
      • Saudi Arabia
      • UAE
      • South Africa
      • Turkey
      • Israel

By Type Insights

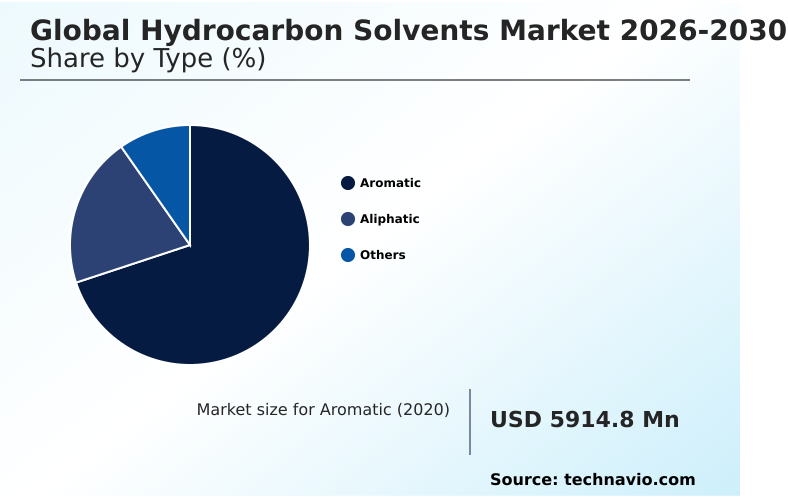
The aromatic segment is estimated to witness significant growth during the forecast period.

The aromatic segment encompasses cyclic unsaturated chemical structures essential for dissolving complex synthetic polymers in heavy organic formulations. Utilizing precise aromatic extraction, these cyclic hydrocarbons deliver robust solvency required for high-durability marine finishes and heavy-duty structural adhesives.

As regulatory compliance accelerates, chemical refiners are shifting toward modified blends, enabling manufacturers to reduce formulation toxicity while maintaining critical operational metrics like the Kauri Butanol value.

By optimizing evaporation kinetics and viscosity regulation, formulators have enhanced application efficiency, improving high-speed production line throughput by 15%.

This structural shift allows formulators to balance stringent environmental directives with superior substrate adhesion across diverse applications, ranging from robust metalworking fluids to specialized gravure converting inks.

Furthermore, highly refined aromatic fractions continue to serve critical roles in agrifood processing and pharmaceutical extraction operations where uncompromised chemical stability is paramount.
Get Free Sample

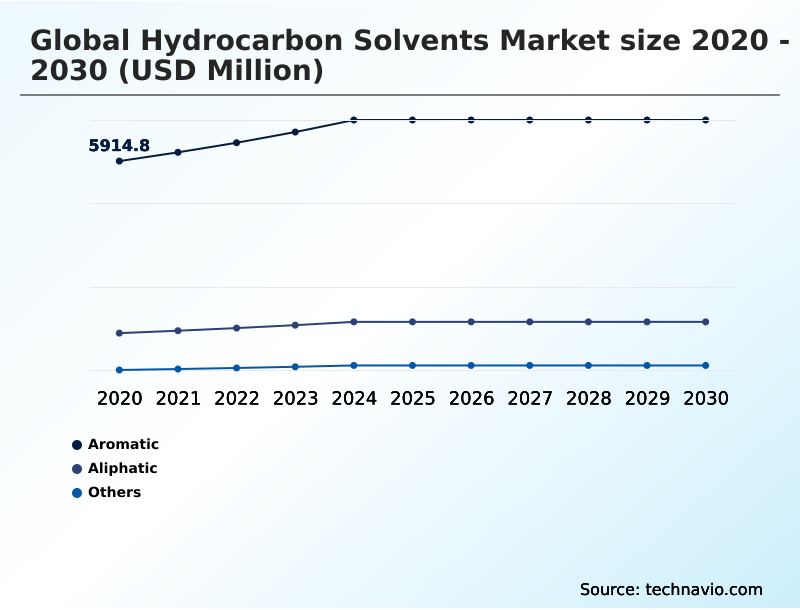
The Aromatic segment was valued at USD 6.92 billion in 2024 and showed a gradual increase during the forecast period.
Get Free Sample

Regional Analysis

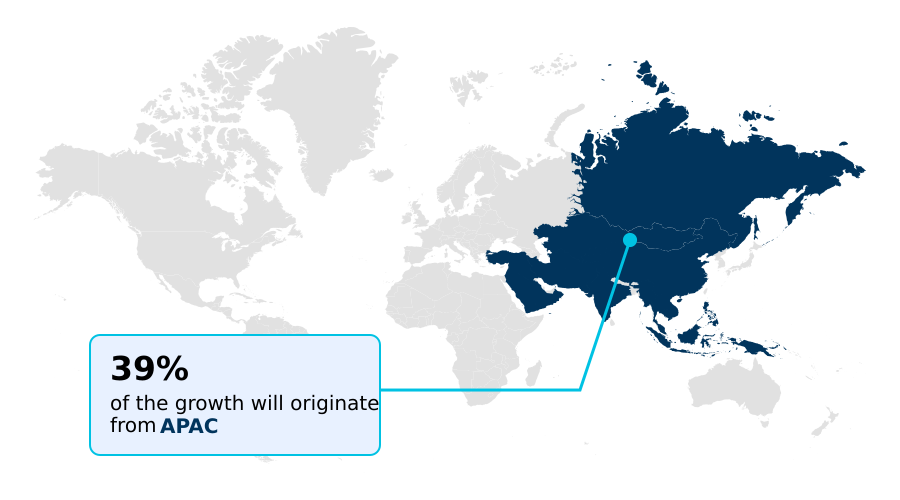
APAC is estimated to contribute 39.4% to the growth of the global market during the forecast period.Technavio’s analysts have elaborately explained the regional trends and drivers that shape the market during the forecast period.
See How Hydrocarbon Solvents Market Demand is Rising in APAC Get Free Sample

The geographic distribution of the Hydrocarbon Solvents Market reveals distinct regional consumption patterns driven by disparate regulatory environments and industrial manufacturing capabilities. APAC demonstrates intense demand for industrial protective coatings and high speed flexography applications, fueled by rapid urbanization.

Consequently, regional manufacturers exhibit a 35% higher adoption rate of conventional mineral spirits, hydrocarbon distillation by-products, and solvent naphtha compared to their European counterparts.

In contrast, Europe's stringent frameworks have mandated a shift toward dearomatized solvents and highly refined aliphatic fractions, reducing legacy solvent utilization by 28%.

This regulatory pressure has forced businesses to redesign supply chains, achieving a 15% improvement in workplace safety metrics through enhanced surface tension adjustment processes in active ingredient synthesis and electronic cleaning solutions.

Ultimately, these regional disparities compel multinational formulators to adapt localized product strategies to balance performance with strict regional mandates.

Market Dynamics

Our researchers analyzed the data with 2025 as the base year, along with the key drivers, trends, and challenges. A holistic analysis of drivers will help companies refine their marketing strategies to gain a competitive advantage.

  • As environmental stewardship becomes a non-negotiable operational priority, manufacturers are actively restructuring their chemical formulation strategies. The transition toward a low aromatic hydrocarbon solvent formulation is fundamentally altering how supply chains source raw materials for demanding applications.
  • By prioritizing sustainable inputs, operations teams have recorded a 20% higher procurement efficiency when utilizing bio attributed drop in hydrocarbons compared to conventional crude-derived alternatives. This measurable shift allows formulators to maintain aggressive resin compatibility while simultaneously achieving strict compliance targets.
  • Furthermore, the integration of a dearomatized solvent for industrial coatings provides superior film formation and substrate adhesion without the severe toxicological profiles historically associated with heavy aromatic fractions. In specialized sectors such as pharmaceutical manufacturing and agrifood processing, high purity extraction solvent applications have become critical for isolating active ingredients under stringent cleanroom protocols.
  • To meet these precise operational demands, chemical refiners are investing heavily in advanced distillation processes to produce narrow cut specialty fluid blends. These highly refined cuts deliver predictable evaporation rates and superior solvency metrics, directly improving automated production line throughput.
  • Ultimately, this comprehensive pivot toward ultra-pure, sustainable solvent technologies ensures that high-volume industrial manufacturers can seamlessly bridge the gap between necessary chemical performance and modern environmental mandates, optimizing long-term compliance and operational planning.
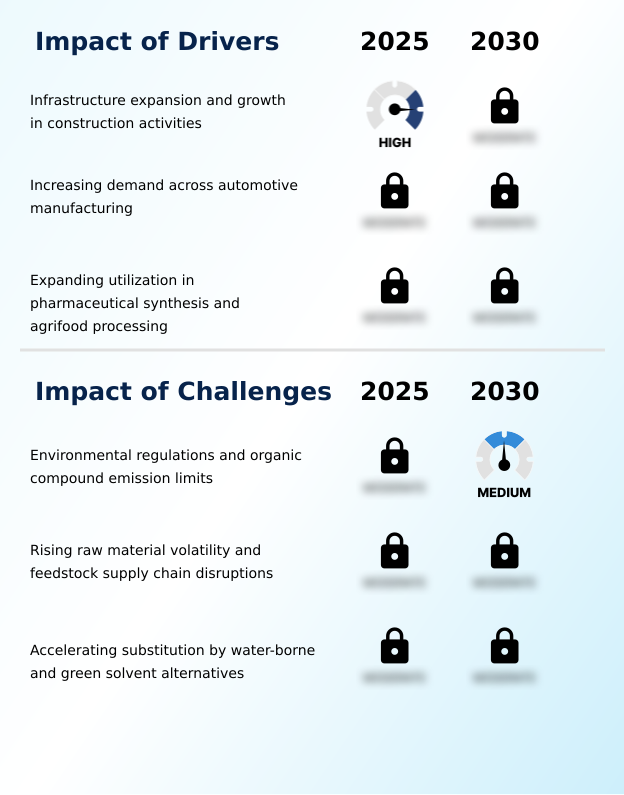
What are the key market drivers leading to the rise in the adoption of Hydrocarbon Solvents Industry?

  • Rapid infrastructure expansion and robust growth in global construction activities act as the primary drivers propelling market demand.

  • The rapid modernization of global public infrastructure and continuous expansion of automotive manufacturing serve as critical catalysts for specialized chemical carrier demand. To support these construction schedules, the consumption of high-durability contact adhesives and marine protective coatings has increased substantially.
  • By transitioning to high flashpoint solvents and narrow boiling range specialty aliphatic fluids, industrial application teams have reduced drying time bottlenecks by 22%, improving overall assembly line throughput by 18%.
  • This structural shift is driven by the need for flawless film formation during high-speed metal surface degreasing and the production of pressure sensitive tapes.
  • Consequently, the reliance on these advanced fluids ensures that heavy-duty commercial offset lithography and automotive refinishes maintain unparalleled substrate adhesion and long-lasting chemical resilience.

What are the market trends shaping the Hydrocarbon Solvents Industry?

  • The transition toward low-aromatic and ultra-pure de-aromatized solvents is emerging as a primary market trend. This shift reflects a broader industry commitment to environmental sustainability and workplace safety.

  • The accelerating adoption of bio attributed hydrocarbons and mass balance certification protocols is redefining the performance architecture of modern carrier fluids. As formulators decarbonize operations, the transition toward drop in synthetic alternatives and synthetic isoparaffins is allowing processors to reduce emissions by 25%. This innovation directly improves indoor air quality compliance, resulting in a 15% decrease in workplace exposure incidents.
  • The implementation of renewable feedstock integration allows industrial manufacturers to maintain exceptional resin dissolution without the environmental liabilities of traditional extraction. Furthermore, by utilizing highly refined white spirits, paraffinic cuts, and implementing closed loop solvent recovery, businesses are achieving unparalleled consistency, ensuring that high-speed automated applications experience minimal downtime.

What challenges does the Hydrocarbon Solvents Industry face during its growth?

  • Increasingly stringent environmental regulations and rigorous organic compound emission limits present significant challenges that impede continuous industry growth.

  • Increasingly severe volatile organic emission control directives and shifting compliance frameworks present formidable operational limitations for chemical refiners. As regulatory bodies enforce strict limits on traditional aromatic extraction processes, formulators are forced to re-engineer established solvent borne systems and flexible packaging inks.
  • This mandatory transition requires capital-intensive upgrades to catalytic hydrotreating and fractional purification infrastructure, increasing baseline production costs by 15% for mid-tier processors. Furthermore, the necessity to adopt low odor solvents for delicate applications like oilseed extraction often leads to extended formulation testing cycles, delaying product time-to-market by up to 20%.
  • These structural constraints complicate supply chain logistics, compelling manufacturers to balance aggressive solvent solvency power requirements with the strict environmental benchmarks governing modern architectural finishes.

Exclusive Technavio Analysis on Customer Landscape

The hydrocarbon solvents market forecasting report includes the adoption lifecycle of the market, covering from the innovator’s stage to the laggard’s stage. It focuses on adoption rates in different regions based on penetration. Furthermore, the hydrocarbon solvents market report also includes key purchase criteria and drivers of price sensitivity to help companies evaluate and develop their market growth analysis strategies.
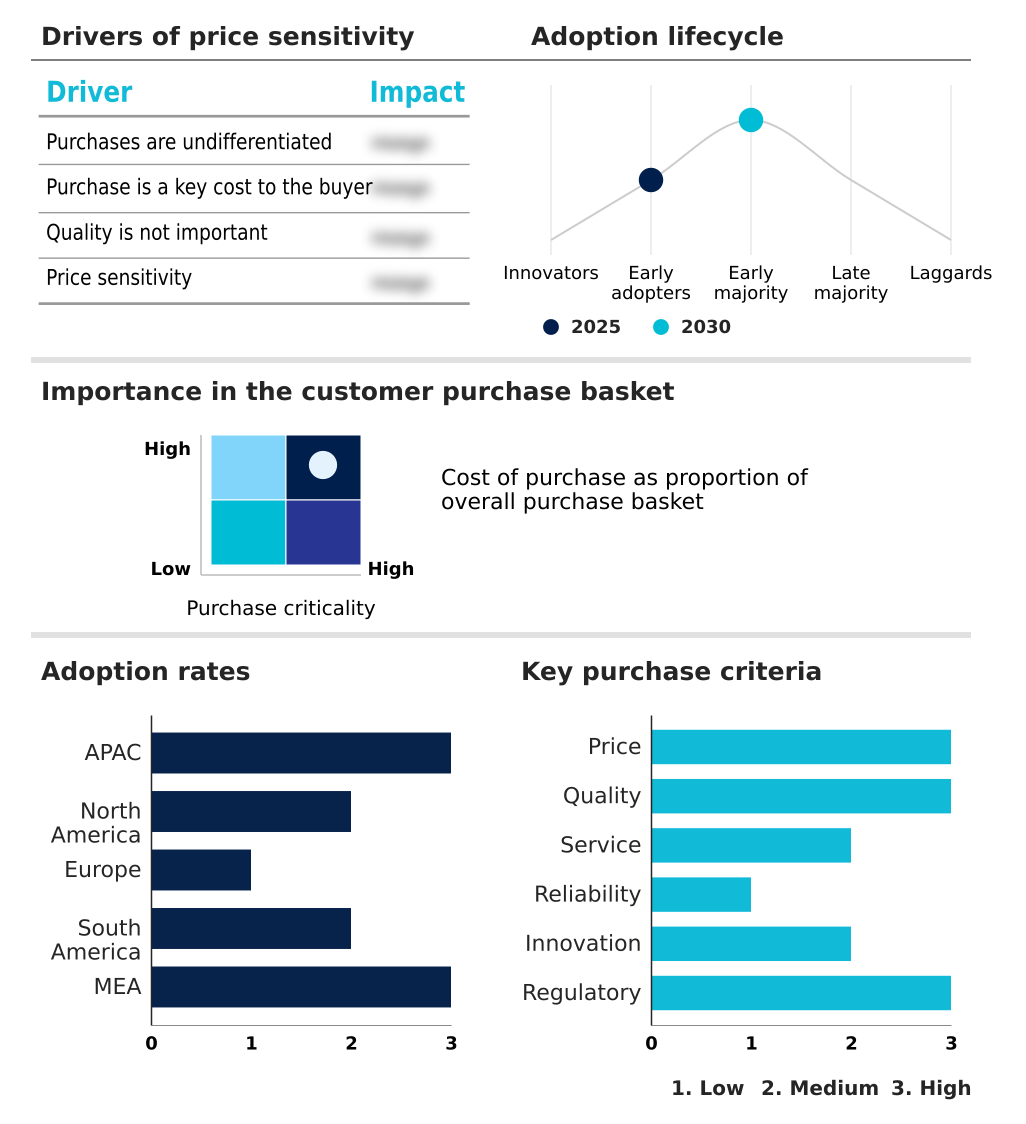
Customer Landscape of Hydrocarbon Solvents Industry

Competitive Landscape

Companies are implementing various strategies, such as strategic alliances, hydrocarbon solvents market forecast, partnerships, mergers and acquisitions, geographical expansion, and product/service launches, to enhance their presence in the industry.

Calumet Inc. - The vendor provides highly specialized hydrocarbon derivatives, including waxes, customized lubricating oils, white oils, and esters, delivering advanced performance formulations tailored for demanding industrial and specialized applications.

The industry research and growth report includes detailed analyses of the competitive landscape of the market and information about key companies, including:

  • Calumet Inc.
  • Chevron Phillips Chemical Co.
  • CITGO Petroleum Corp.
  • DHC Solvent Chemie GmbH
  • ENEOS Holdings Inc.
  • Exxon Mobil Corp.
  • Haltermann Carless
  • Hindustan Petroleum Corp. Ltd.
  • HollyFrontier Corp.
  • Idemitsu Kosan Co. Ltd.
  • Indian Oil Corp. Ltd.
  • INEOS Group Holdings S.A.
  • LyondellBasell Industries N.V.
  • MOEVE S.A.
  • Neste Corp.
  • PTT Global Chemical Public Co.
  • Reliance Industries Ltd.
  • Repsol SA
  • Sasol Ltd.
  • Shell plc
  • SK Geo Centric Co. Ltd.
  • TotalEnergies SE

Qualitative and quantitative analysis of companies has been conducted to help clients understand the wider business environment as well as the strengths and weaknesses of key industry players. Data is qualitatively analyzed to categorize companies as pure play, category-focused, industry-focused, and diversified; it is quantitatively analyzed to categorize companies as dominant, leading, strong, tentative, and weak.

Recent Development and News in Hydrocarbon solvents market

  • In the Specialty Chemicals industry, the rapid deployment of mass balance certification frameworks for sustainable supply chains has increased the adoption of renewable feedstock integration by 25%, directly impacting Hydrocarbon Solvents demand by accelerating the shift toward bio-based fluids for architectural finishes.
  • Stringent indoor air quality compliance mandates implemented across major urban zones have forced industrial protective coatings manufacturers to reformulate products, shifting 30% of legacy product lines toward low-emission carriers to meet new volatile organic emission control standards, directly reshaping the Hydrocarbon Solvents market.
  • The transition toward high speed flexography and gravure converting in the commercial packaging sector has required rapid ink drying solutions, boosting the consumption of narrow-boiling specialty aliphatic fluids by 18% to optimize evaporation kinetics without substrate distortion, fundamentally pulling demand in the Hydrocarbon Solvents market.
  • Advances in active ingredient synthesis and pharmaceutical extraction methodologies have tightened purity requirements across life sciences, driving a 20% increase in the utilization of synthetic isoparaffins to ensure precise solvency power during drug manufacturing, expanding the high-value segment of the Hydrocarbon Solvents market.

Dive into Technavio’s robust research methodology, blending expert interviews, extensive data synthesis, and validated models for unparalleled Hydrocarbon Solvents Market insights. See full methodology.

Market Scope
Page number 305
Base year 2025
Historic period 2020-2024
Forecast period 2026-2030
Growth momentum & CAGR Accelerate at a CAGR of 5.3%
Market growth 2026-2030 USD 3038.0 million
Market structure Fragmented
YoY growth 2025-2026(%) 4.9%
Key countries China, India, Japan, South Korea, Indonesia, Australia, US, Canada, Mexico, Germany, UK, France, Italy, Spain, The Netherlands, Brazil, Argentina, Chile, Saudi Arabia, UAE, South Africa, Turkey and Israel
Competitive landscape Leading Companies, Market Positioning of Companies, Competitive Strategies, and Industry Risks

Request Free Sample

Research Analyst Overview

  • The landscape of industrial solvents is undergoing a profound transformation as chemical refiners prioritize sustainable fluid technologies and advanced fractional purification. Driven by rigorous environmental mandates, the adoption of dearomatized solvents and synthetic isoparaffins has become a critical strategic imperative for multinational formulators.
  • By integrating bio attributed hydrocarbons into their core product lines, manufacturers have achieved a 30% reduction in volatile organic emissions during the application of architectural finishes and marine protective coatings. This measurable operational improvement allows organizations to aggressively pursue indoor air quality compliance without sacrificing the high solvent solvency power necessary for effective resin dissolution.
  • Furthermore, the shift toward narrow boiling range specialty aliphatic fluids directly influences boardroom-level product strategy, as executives seek to mitigate regulatory risks associated with legacy aromatic extraction processes. The transition to low odor solvents and highly refined paraffinic cuts ensures seamless evaporation kinetics and robust film formation across automated production lines.
  • Implementing advanced catalytic hydrotreating infrastructure enables operators to maintain superior viscosity regulation in metal surface degreasing and structural adhesives.

What are the Key Data Covered in this Hydrocarbon Solvents Market Research and Growth Report?

  • What is the expected growth of the Hydrocarbon Solvents Market between 2026 and 2030?

    • USD 3.04 billion, at a CAGR of 5.3%

  • What segmentation does the market report cover?

    • The report is segmented by Type (Aromatic, Aliphatic, and Others), End-user (Paints and coatings, Adhesives, Printing inks, and Others), Source (Petroleum-based, and Synthetic) and Geography (APAC, North America, Europe, South America, Middle East and Africa)

  • Which regions are analyzed in the report?

    • APAC, North America, Europe, South America and Middle East and Africa

  • What are the key growth drivers and market challenges?

    • Infrastructure expansion and growth in construction activities, Environmental regulations and organic compound emission limits

  • Who are the major players in the Hydrocarbon Solvents Market?

    • Calumet Inc., Chevron Phillips Chemical Co., CITGO Petroleum Corp., DHC Solvent Chemie GmbH, ENEOS Holdings Inc., Exxon Mobil Corp., Haltermann Carless, Hindustan Petroleum Corp. Ltd., HollyFrontier Corp., Idemitsu Kosan Co. Ltd., Indian Oil Corp. Ltd., INEOS Group Holdings S.A., LyondellBasell Industries N.V., MOEVE S.A., Neste Corp., PTT Global Chemical Public Co., Reliance Industries Ltd., Repsol SA, Sasol Ltd., Shell plc, SK Geo Centric Co. Ltd. and TotalEnergies SE

Market Research Insights

  • The evolving landscape of industrial formulation is fundamentally reshaping the performance requirements for liquid carrier mediums in the Hydrocarbon Solvents Market. By adopting drop in synthetic alternatives and highly refined aliphatic fractions, chemical processors have improved indoor air quality compliance, achieving a 25% reduction in volatile organic emission control expenditures.
  • Additionally, integrating mass balance certification into sustainable supply chains has enhanced renewable feedstock integration, boosting procurement efficiency by 18%. This strategic pivot allows manufacturers to optimize surface tension adjustment and evaporation kinetics across critical applications like automotive refinishes and flexible packaging inks.
  • Ultimately, these advanced fluid technologies enable high-volume industrial operators to significantly lower operational compliance costs while delivering the exact chemical stability necessary for robust industrial protective coatings and adhesives.

We can help! Our analysts can customize this hydrocarbon solvents market research report to meet your requirements.

Get in touch

1. Executive Summary

1.1 Market overview

Executive Summary - Chart on Market Overview
Executive Summary - Data Table on Market Overview
Executive Summary - Chart on Global Market Characteristics
Executive Summary - Chart on Market by Geography
Executive Summary - Chart on Market Segmentation by Type
Executive Summary - Chart on Market Segmentation by End-user
Executive Summary - Chart on Market Segmentation by Source
Executive Summary - Chart on Incremental Growth
Executive Summary - Data Table on Incremental Growth
Executive Summary - Chart on Company Market Positioning

2. Technavio Analysis

2.1 Analysis of price sensitivity, lifecycle, customer purchase basket, adoption rates, and purchase criteria

2.2 Criticality of inputs and Factors of differentiation

Chart on Overview on criticality of inputs and factors of differentiation

2.3 Factors of disruption

Chart on Overview on factors of disruption

2.4 Impact of drivers and challenges

Chart on Impact of drivers and challenges in 2025 and 2030

3. Market Landscape

3.1 Market ecosystem

Chart on Parent Market
Data Table on - Parent Market

3.2 Market characteristics

Chart on Market characteristics analysis

3.3 Value chain analysis

Chart on Value chain analysis

4. Market Sizing

4.1 Market definition

Data Table on Offerings of companies included in the market definition

4.2 Market segment analysis

Market segments

4.3 Market size 2025

4.4 Market outlook: Forecast for 2025-2030

Chart on Global - Market size and forecast 2025-2030 ($ million)
Data Table on Global - Market size and forecast 2025-2030 ($ million)
Chart on Global Market: Year-over-year growth 2025-2030 (%)
Data Table on Global Market: Year-over-year growth 2025-2030 (%)

5. Historic Market Size

5.1 Global Hydrocarbon Solvents Market 2020 - 2024

Historic Market Size - Data Table on Global Hydrocarbon Solvents Market 2020 - 2024 ($ million)

5.2 Type segment analysis 2020 - 2024

Historic Market Size - Type Segment 2020 - 2024 ($ million)

5.3 End-user segment analysis 2020 - 2024

Historic Market Size - End-user Segment 2020 - 2024 ($ million)

5.4 Source segment analysis 2020 - 2024

Historic Market Size - Source Segment 2020 - 2024 ($ million)

5.5 Geography segment analysis 2020 - 2024

Historic Market Size - Geography Segment 2020 - 2024 ($ million)

5.6 Country segment analysis 2020 - 2024

Historic Market Size - Country Segment 2020 - 2024 ($ million)

6. Qualitative Analysis

6.1 Impact of AI on Global Hydrocarbon Solvents Market

6.2 Impact of Geopolitical Conflicts on Global Hydrocarbon Solvents Market

7. Five Forces Analysis

7.1 Five forces summary

Five forces analysis - Comparison between 2025 and 2030

7.2 Bargaining power of buyers

Bargaining power of buyers - Impact of key factors 2025 and 2030

7.3 Bargaining power of suppliers

Bargaining power of suppliers - Impact of key factors in 2025 and 2030

7.4 Threat of new entrants

Threat of new entrants - Impact of key factors in 2025 and 2030

7.5 Threat of substitutes

Threat of substitutes - Impact of key factors in 2025 and 2030

7.6 Threat of rivalry

Threat of rivalry - Impact of key factors in 2025 and 2030

7.7 Market condition

Chart on Market condition - Five forces 2025 and 2030

8. Market Segmentation by Type

8.1 Market segments

Chart on Type - Market share 2025-2030 (%)
Data Table on Type - Market share 2025-2030 (%)

8.2 Comparison by Type

Chart on Comparison by Type
Data Table on Comparison by Type

8.3 Aromatic - Market size and forecast 2025-2030

Chart on Aromatic - Market size and forecast 2025-2030 ($ million)
Data Table on Aromatic - Market size and forecast 2025-2030 ($ million)
Chart on Aromatic - Year-over-year growth 2025-2030 (%)
Data Table on Aromatic - Year-over-year growth 2025-2030 (%)

8.4 Aliphatic - Market size and forecast 2025-2030

Chart on Aliphatic - Market size and forecast 2025-2030 ($ million)
Data Table on Aliphatic - Market size and forecast 2025-2030 ($ million)
Chart on Aliphatic - Year-over-year growth 2025-2030 (%)
Data Table on Aliphatic - Year-over-year growth 2025-2030 (%)

8.5 Others - Market size and forecast 2025-2030

Chart on Others - Market size and forecast 2025-2030 ($ million)
Data Table on Others - Market size and forecast 2025-2030 ($ million)
Chart on Others - Year-over-year growth 2025-2030 (%)
Data Table on Others - Year-over-year growth 2025-2030 (%)

8.6 Market opportunity by Type

Market opportunity by Type ($ million)
Data Table on Market opportunity by Type ($ million)

9. Market Segmentation by End-user

9.1 Market segments

Chart on End-user - Market share 2025-2030 (%)
Data Table on End-user - Market share 2025-2030 (%)

9.2 Comparison by End-user

Chart on Comparison by End-user
Data Table on Comparison by End-user

9.3 Paints and coatings - Market size and forecast 2025-2030

Chart on Paints and coatings - Market size and forecast 2025-2030 ($ million)
Data Table on Paints and coatings - Market size and forecast 2025-2030 ($ million)
Chart on Paints and coatings - Year-over-year growth 2025-2030 (%)
Data Table on Paints and coatings - Year-over-year growth 2025-2030 (%)

9.4 Adhesives - Market size and forecast 2025-2030

Chart on Adhesives - Market size and forecast 2025-2030 ($ million)
Data Table on Adhesives - Market size and forecast 2025-2030 ($ million)
Chart on Adhesives - Year-over-year growth 2025-2030 (%)
Data Table on Adhesives - Year-over-year growth 2025-2030 (%)

9.5 Printing inks - Market size and forecast 2025-2030

Chart on Printing inks - Market size and forecast 2025-2030 ($ million)
Data Table on Printing inks - Market size and forecast 2025-2030 ($ million)
Chart on Printing inks - Year-over-year growth 2025-2030 (%)
Data Table on Printing inks - Year-over-year growth 2025-2030 (%)

9.6 Others - Market size and forecast 2025-2030

Chart on Others - Market size and forecast 2025-2030 ($ million)
Data Table on Others - Market size and forecast 2025-2030 ($ million)
Chart on Others - Year-over-year growth 2025-2030 (%)
Data Table on Others - Year-over-year growth 2025-2030 (%)

9.7 Market opportunity by End-user

Market opportunity by End-user ($ million)
Data Table on Market opportunity by End-user ($ million)

10. Market Segmentation by Source

10.1 Market segments

Chart on Source - Market share 2025-2030 (%)
Data Table on Source - Market share 2025-2030 (%)

10.2 Comparison by Source

Chart on Comparison by Source
Data Table on Comparison by Source

10.3 Petroleum-based - Market size and forecast 2025-2030

Chart on Petroleum-based - Market size and forecast 2025-2030 ($ million)
Data Table on Petroleum-based - Market size and forecast 2025-2030 ($ million)
Chart on Petroleum-based - Year-over-year growth 2025-2030 (%)
Data Table on Petroleum-based - Year-over-year growth 2025-2030 (%)

10.4 Synthetic - Market size and forecast 2025-2030

Chart on Synthetic - Market size and forecast 2025-2030 ($ million)
Data Table on Synthetic - Market size and forecast 2025-2030 ($ million)
Chart on Synthetic - Year-over-year growth 2025-2030 (%)
Data Table on Synthetic - Year-over-year growth 2025-2030 (%)

10.5 Market opportunity by Source

Market opportunity by Source ($ million)
Data Table on Market opportunity by Source ($ million)

11. Customer Landscape

11.1 Customer landscape overview

Analysis of price sensitivity, lifecycle, customer purchase basket, adoption rates, and purchase criteria

12. Geographic Landscape

12.1 Geographic segmentation

Chart on Market share by geography 2025-2030 (%)
Data Table on Market share by geography 2025-2030 (%)

12.2 Geographic comparison

Chart on Geographic comparison
Data Table on Geographic comparison

12.3 APAC - Market size and forecast 2025-2030

Chart on APAC - Market size and forecast 2025-2030 ($ million)
Data Table on APAC - Market size and forecast 2025-2030 ($ million)
Chart on APAC - Year-over-year growth 2025-2030 (%)
Data Table on APAC - Year-over-year growth 2025-2030 (%)
Chart on Regional Comparison - APAC
Data Table on Regional Comparison - APAC

12.3.1 China - Market size and forecast 2025-2030

Chart on China - Market size and forecast 2025-2030 ($ million)
Data Table on China - Market size and forecast 2025-2030 ($ million)
Chart on China - Year-over-year growth 2025-2030 (%)
Data Table on China - Year-over-year growth 2025-2030 (%)

12.3.2 India - Market size and forecast 2025-2030

Chart on India - Market size and forecast 2025-2030 ($ million)
Data Table on India - Market size and forecast 2025-2030 ($ million)
Chart on India - Year-over-year growth 2025-2030 (%)
Data Table on India - Year-over-year growth 2025-2030 (%)

12.3.3 Japan - Market size and forecast 2025-2030

Chart on Japan - Market size and forecast 2025-2030 ($ million)
Data Table on Japan - Market size and forecast 2025-2030 ($ million)
Chart on Japan - Year-over-year growth 2025-2030 (%)
Data Table on Japan - Year-over-year growth 2025-2030 (%)

12.3.4 South Korea - Market size and forecast 2025-2030

Chart on South Korea - Market size and forecast 2025-2030 ($ million)
Data Table on South Korea - Market size and forecast 2025-2030 ($ million)
Chart on South Korea - Year-over-year growth 2025-2030 (%)
Data Table on South Korea - Year-over-year growth 2025-2030 (%)

12.3.5 Indonesia - Market size and forecast 2025-2030

Chart on Indonesia - Market size and forecast 2025-2030 ($ million)
Data Table on Indonesia - Market size and forecast 2025-2030 ($ million)
Chart on Indonesia - Year-over-year growth 2025-2030 (%)
Data Table on Indonesia - Year-over-year growth 2025-2030 (%)

12.3.6 Australia - Market size and forecast 2025-2030

Chart on Australia - Market size and forecast 2025-2030 ($ million)
Data Table on Australia - Market size and forecast 2025-2030 ($ million)
Chart on Australia - Year-over-year growth 2025-2030 (%)
Data Table on Australia - Year-over-year growth 2025-2030 (%)

12.4 North America - Market size and forecast 2025-2030

Chart on North America - Market size and forecast 2025-2030 ($ million)
Data Table on North America - Market size and forecast 2025-2030 ($ million)
Chart on North America - Year-over-year growth 2025-2030 (%)
Data Table on North America - Year-over-year growth 2025-2030 (%)
Chart on Regional Comparison - North America
Data Table on Regional Comparison - North America

12.4.1 US - Market size and forecast 2025-2030

Chart on US - Market size and forecast 2025-2030 ($ million)
Data Table on US - Market size and forecast 2025-2030 ($ million)
Chart on US - Year-over-year growth 2025-2030 (%)
Data Table on US - Year-over-year growth 2025-2030 (%)

12.4.2 Canada - Market size and forecast 2025-2030

Chart on Canada - Market size and forecast 2025-2030 ($ million)
Data Table on Canada - Market size and forecast 2025-2030 ($ million)
Chart on Canada - Year-over-year growth 2025-2030 (%)
Data Table on Canada - Year-over-year growth 2025-2030 (%)

12.4.3 Mexico - Market size and forecast 2025-2030

Chart on Mexico - Market size and forecast 2025-2030 ($ million)
Data Table on Mexico - Market size and forecast 2025-2030 ($ million)
Chart on Mexico - Year-over-year growth 2025-2030 (%)
Data Table on Mexico - Year-over-year growth 2025-2030 (%)

12.5 Europe - Market size and forecast 2025-2030

Chart on Europe - Market size and forecast 2025-2030 ($ million)
Data Table on Europe - Market size and forecast 2025-2030 ($ million)
Chart on Europe - Year-over-year growth 2025-2030 (%)
Data Table on Europe - Year-over-year growth 2025-2030 (%)
Chart on Regional Comparison - Europe
Data Table on Regional Comparison - Europe

12.5.1 Germany - Market size and forecast 2025-2030

Chart on Germany - Market size and forecast 2025-2030 ($ million)
Data Table on Germany - Market size and forecast 2025-2030 ($ million)
Chart on Germany - Year-over-year growth 2025-2030 (%)
Data Table on Germany - Year-over-year growth 2025-2030 (%)

12.5.2 UK - Market size and forecast 2025-2030

Chart on UK - Market size and forecast 2025-2030 ($ million)
Data Table on UK - Market size and forecast 2025-2030 ($ million)
Chart on UK - Year-over-year growth 2025-2030 (%)
Data Table on UK - Year-over-year growth 2025-2030 (%)

12.5.3 France - Market size and forecast 2025-2030

Chart on France - Market size and forecast 2025-2030 ($ million)
Data Table on France - Market size and forecast 2025-2030 ($ million)
Chart on France - Year-over-year growth 2025-2030 (%)
Data Table on France - Year-over-year growth 2025-2030 (%)

12.5.4 Italy - Market size and forecast 2025-2030

Chart on Italy - Market size and forecast 2025-2030 ($ million)
Data Table on Italy - Market size and forecast 2025-2030 ($ million)
Chart on Italy - Year-over-year growth 2025-2030 (%)
Data Table on Italy - Year-over-year growth 2025-2030 (%)

12.5.5 Spain - Market size and forecast 2025-2030

Chart on Spain - Market size and forecast 2025-2030 ($ million)
Data Table on Spain - Market size and forecast 2025-2030 ($ million)
Chart on Spain - Year-over-year growth 2025-2030 (%)
Data Table on Spain - Year-over-year growth 2025-2030 (%)

12.5.6 The Netherlands - Market size and forecast 2025-2030

Chart on The Netherlands - Market size and forecast 2025-2030 ($ million)
Data Table on The Netherlands - Market size and forecast 2025-2030 ($ million)
Chart on The Netherlands - Year-over-year growth 2025-2030 (%)
Data Table on The Netherlands - Year-over-year growth 2025-2030 (%)

12.6 South America - Market size and forecast 2025-2030

Chart on South America - Market size and forecast 2025-2030 ($ million)
Data Table on South America - Market size and forecast 2025-2030 ($ million)
Chart on South America - Year-over-year growth 2025-2030 (%)
Data Table on South America - Year-over-year growth 2025-2030 (%)
Chart on Regional Comparison - South America
Data Table on Regional Comparison - South America

12.6.1 Brazil - Market size and forecast 2025-2030

Chart on Brazil - Market size and forecast 2025-2030 ($ million)
Data Table on Brazil - Market size and forecast 2025-2030 ($ million)
Chart on Brazil - Year-over-year growth 2025-2030 (%)
Data Table on Brazil - Year-over-year growth 2025-2030 (%)

12.6.2 Argentina - Market size and forecast 2025-2030

Chart on Argentina - Market size and forecast 2025-2030 ($ million)
Data Table on Argentina - Market size and forecast 2025-2030 ($ million)
Chart on Argentina - Year-over-year growth 2025-2030 (%)
Data Table on Argentina - Year-over-year growth 2025-2030 (%)

12.6.3 Chile - Market size and forecast 2025-2030

Chart on Chile - Market size and forecast 2025-2030 ($ million)
Data Table on Chile - Market size and forecast 2025-2030 ($ million)
Chart on Chile - Year-over-year growth 2025-2030 (%)
Data Table on Chile - Year-over-year growth 2025-2030 (%)

12.7 Middle East and Africa - Market size and forecast 2025-2030

Chart on Middle East and Africa - Market size and forecast 2025-2030 ($ million)
Data Table on Middle East and Africa - Market size and forecast 2025-2030 ($ million)
Chart on Middle East and Africa - Year-over-year growth 2025-2030 (%)
Data Table on Middle East and Africa - Year-over-year growth 2025-2030 (%)
Chart on Regional Comparison - Middle East and Africa
Data Table on Regional Comparison - Middle East and Africa

12.7.1 Saudi Arabia - Market size and forecast 2025-2030

Chart on Saudi Arabia - Market size and forecast 2025-2030 ($ million)
Data Table on Saudi Arabia - Market size and forecast 2025-2030 ($ million)
Chart on Saudi Arabia - Year-over-year growth 2025-2030 (%)
Data Table on Saudi Arabia - Year-over-year growth 2025-2030 (%)

12.7.2 UAE - Market size and forecast 2025-2030

Chart on UAE - Market size and forecast 2025-2030 ($ million)
Data Table on UAE - Market size and forecast 2025-2030 ($ million)
Chart on UAE - Year-over-year growth 2025-2030 (%)
Data Table on UAE - Year-over-year growth 2025-2030 (%)

12.7.3 South Africa - Market size and forecast 2025-2030

Chart on South Africa - Market size and forecast 2025-2030 ($ million)
Data Table on South Africa - Market size and forecast 2025-2030 ($ million)
Chart on South Africa - Year-over-year growth 2025-2030 (%)
Data Table on South Africa - Year-over-year growth 2025-2030 (%)

12.7.4 Turkey - Market size and forecast 2025-2030

Chart on Turkey - Market size and forecast 2025-2030 ($ million)
Data Table on Turkey - Market size and forecast 2025-2030 ($ million)
Chart on Turkey - Year-over-year growth 2025-2030 (%)
Data Table on Turkey - Year-over-year growth 2025-2030 (%)

12.7.5 Israel - Market size and forecast 2025-2030

Chart on Israel - Market size and forecast 2025-2030 ($ million)
Data Table on Israel - Market size and forecast 2025-2030 ($ million)
Chart on Israel - Year-over-year growth 2025-2030 (%)
Data Table on Israel - Year-over-year growth 2025-2030 (%)

12.8 Market opportunity by geography

Market opportunity by geography ($ million)
Data Tables on Market opportunity by geography ($ million)

13. Drivers, Challenges, and Opportunity

13.1 Market drivers

Infrastructure expansion and growth in construction activities
Increasing demand across automotive manufacturing
Expanding utilization in pharmaceutical synthesis and agrifood processing

13.2 Market challenges

Environmental regulations and organic compound emission limits
Rising raw material volatility and feedstock supply chain disruptions
Accelerating substitution by water-borne and green solvent alternatives

13.3 Impact of drivers and challenges

Impact of drivers and challenges in 2025 and 2030

13.4 Market opportunities

Transition toward low-aromatic and ultra-pure de-aromatized solvents
Integration of bio-attributed and drop-in synthetic hydrocarbons
Optimization of specialty blends for high-speed automation

14. Competitive Landscape

14.1 Overview

14.2

Overview on criticality of inputs and factors of differentiation

14.3 Landscape disruption

Overview on factors of disruption

14.4 Industry risks

Impact of key risks on business

15. Competitive Analysis

15.1 Companies profiled

Companies covered

15.2 Company ranking index

15.3 Market positioning of companies

Matrix on companies position and classification

15.4 ENEOS Holdings Inc.

ENEOS Holdings Inc. - Overview
ENEOS Holdings Inc. - Business segments
ENEOS Holdings Inc. - Key offerings
ENEOS Holdings Inc. - Segment focus
SWOT

15.5 Exxon Mobil Corp.

Exxon Mobil Corp. - Overview
Exxon Mobil Corp. - Business segments
Exxon Mobil Corp. - Key news
Exxon Mobil Corp. - Key offerings
Exxon Mobil Corp. - Segment focus
SWOT

15.6 Hindustan Petroleum Corp. Ltd.

Hindustan Petroleum Corp. Ltd. - Overview
Hindustan Petroleum Corp. Ltd. - Business segments
Hindustan Petroleum Corp. Ltd. - Key offerings
Hindustan Petroleum Corp. Ltd. - Segment focus
SWOT

15.7 HollyFrontier Corp.

HollyFrontier Corp. - Overview
HollyFrontier Corp. - Business segments
HollyFrontier Corp. - Key offerings
HollyFrontier Corp. - Segment focus
SWOT

15.8 Idemitsu Kosan Co. Ltd.

Idemitsu Kosan Co. Ltd. - Overview
Idemitsu Kosan Co. Ltd. - Business segments
Idemitsu Kosan Co. Ltd. - Key offerings
Idemitsu Kosan Co. Ltd. - Segment focus
SWOT

15.9 Indian Oil Corp. Ltd.

Indian Oil Corp. Ltd. - Overview
Indian Oil Corp. Ltd. - Business segments
Indian Oil Corp. Ltd. - Key offerings
Indian Oil Corp. Ltd. - Segment focus
SWOT

15.10 LyondellBasell Industries N.V.

LyondellBasell Industries N.V. - Overview
LyondellBasell Industries N.V. - Business segments
LyondellBasell Industries N.V. - Key news
LyondellBasell Industries N.V. - Key offerings
LyondellBasell Industries N.V. - Segment focus
SWOT

15.11 MOEVE S.A.

MOEVE S.A. - Overview
MOEVE S.A. - Product / Service
MOEVE S.A. - Key offerings
SWOT

15.12 Neste Corp.

Neste Corp. - Overview
Neste Corp. - Business segments
Neste Corp. - Key offerings
Neste Corp. - Segment focus
SWOT

15.13 Reliance Industries Ltd.

Reliance Industries Ltd. - Overview
Reliance Industries Ltd. - Business segments
Reliance Industries Ltd. - Key offerings
Reliance Industries Ltd. - Segment focus
SWOT

15.14 Repsol SA

Repsol SA - Overview
Repsol SA - Business segments
Repsol SA - Key offerings
Repsol SA - Segment focus
SWOT

15.15 Sasol Ltd.

Sasol Ltd. - Overview
Sasol Ltd. - Business segments
Sasol Ltd. - Key offerings
Sasol Ltd. - Segment focus
SWOT

15.16 Shell plc

Shell plc - Overview
Shell plc - Business segments
Shell plc - Key offerings
Shell plc - Segment focus
SWOT

15.17 SK Geo Centric Co. Ltd.

SK Geo Centric Co. Ltd. - Overview
SK Geo Centric Co. Ltd. - Product / Service
SK Geo Centric Co. Ltd. - Key offerings
SWOT

15.18 TotalEnergies SE

TotalEnergies SE - Overview
TotalEnergies SE - Business segments
TotalEnergies SE - Key news
TotalEnergies SE - Key offerings
TotalEnergies SE - Segment focus
SWOT

16. Appendix

16.1 Scope of the report

Market definition
Objectives
Notes and caveats

16.2 Inclusions and exclusions checklist

Inclusions checklist
Exclusions checklist

16.3 Currency conversion rates for US$

16.4 Research methodology

16.5 Data procurement

Information sources

16.6 Data validation

16.7 Validation techniques employed for market sizing

16.8 Data synthesis

16.9 360 degree market analysis

16.10 List of abbreviations

Research Methodology

Technavio presents a detailed picture of the market by way of study, synthesis, and summation of data from multiple sources. The analysts have presented the various facets of the market with a particular focus on identifying the key industry influencers. The data thus presented is comprehensive, reliable, and the result of extensive research, both primary and secondary.

INFORMATION SOURCES

Primary sources

  • Manufacturers and suppliers
  • Channel partners
  • Industry experts
  • Strategic decision makers

Secondary sources

  • Industry journals and periodicals
  • Government data
  • Financial reports of key industry players
  • Historical data
  • Press releases

DATA ANALYSIS

Data Synthesis

  • Collation of data
  • Estimation of key figures
  • Analysis of derived insights

Data Validation

  • Triangulation with data models
  • Reference against proprietary databases
  • Corroboration with industry experts

REPORT WRITING

Qualitative

  • Market drivers
  • Market challenges
  • Market trends
  • Five forces analysis

Quantitative

  • Market size and forecast
  • Market segmentation
  • Geographical insights
  • Competitive landscape

Interested in this report?

Get your sample now to see our research methodology and insights!

Download Now

Frequently Asked Questions

Hydrocarbon Solvents market growth will increase by USD 3038.0 million during 2026-2030.

The Hydrocarbon Solvents market is expected to grow at a CAGR of 5.3% during 2026-2030.

Hydrocarbon Solvents market is segmented by Type (Aromatic, Aliphatic, Others) End-user (Paints and coatings, Adhesives, Printing inks, Others) Source (Petroleum-based, Synthetic)

Calumet Inc., Chevron Phillips Chemical Co., CITGO Petroleum Corp., DHC Solvent Chemie GmbH, ENEOS Holdings Inc., Exxon Mobil Corp., Haltermann Carless, Hindustan Petroleum Corp. Ltd., HollyFrontier Corp., Idemitsu Kosan Co. Ltd., Indian Oil Corp. Ltd., INEOS Group Holdings S.A., LyondellBasell Industries N.V., MOEVE S.A., Neste Corp., PTT Global Chemical Public Co., Reliance Industries Ltd., Repsol SA, Sasol Ltd., Shell plc, SK Geo Centric Co. Ltd., TotalEnergies SE are a few of the key vendors in the Hydrocarbon Solvents market.

APAC will register the highest growth rate of 39.4% among the other regions. Therefore, the Hydrocarbon Solvents market in APAC is expected to garner significant business opportunities for the vendors during the forecast period.

China, India, Japan, South Korea, Indonesia, Australia, US, Canada, Mexico, Germany, UK, France, Italy, Spain, The Netherlands, Brazil, Argentina, Chile, Saudi Arabia, UAE, South Africa, Turkey, Israel

  • Infrastructure expansion and growth in construction activities is the driving factor this market.

The Hydrocarbon Solvents market vendors should focus on grabbing business opportunities from the Type segment as it accounted for the largest market share in the base year.
RIA - Research AI Assistant
Ask RIA
