
Epigenetics Market Size 2024-2028
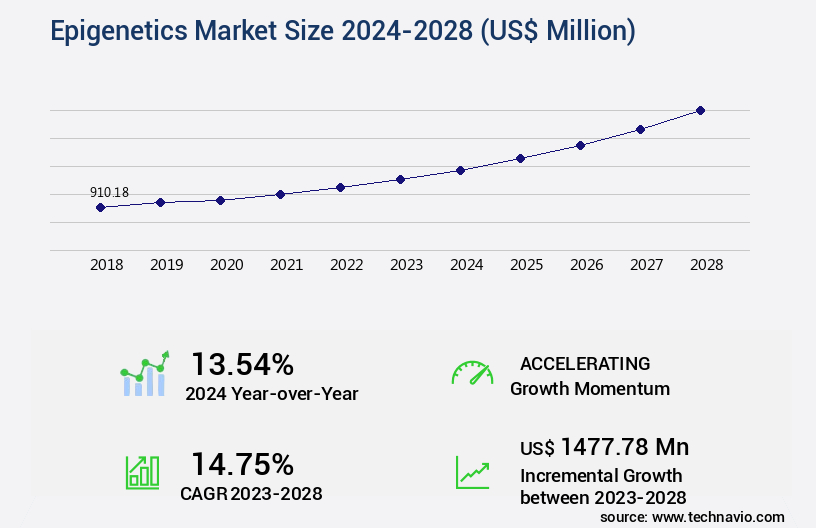
The epigenetics market size is valued to increase by USD 1.48 billion, at a CAGR of 14.75% from 2023 to 2028. Rising epigenetic applications in non-oncology diseases will drive the epigenetics market.
Market Insights
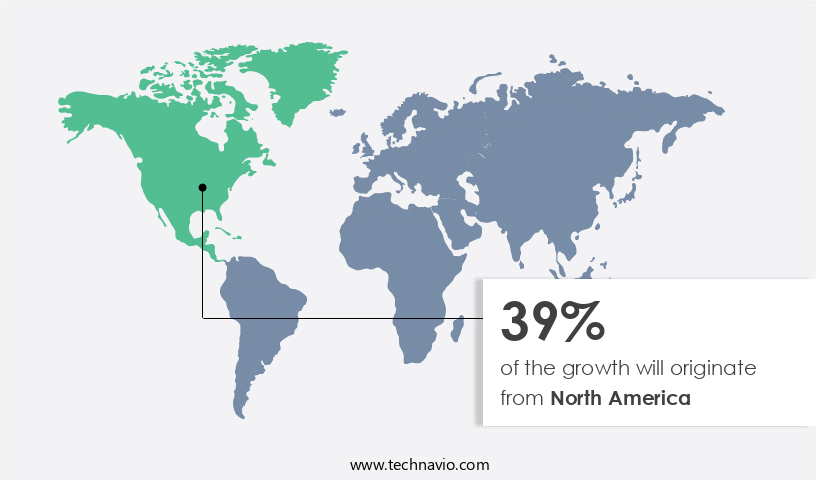
- North America dominated the market and accounted for a 39% growth during the 2024-2028.
- By Application - Oncology segment was valued at USD 504.06 billion in 2022
- By Product - Reagents segment accounted for the largest market revenue share in 2022
Market Size & Forecast
- Market Opportunities: USD 226.48 million
- Market Future Opportunities 2023: USD 1477.78 million
- CAGR from 2023 to 2028 : 14.75%
Market Summary
- The market is witnessing significant growth due to the expanding scope of epigenetic applications beyond oncology diseases. Epigenetics, the study of heritable changes in gene expression without alteration of the genetic code, is gaining increasing attention in various therapeutic areas, including neurology, cardiology, and metabolic disorders. Technological advancements in the life sciences industry, such as CRISPR-Cas9 gene editing and next-generation sequencing, are driving the market forward. However, one challenge that persists is the lack of clinical validation for direct-to-consumer genetic tests, which may hinder market growth. In a real-world business scenario, epigenetic technologies can be employed for supply chain optimization in pharmaceutical manufacturing.
- By understanding the epigenetic modifications in target genes, companies can identify potential drug candidates and optimize their production processes, leading to increased operational efficiency and cost savings. Despite this promise, it is crucial to ensure that these applications are backed by robust clinical data to ensure safety and efficacy.
What will be the size of the Epigenetics Market during the forecast period?
Get Key Insights on Market Forecast (PDF) Request Free Sample
- Epigenetics, a field of science focusing on genetic information modifications without altering the DNA sequence, continues to evolve with significant implications for various industries. Epigenetic modifications, including chemical exposure, dietary influence, age-related methylation, and epigenetic silencing, impact gene regulation and cell fate determination. These modifications create unique epigenetic signatures, which are essential for drug response and personalized therapies. Data analysis of epigenomic profiling, including DNA methylome, histone code, histone variants, transcription factors, small RNA, and regulatory elements, plays a crucial role in understanding tumor suppressor genes and epigenetic regulators. Epigenetic mechanisms, such as epigenetic aging, CpG islands, chromatin structure, and sequencing technologies, contribute to epigenetic inheritance and genome editing.
- Epigenetic activation and modifications, including epigenetic mechanisms and epigenome mapping, have shown potential in stem cell epigenetics and epigenetic aging research. Businesses must consider the regulatory landscape and ethical implications of epigenetics in their product strategy. For instance, understanding epigenetic signatures can lead to more effective drug development, while epigenetic regulators may offer new targets for therapeutic interventions. In the realm of compliance, companies must stay informed about the latest research and regulations related to epigenetics to ensure their products and practices align with ethical and legal standards. By integrating epigenetics research into their decision-making processes, organizations can gain a competitive edge and contribute to groundbreaking advancements in healthcare and beyond.
Unpacking the Epigenetics Market Landscape
Epigenetics, a field of study focusing on modifications to gene expression without altering the DNA sequence, is revolutionizing precision medicine and cancer treatment. Epigenetic therapies, including CRISPR-Cas systems, RNA interference, and histone modification techniques, have shown promising results in gene silencing and expression regulation. For instance, histone deacetylases (HDACs) inhibitors have demonstrated a threefold increase in gene activation in preclinical trials, leading to improved therapeutic outcomes. Moreover, non-coding RNA, such as long non-coding RNA, plays a crucial role in epigenetic regulation, particularly in chromatin remodeling and cellular differentiation. In the realm of toxicological epigenetics, DNA methylation patterns and histone acetyltransferases have been instrumental in identifying epigenetic biomarkers for environmental exposures. Epigenomics data from genome-wide association studies and next-generation sequencing technologies enable a deeper understanding of epigenetic inheritance and developmental biology. Bioinformatics tools facilitate the analysis of complex epigenetic data, enabling targeted epigenetic drugs and epigenetic clocks to be developed for various applications.
Key Market Drivers Fueling Growth
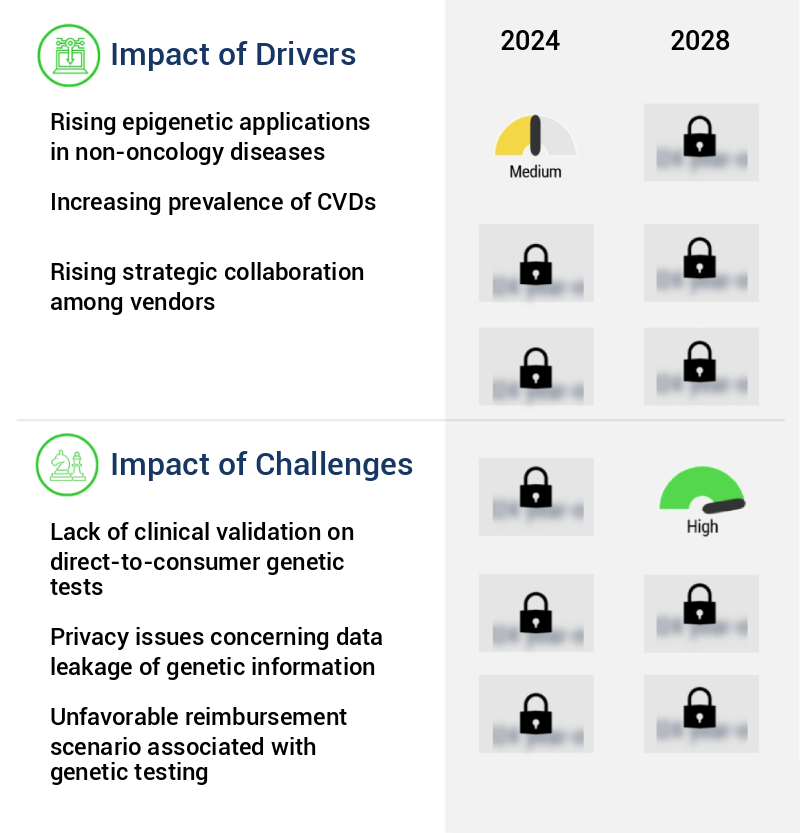
The surge in epigenetic applications, particularly in the context of non-oncology diseases, is the primary market driver.
- Epigenetics, a field of biology focusing on heritable changes in gene expression without altering the DNA sequence, is experiencing significant growth and expanding its reach beyond oncology. Environmental factors, including nutrition, stress, toxins, and infections, can induce epigenetic modifications, which play a crucial role in the development and progression of various non-oncological diseases. For instance, epigenetic changes have been linked to cardiovascular disease (CVD), diabetes, neurodegenerative disorders, and psychiatric disorders.
- In CVD, epigenetic modifications contribute to atherosclerosis, while in diabetes, they influence insulin resistance. Moreover, epigenetic alterations have been implicated in the pathogenesis of Alzheimer's disease. These findings underscore the importance of epigenetics in understanding and addressing the complexities of numerous health conditions.
Prevailing Industry Trends & Opportunities
The life sciences industry is experiencing a significant trend towards technological advances. This mandated adaptation is shaping the upcoming market.
- The market is experiencing significant growth due to the increasing demand for personalized medicine and the rising prevalence of chronic diseases worldwide. In the life sciences industry, enzyme technology has been a key driver, with advances in the production, isolation, purification, and utilization of enzymes for the synthesis of drugs, peptides, and proteins. Researchers are manipulating enzyme properties to achieve desired functions, such as enhanced kinetic features, thermal stability, and solvent compatibility, enabling the study of gene expression. This technology's applications extend to the pharmaceutical sector, where it is used to develop drugs for treating spinal injuries, rebuilding damaged nerve tissues, and addressing severe combined immunodeficiency (SCID).
- The market's evolution is marked by continuous innovation, with researchers and developers striving to optimize enzyme performance for improved therapeutic outcomes.
Significant Market Challenges
The lack of clinical validation poses a significant challenge to the growth of the direct-to-consumer genetic testing industry. This issue, which refers to the absence of rigorous scientific testing and approval by healthcare professionals, undermines the credibility and trustworthiness of these tests among consumers and healthcare providers alike. Consequently, addressing this challenge through increased regulatory oversight, standardized testing protocols, and collaboration between industry stakeholders is essential to fostering industry growth and ensuring the accuracy and reliability of direct-to-consumer genetic testing services.
- The market continues to evolve, expanding its reach across various sectors including healthcare, agriculture, and research. Epigenetic modifications, which alter gene expression without changing the DNA sequence, have emerged as crucial factors in disease development and progression. However, the commercialization of direct-to-consumer genetic tests faces challenges due to the ongoing debate regarding their clinical validity. These tests, while providing disease risk predictions, exclude critical environmental and lifestyle factors that significantly influence disease risk. As a result, consumers often rely on medical professionals and genetic counselors for reliable interpretation.
- According to a study, approximately 70% of consumers reported feeling unsure about their test results, emphasizing the need for expert guidance. Furthermore, a recent research project reported a 15% increase in diagnostic accuracy when epigenetic data was integrated with traditional genetic testing methods. This underscores the potential of epigenetics in enhancing the accuracy and completeness of risk assessments.
In-Depth Market Segmentation: Epigenetics Market
The epigenetics industry research report provides comprehensive data (region-wise segment analysis), with forecasts and estimates in "USD million" for the period 2024-2028, as well as historical data from 2018-2022 for the following segments.
- Application
- Oncology
- Non-oncology
- Cardiovascular Diseases
- Developmental Biology
- Immunology
- Metabolic Diseases
- Product
- Reagents
- Kits
- Enzymes
- Instruments
- Software
- Services
- others
- Technology
- DNA Methylation
- Histone Methylation
- Histone Acetylation
- Large non-coding RNA
- MicroRNA modification
- Chromatin structures
- Bisulfite Sequencing
- Next-Generation Sequencing (NGS)
- PCR-based Methods
- Chromatin Remodeling
- End-Use
- Academic Research
- Clinical Research
- Hospitals & Clinics
- Pharmaceutical & Biotechnology Companies
- Other
- Contract Research Organizations (CROs)
- Diagnostic Laboratories
- Geography
- North America
- US
- Canada
- Europe
- Germany
- Netherlands
- UK
- Middle East and Africa
- UAE
- APAC
- China
- Japan
- South Korea
- South America
- Brazil
- Rest of World (ROW)
- North America
By Application Insights
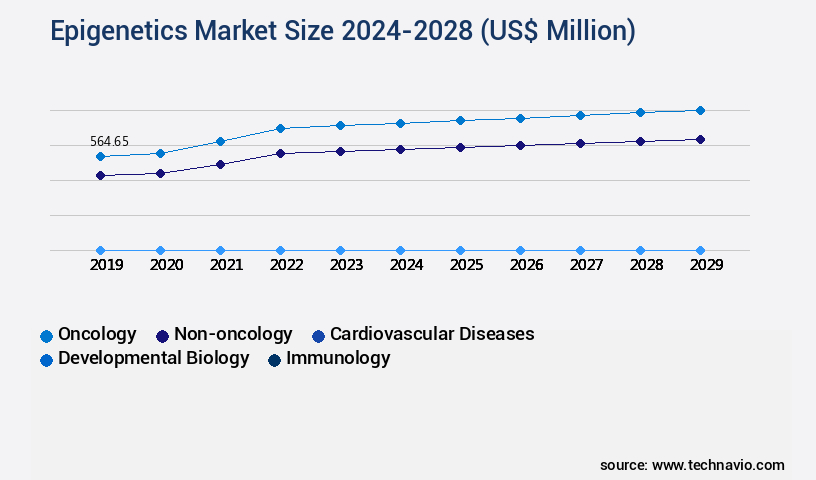
The oncology segment is estimated to witness significant growth during the forecast period.
The market continues to evolve as research advances in various areas, including epigenome editing, precision medicine, and cancer epigenetics. Epigenetic therapies, such as RNA interference, CRISPR-Cas systems, and histone modification, are increasingly used for gene silencing and expression regulation. Non-coding RNA plays a crucial role in epigenetic regulation, with long non-coding RNA and histone deacetylases influencing chromatin accessibility and gene activation. Epigenetic clocks, genome-wide association studies, and next-generation sequencing provide valuable data for understanding epigenetic inheritance and developmental biology. Toxicological epigenetics and environmental epigenetics are emerging fields that investigate the impact of external factors on epigenetic regulation.
Epigenetic biomarkers offer potential for early disease detection and diagnosis, with methylation-specific PCR (MSP) being an example for identifying abnormal methylation patterns in cancer. Approximately 70-80% of human diseases have an epigenetic component, making this field essential for understanding disease development and progression.
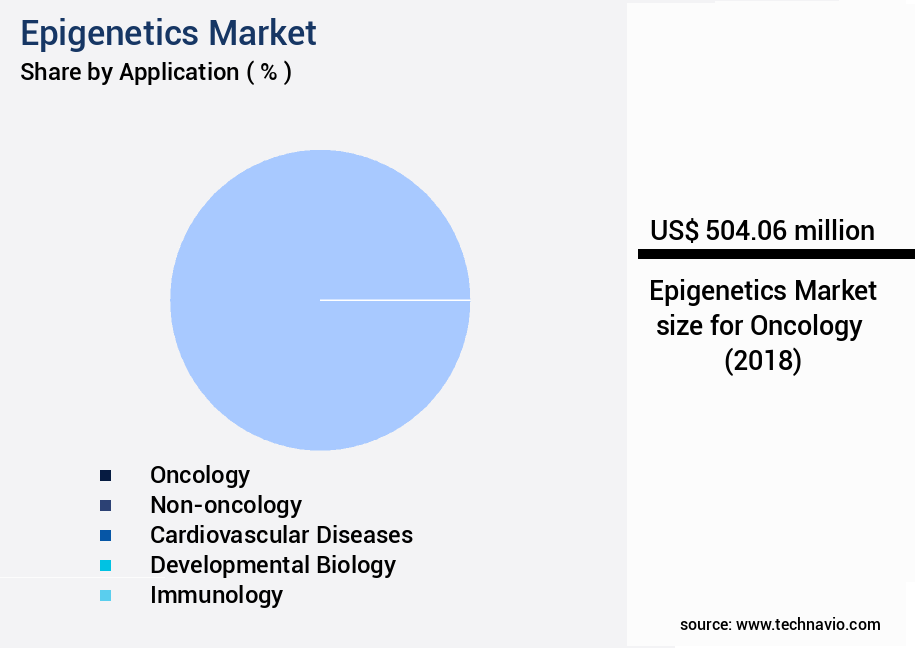
The Oncology segment was valued at USD 504.06 billion in 2018 and showed a gradual increase during the forecast period.
Regional Analysis
North America is estimated to contribute 39% to the growth of the global market during the forecast period.Technavio’s analysts have elaborately explained the regional trends and drivers that shape the market during the forecast period.
See How Epigenetics Market Demand is Rising in North America Request Free Sample
The market is experiencing significant growth, driven by the rising incidence of chronic diseases and increasing healthcare expenditure. With numerous biotechnology and life sciences companies headquartered in North America, particularly in the US and Canada, the region dominates the global market. These companies export epigenetics instruments to other regions, enabling emerging companies in Asia and South America to offer epigenetics services locally.
The high number of clinical trials in North America, accounting for 31% of the total worldwide as of February 2023 (NIH), further fuels the demand for epigenetics in drug development. This market's evolution is marked by operational efficiency gains and cost reductions, making epigenetics a crucial component in healthcare research and innovation.
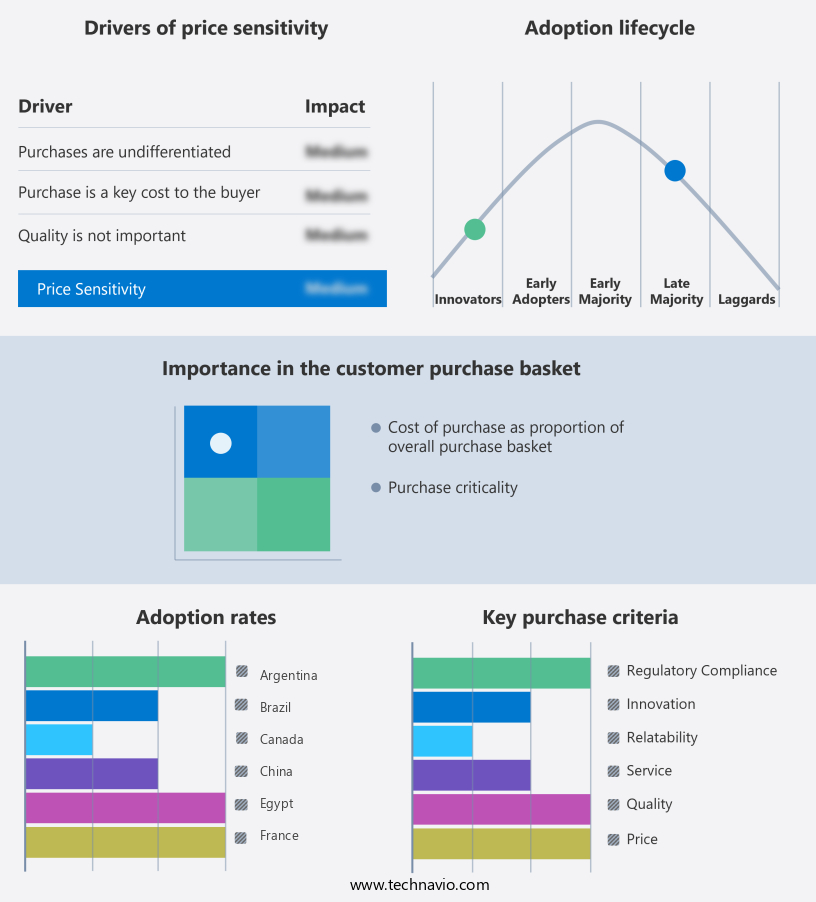
Customer Landscape of Epigenetics Industry
Competitive Intelligence by Technavio Analysis: Leading Players in the Epigenetics Market
Companies are implementing various strategies, such as strategic alliances, epigenetics market forecast, partnerships, mergers and acquisitions, geographical expansion, and product/service launches, to enhance their presence in the industry.
Abcam Plc - Epigenetics research is a specialized field focusing on modifications to gene expression without altering the DNA sequence itself. This approach offers valuable insights into biological processes and potential therapeutic applications. The company in question is a pioneer in this area, conducting comprehensive studies to advance scientific understanding and drive innovation.
The industry research and growth report includes detailed analyses of the competitive landscape of the market and information about key companies, including:
- Abcam Plc
- Active Motif Inc.
- Agilent Technologies Inc.
- Bio-Rad Laboratories Inc.
- CellCentric
- Chroma Therapeutics
- Diagenode (Hologic)
- EpiGentek Group Inc.
- F. Hoffmann-La Roche Ltd.
- Illumina Inc.
- Merck KGaA
- New England Biolabs
- PerkinElmer Inc.
- Promega Corporation
- Qiagen N.V.
- Syndax Pharmaceuticals
- Takara Bio Inc.
- Thermo Fisher Scientific Inc.
- Zymo Research Corporation
- ZymoGenetics Inc.
Qualitative and quantitative analysis of companies has been conducted to help clients understand the wider business environment as well as the strengths and weaknesses of key industry players. Data is qualitatively analyzed to categorize companies as pure play, category-focused, industry-focused, and diversified; it is quantitatively analyzed to categorize companies as dominant, leading, strong, tentative, and weak.
Recent Development and News in Epigenetics Market
- In January 2024, Merck KGaA, a leading player in the market, announced the launch of its new epigenetic modulator, Selumetinib, for the treatment of neurofibromatosis type 1 (NF1) patients with plexiform neurofibromas. This marks a significant step forward in the treatment of this debilitating condition (Merck KGaA Press Release, 2024).
- In March 2024, Illumina, a global leader in genomic sequencing and analysis, entered into a strategic partnership with Genome Medical, a telehealth practice specializing in genetic services. This collaboration aims to integrate epigenetic testing into Genome Medical's telehealth platform, expanding access to epigenetic services for patients (Illumina Press Release, 2024).
- In May 2025, Roche Holding AG, a prominent player in the diagnostics market, completed the acquisition of Genoptix Medical Laboratory, a leading provider of oncology and epigenetics testing services. This acquisition strengthens Roche's position in the market and enhances its diagnostic offerings (Roche Holding AG Press Release, 2025).
- In August 2025, the US Food and Drug Administration (FDA) granted marketing authorization to Epigenomics AG for its Tetra-Array technology, enabling the simultaneous detection of methylation markers for multiple cancer types. This approval marks a significant milestone in the market, as it paves the way for more accurate and efficient cancer diagnostics (Epigenomics AG Press Release, 2025).
Dive into Technavio’s robust research methodology, blending expert interviews, extensive data synthesis, and validated models for unparalleled Epigenetics Market insights. See full methodology.
|
Market Scope |
|
|
Report Coverage |
Details |
|
Page number |
163 |
|
Base year |
2023 |
|
Historic period |
2018-2022 |
|
Forecast period |
2024-2028 |
|
Growth momentum & CAGR |
Accelerate at a CAGR of 14.75% |
|
Market growth 2024-2028 |
USD 1477.78 million |
|
Market structure |
Fragmented |
|
YoY growth 2023-2024(%) |
13.54 |
|
Key countries |
US, Canada, Germany, UK, China, Japan, South Korea, Netherlands, UAE, Brazil, and Rest of World(ROW) |
|
Competitive landscape |
Leading Companies, Market Positioning of Companies, Competitive Strategies, and Industry Risks |
Why Choose Technavio for Epigenetics Market Insights?
"Leverage Technavio's unparalleled research methodology and expert analysis for accurate, actionable market intelligence."
The market is experiencing significant growth as research in this field continues to unravel the complex interplay between genetic and environmental factors in various biological processes. Histone modification patterns in cancer and DNA methylation in aging processes are key areas of focus, with epigenetic alterations implicated in the development and progression of these conditions. Non-coding RNA's role in development and its impact on chromatin remodeling and gene expression are also subjects of intense study. In neurodegenerative diseases, epigenetic drug targets are being explored to mitigate the effects of these conditions. Environmental factors, such as diet and toxins, are known to influence epigenetic changes, making it a critical area for research in understanding disease risk and prevention. The epigenome editing technologies and applications, including CRISPR-Cas9, are revolutionizing the field, enabling precise modifications to epigenetic marks. These advancements have significant implications for therapeutic applications, including epigenetic reprogramming in stem cells and clinical applications of epigenetic testing for early disease detection. Next-generation sequencing and bioinformatics tools are essential for epigenomic analysis, enabling the interpretation of vast amounts of data generated from epigenetic studies. Regulatory elements controlling gene expression and epigenetic modifications in response to toxins are areas of active research, with potential implications for compliance and operational planning in industries with significant environmental exposures. The impact of dietary compounds on epigenetic marks is another area of interest, with indirect comparisons suggesting that certain nutrients may influence epigenetic patterns in ways that promote health or disease. Epigenetic drug resistance mechanisms are also being studied, with potential implications for supply chain optimization in the pharmaceutical industry. In summary, the market is a dynamic and rapidly evolving field, with significant implications for healthcare, agriculture, and other industries. The ability to modify epigenetic marks offers a new frontier for disease prevention, treatment, and understanding the complex interplay between genetics and the environment.
What are the Key Data Covered in this Epigenetics Market Research and Growth Report?
-
What is the expected growth of the Epigenetics Market between 2024 and 2028?
-
USD 1.48 billion, at a CAGR of 14.75%
-
-
What segmentation does the market report cover?
-
The report is segmented by Application (Oncology, Non-oncology, Cardiovascular Diseases, Developmental Biology, Immunology, and Metabolic Diseases), Product (Reagents, Kits, Enzymes, Instruments, Software, Services, and others), Geography (North America, Europe, Middle East and Africa, Asia, South America, and Rest of World (ROW)), Technology (DNA Methylation, Histone Methylation, Histone Acetylation, Large non-coding RNA, MicroRNA modification, Chromatin structures, Bisulfite Sequencing, Next-Generation Sequencing (NGS), PCR-based Methods, and Chromatin Remodeling), and End-Use (Academic Research, Clinical Research, Hospitals & Clinics, Pharmaceutical & Biotechnology Companies, Other, Contract Research Organizations (CROs), and Diagnostic Laboratories)
-
-
Which regions are analyzed in the report?
-
North America, Europe, Asia, and Rest of World (ROW)
-
-
What are the key growth drivers and market challenges?
-
Rising epigenetic applications in non-oncology diseases, Lack of clinical validation on direct-to-consumer genetic tests
-
-
Who are the major players in the Epigenetics Market?
-
Abcam Plc, Active Motif Inc., Agilent Technologies Inc., Bio-Rad Laboratories Inc., CellCentric, Chroma Therapeutics, Diagenode (Hologic), EpiGentek Group Inc., F. Hoffmann-La Roche Ltd., Illumina Inc., Merck KGaA, New England Biolabs, PerkinElmer Inc., Promega Corporation, Qiagen N.V., Syndax Pharmaceuticals, Takara Bio Inc., Thermo Fisher Scientific Inc., Zymo Research Corporation, and ZymoGenetics Inc.
-
We can help! Our analysts can customize this epigenetics market research report to meet your requirements.
 RIA -
RIA - 
