
Equine Supplement Products Market Size 2025-2029
The equine supplement products market size is forecast to increase by USD 26,702.6 thousand at a CAGR of 4.6% between 2024 and 2029.
- The market is experiencing significant growth, driven by the increasing focus on equine productivity and performance. This trend is being fueled by the rapid adoption of information systems in veterinary healthcare, enabling more accurate diagnosis and personalized treatment plans for horses. However, regulatory concerns associated with manufacturing equine supplement products pose a challenge. Stringent regulations governing the production and labeling of these supplements can increase costs and slow down market entry for new players. Additionally, supply chain inconsistencies, including sourcing of raw materials and logistical challenges, can temper growth potential. Horse owners and trainers are seeking ways to optimize their animals' health and enhance their competitive edge. Another growth factor is the rapid adoption of information systems in veterinary healthcare.
- Companies seeking to capitalize on market opportunities must navigate these challenges effectively. Strategies such as investing in research and development to meet regulatory requirements and building robust supply chain networks can help mitigate these obstacles and ensure long-term success in the market.
What will be the Size of the Equine Supplement Products Market during the forecast period?

- The market caters to the diverse health needs of horses, focusing on areas such as healthy aging, athletic performance, and immune system support. Ethical sourcing and ingredient transparency are increasingly important trends, ensuring the safety and efficacy of horse feed and supplements. Digestive support and muscle building are key areas of interest for horse caretakers, with many products offering joint support for horses in active training. Inflammation reduction and hoof care are essential for maintaining equine health, while veterinary approval and third-party testing ensure product safety. Sustainable practices and animal welfare are also crucial considerations in the market, with a growing emphasis on absorption rate and skin health. Veterinary hospitals and racing stables are major consumers of equine health products, which include amino acid supplements, micro nutrients, digestive health supplements, and joint health supplements.
- Equine nutrition plays a vital role in performance improvement, with many supplements offering ingredients for inflammation reduction, recovery time, hair growth, and hoof care. Joint support and safety and efficacy are paramount for horses in breeding programs, making equine supplements an integral part of their care.
How is this Equine Supplement Products Industry segmented?
The equine supplement products industry research report provides comprehensive data (region-wise segment analysis), with forecasts and estimates in "USD thousand" for the period 2025-2029, as well as historical data from 2019-2023 for the following segments.
- Application
- Joint health
- Performance enhancement and recovery
- Others
- Type
- Vitamins
- Minerals and electrolytes
- Amino acids and proteins
- Others
- End-user
- Veterinary hospital pharmacies
- Retail pharmacies
- Geography
- North America
- US
- Canada
- Europe
- France
- Germany
- Italy
- UK
- APAC
- Australia
- China
- India
- Japan
- Rest of World (ROW)
- North America
By Application Insights
The joint health segment is estimated to witness significant growth during the forecast period. Equine supplements play a crucial role in the health and wellbeing of athletic horses, show horses, senior horses, and recreational horses. Horse trainers and equine nutritionists collaborate to formulate scientifically-backed supplements that address various equine health concerns. Joint health is a significant focus, with supplements designed to combat inflammation, lessen cartilage damage, and promote cartilage healing. Glucosamine and chondroitin, both with an extensive history of usage, are common substances in joint supplements. Recent research suggests that their synergistic effects yield more benefits than using them separately. Glucosamine, a naturally occurring substance in healthy cartilage, works in conjunction with sodium hyaluronate, a glycosaminoglycan that gives joint fluid its viscosity and is essential for joint health.
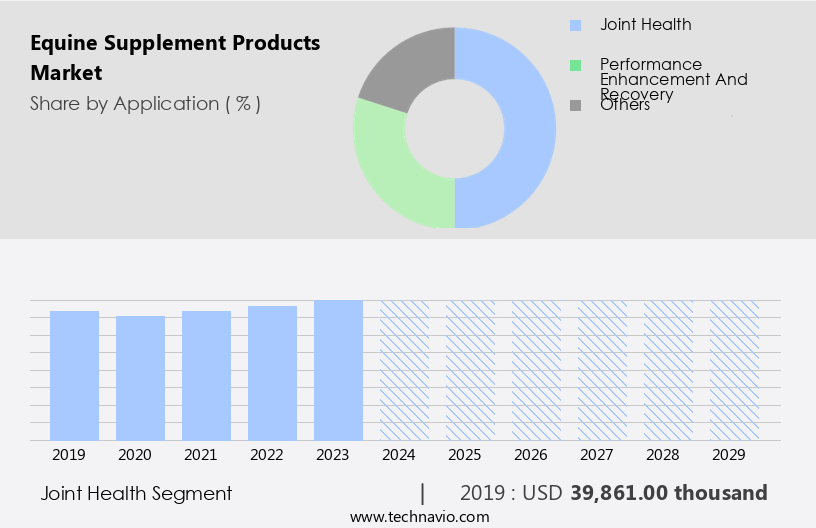
The Joint health segment was valued at USD 39,861.00 thousand in 2019 and showed a gradual increase during the forecast period. The US government regulates animal vitamins, feed additives, and pharmaceuticals, ensuring their safety, purity, potency, and effectiveness for equine use. The molecular weight of sodium hyaluronate formulations influences their ability to promote synovial fluid viscosity and aid digestion. Immune support, hoof health, coat health, performance enhancement, and digestive health are other areas where equine supplements contribute significantly. Glucosamine and chondroitin are commonly used substances in equine joint supplements, with evidence suggesting greater benefits when used in combination. Natural ingredients, such as omega-3 fatty acids, vitamin C, vitamin E, and trace minerals, are often incorporated into supplements to optimize equine performance and wellness. Manufacturers prioritize quality control, dosage recommendations, and scientific formulation to ensure the efficacy and safety of their products. Ingredient sourcing and manufacturing processes are carefully considered to maintain the highest standards.
Regional Analysis
North America is estimated to contribute 37% to the growth of the global market during the forecast period. Technavio's analysts have elaborately explained the regional trends and drivers that shape the market during the forecast period.

In the equine supplement market, North America, specifically the US, holds a significant position due to the presence of leading companies like Zoetis and Land O Lakes. These entities are dedicated to innovating equine supplement products, improving horse health and well-being. Government initiatives, such as regulations ensuring animal health and safety, further bolster the regional market. The US government regulates vitamins, feed additives, and pharmaceuticals for animals, including equines, through two federal agencies. Equine supplements come in various forms, including vitamins, minerals, herbal supplements, electrolytes, enzymes, amino acids, and proteins. These agencies work to maintain the safety, purity, potency, and effectiveness of these products. Equine nutritionists and horse trainers emphasize the importance of immune support, hoof health, and competition preparation.
Product formulation includes natural ingredients like vitamin C for coat health, omega-3 fatty acids for joint health, and herbal supplements for muscle recovery and performance optimization. Feed manufacturers prioritize scientific research and clinical trials to develop scientifically formulated supplements. Vitamins such as Vitamin A and Vitamin D are essential for vision, immunological function, and bone health. Equine care encompasses digestive health, senior horses, and recreational horses. Synergistic effects of trace minerals and proprietary blends contribute to overall performance enhancement. Quality control and dosage recommendations are crucial aspects of manufacturing processes.
Market Dynamics
Our researchers analyzed the data with 2024 as the base year, along with the key drivers, trends, and challenges. A holistic analysis of drivers will help companies refine their marketing strategies to gain a competitive advantage.
What are the Equine Supplement Products market drivers leading to the rise in the adoption of Industry?
- The primary focus on enhancing equine productivity and performance is the primary market trend, with professionals and industry experts placing significant emphasis on this area. Equine supplement products play a crucial role in the health and performance of athletic horses, with horse trainers and equine nutritionists relying on these supplements to optimize equine well-being. The market for equine supplements has experienced significant growth due to the increasing focus on enhancing equine productivity and fitness. These supplements, available in various forms such as digestion aids, vitamins, minerals, and behavioral supplements, contribute to improved growth rates, better feed conversion ratios, and superior reproductive performance in horses. Vitamin A, for instance, supports vision and immunological function, while vitamin D aids in calcium absorption for bone health, and vitamin E functions as an antioxidant.
- Hoof health is another essential area where equine supplements make a difference, with biotin and other essential nutrients helping to strengthen hooves and prevent cracks and other issues. Clinical trials and scientific research continue to uncover new benefits of equine supplements, further bolstering their importance in the equine industry. As the demand for show horses and breeding horses grows, so too does the need for effective and scientifically-backed equine supplements to maintain their health and performance.
What are the Equine Supplement Products market trends shaping the Industry?
- The trend in veterinary healthcare is characterized by the rapid adoption of advanced information systems. This includes the implementation of electronic health records, telemedicine platforms, and other digital solutions to enhance the efficiency and quality of veterinary care. Equine supplement products play a significant role in horse management, with horse owners seeking to enhance their animals' health and performance. Feed manufacturers continue to innovate, offering a range of supplements containing essential nutrients like Vitamin C and Omega-3 fatty acids. These nutrients contribute to coat health, competition preparation, and overall equine care. The demand for natural ingredients in equine care is on the rise, with many horse owners preferring supplements derived from organic sources. The use of IT systems in veterinary practices has facilitated remote consultations, enabling veterinarians to advise horse owners more effectively, regardless of their locations.
- This trend is expected to continue, as veterinarians adapt to the digital age and meet the evolving needs of horse owners. The equine supplement market is driven by the growing awareness of the importance of proper nutrition and health management for horses. The integration of technology in veterinary practices further enhances the ability to provide effective and efficient care, ensuring horses remain healthy and perform at their best.
How does Equine Supplement Products market faces challenges face during its growth?
- The growth of the equine supplement industry is significantly impacted by regulatory concerns surrounding the manufacturing of these products. It is essential to adhere to stringent regulations to ensure product safety and efficacy, which can add complexity and cost to the production process. Compliance with these regulations is a critical challenge that industry players must address to maintain consumer trust and expand their market reach. The market is subject to intricate regulatory frameworks established by various government agencies and regulatory bodies. Equine supplements, categorized as animal supplements, are subject to regulations governing both food and medication in the US.
- The Federal Food, Drug and Cosmetic Act (the Act), the Food and Drug Administration (FDA), and the Center for Veterinary Medicine (CVM) oversee the development, manufacturing, distribution, and use of these supplements to ensure their safety, efficacy, and quality. Vitamin E, joint health, muscle recovery, performance optimization, trace minerals, and proprietary blends are common ingredients in equine supplements. Herbal supplements are also gaining popularity for their potential health benefits. Manufacturing processes must adhere to strict quality control standards to maintain consistency and purity. Regulatory compliance is essential for market entry and maintaining a reputable brand. Companies invest in research and development to create innovative, effective, and safe supplements. The emphasis on quality and transparency is crucial for building trust with consumers and ensuring the long-term success of businesses in this market.
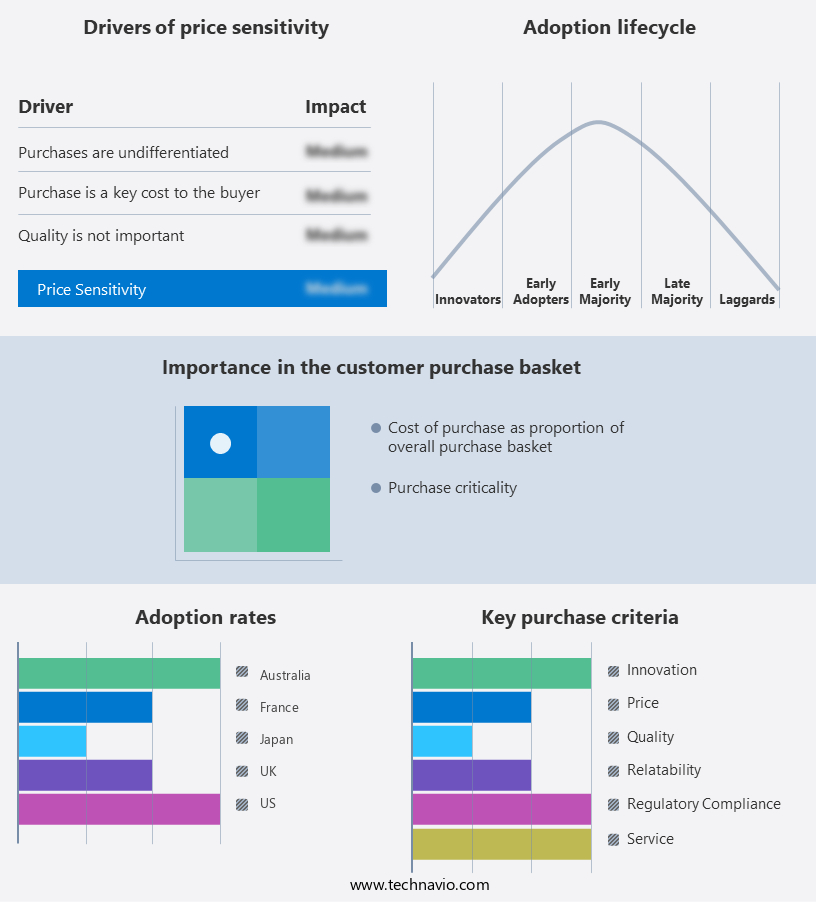
Exclusive Customer Landscape
The equine supplement products market forecasting report includes the adoption lifecycle of the market, covering from the innovator's stage to the laggard's stage. It focuses on adoption rates in different regions based on penetration. Furthermore, the equine supplement products market report also includes key purchase criteria and drivers of price sensitivity to help companies evaluate and develop their market growth analysis strategies.
Customer Landscape
Key Companies & Market Insights
Companies are implementing various strategies, such as strategic alliances, equine supplement products market forecast, partnerships, mergers and acquisitions, geographical expansion, and product/service launches, to enhance their presence in the industry.
Alltech Inc. - The company specializes in the production of top-tier equine supplements, catering to the unique nutritional requirements of horses.
The industry research and growth report includes detailed analyses of the competitive landscape of the market and information about key companies, including:
- Alltech Inc.
- ARK Equine
- Boehringer Ingelheim International GmbH
- Daniel Baum Co. Inc.
- Equine America UK Ltd.
- Equine Products UK LTD.
- Hagyard Equine Medical Institute
- Horse Guard
- Kentucky Equine Research
- Kentucky Performance Products
- Lallemand Inc.
- Land O Lakes Inc.
- Plusvital Ltd.
- Science Supplements UK
- Seahorse Supplements
- Swedencare AB
- Vetoquinol SA
- Virbac Group
- Vitapower Ltd.
- Zoetis Inc.
Qualitative and quantitative analysis of companies has been conducted to help clients understand the wider business environment as well as the strengths and weaknesses of key industry players. Data is qualitatively analyzed to categorize companies as pure play, category-focused, industry-focused, and diversified; it is quantitatively analyzed to categorize companies as dominant, leading, strong, tentative, and weak.
Recent Development and News in Equine Supplement Products Market
- In February 2023, Nutramax Laboratories, a leading supplier of nutritional supplements for horses, launched a new line of equine supplements called Cosequin DS Plus. This innovative product combines glucosamine, MSM, and hyaluronan to support joint health and mobility in horses (Nutramax Laboratories, 2023).
- In June 2024, Boehringer Ingelheim Animal Health and Zoetis, two major players in the equine health market, announced a strategic partnership to co-promote each other's products in the United States. This collaboration aims to enhance their market presence and provide a more comprehensive range of solutions to horse owners (Boehringer Ingelheim, 2024).
- In October 2024, SmartPak Equine, a leading provider of horse supplements, completed a significant funding round of USD50 million. This investment will be used to expand their product offerings, enhance their digital services, and strengthen their market position (SmartPak Equine, 2024).
- In March 2025, the European Commission approved the use of selenium yeast as an equine feed additive. This approval opens up new opportunities for companies producing selenium yeast and is expected to drive growth in the European equine supplement market (European Commission, 2025).
Research Analyst Overview
The market continues to evolve, with dynamic market activities unfolding across various sectors. Horse owners and trainers seek innovative solutions to enhance their athletic horses' performance, immune support, hoof health, and overall well-being. Equine nutritionists collaborate with feed manufacturers to develop scientifically formulated supplements, integrating natural ingredients like vitamin C, omega-3 fatty acids, and vitamin E. Clinical trials and scientific research are at the forefront of product formulation, ensuring the effectiveness and safety of these supplements. Breeding horses, show horses, and recreational horses all benefit from these advancements, with competition preparation and performance enhancement being key areas of focus. Manufacturing processes prioritize quality control and dosage recommendations, ensuring the synergistic effects of proprietary blends and trace minerals are optimally harnessed.
Joint health, muscle recovery, and digestive health are other essential aspects of equine care addressed by these supplements. Organic ingredients and herbal supplements are increasingly popular, reflecting the growing emphasis on natural solutions for horse health. Senior horses also benefit from these supplements, with a focus on maintaining their vitality and overall well-being. The equine supplement market's continuous evolution underscores its importance in the equine industry, as horse owners and professionals strive to provide the best possible care for their animals.
Dive into Technavio's strong research methodology, blending expert interviews, extensive data synthesis, and validated models for unparalleled Equine Supplement Products Market insights. See full methodology.
|
Market Scope |
|
|
Report Coverage |
Details |
|
Page number |
212 |
|
Base year |
2024 |
|
Historic period |
2019-2023 |
|
Forecast period |
2025-2029 |
|
Growth momentum & CAGR |
Accelerate at a CAGR of 4.6% |
|
Market growth 2025-2029 |
USD 26,702.6 thousand |
|
Market structure |
Fragmented |
|
YoY growth 2024-2025(%) |
4.4 |
|
Key countries |
US, Canada, UK, France, Japan, Germany, India, China, Italy, and Australia |
|
Competitive landscape |
Leading Companies, Market Positioning of Companies, Competitive Strategies, and Industry Risks |
What are the Key Data Covered in this Equine Supplement Products Market Research and Growth Report?
- CAGR of the Equine Supplement Products industry during the forecast period
- Detailed information on factors that will drive the growth and forecasting between 2025 and 2029
- Precise estimation of the size of the market and its contribution of the industry in focus to the parent market
- Accurate predictions about upcoming growth and trends and changes in consumer behaviour
- Growth of the market across North America, Europe, Asia, and Rest of World (ROW)
- Thorough analysis of the market's competitive landscape and detailed information about companies
- Comprehensive analysis of factors that will challenge the equine supplement products market growth of industry companies
We can help! Our analysts can customize this equine supplement products market research report to meet your requirements.
 RIA -
RIA - 
