Equity Management Software Market Analysis North America, Europe, APAC, South America, Middle East and Africa - US, UK, China, India, Germany - Size and Forecast 2024-2028

Equity Management Software Market Analysis North America, Europe, APAC, South America, Middle East and Africa - US, UK, China, India, Germany - Size and Forecast 2024-2028

Published: Jul 2024 152 Pages SKU: IRTNTR73268

Market Overview at a Glance

$547.5 Mn
Market Opportunity
18.51%
CAGR
15.88
YoY growth 2023-2024(%)

Equity Management Software Market Size 2024-2028 

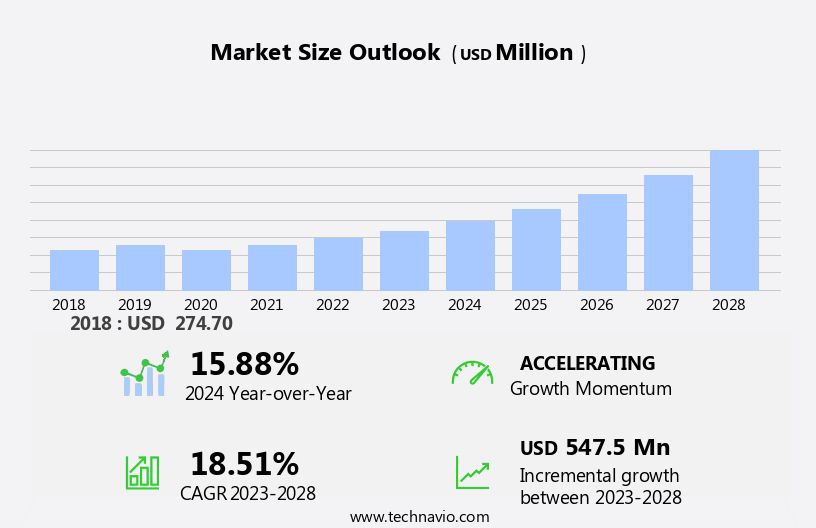
The equity management software market size is forecast to increase by USD 547.5 billion at a CAGR of 18.51% between 2023 and 2028.

  • Equity management software has become an essential tool for institutions and high-net-worth individuals (HNWIs) to manage their investments effectively. The market is driven by several factors, including the increasing number of HNWIs worldwide and the availability of open-source solutions. These factors have led to a surge in demand for advanced equity management software. One significant trend in the market is the integration of healthcare-related features, such as monitoring for potential blood clots and thrombosis, which can be life-threatening during surgery. These features help prevent complications and ensure the protection of vital organs. Additionally, the software is increasingly being used to manage blood loss during surgeries and perform various diagnostic tests related to blood clots. Furthermore, ensuring data security and privacy is a major concern for users, particularly in the healthcare sector. Despite these challenges, the market is expected to grow significantly due to the increasing demand for efficient and effective investment management solutions.

What will the size of the market be during the forecast period?

Equity Management Software Market Size

 Request Free Sample

  • The market is a significant segment in the healthcare industry, providing solutions to manage the financial aspects of hospitals and healthcare organizations. This software plays a crucial role in ensuring the efficient and effective use of resources, particularly in the context of surgeries and blood management. Hospitals face numerous challenges in managing their financial resources, especially during surgeries. The use of blood products and management of blood clots is a critical area where hospitals require strong financial management. Thrombosis, a condition characterized by the formation of blood clots, poses a significant risk during surgeries. Extracorporeal membrane oxygenation (ECMO) and extracorporeal membrane oxidation (ECMO) are common procedures used to treat various conditions, including thromboembolism. Equity management software assists hospitals in managing the financial implications of these procedures. It helps in tracking the usage and inventory of blood products, monitoring antithrombin antigen levels, and conducting activity assays and immunological assays.
  • By providing real-time insights into the financial implications of thrombosis, equity management software helps hospitals in making informed decisions and optimizing their resources. In conclusion, equity management software is an essential tool for hospitals in managing their financial resources, particularly in the context of surgeries and blood management. It helps in tracking the usage and inventory of blood products, monitoring antithrombin antigen levels, and managing the financial implications of blood clots and thrombosis. By optimizing their financial resources, hospitals can improve their operational efficiency, reduce costs, and enhance patient care.

How is this market segmented and which is the largest segment?

The market research report provides comprehensive data (region-wise segment analysis), with forecasts and estimates in "USD million" for the period 2024-2028, as well as historical data from 2018-2022 for the following segments.
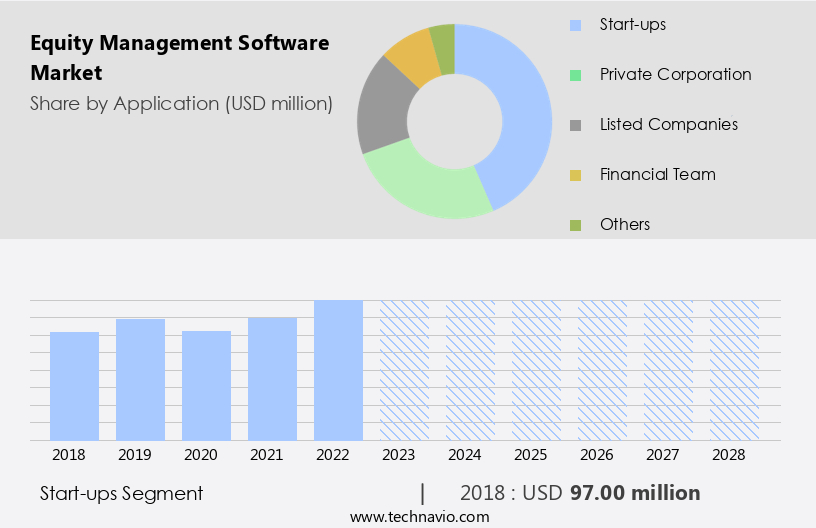
  • Application
    • Start-ups
    • Private corporation
    • Listed companies
    • Financial team
    • Others
  • Geography
    • North America
      • US
    • Europe
      • Germany
      • UK
    • APAC
      • China
      • India
    • South America
    • Middle East and Africa

By Application Insights

  • The start-ups segment is estimated to witness significant growth during the forecast period.

Equity management software is a valuable tool for businesses, particularly in the healthcare industry, where accurate tracking of assets is crucial. This software enables effective control of all equity-related activities, ensuring quality and streamlining workflows. Its deployment is swift and requires minimal initial investment, making it accessible to start-ups. The increasing popularity of cloud-based solutions is driving the market's growth, as they offer several advantages over traditional methods. Cloud-based equity management software provides predictable expenses, eliminating the need for a powerful local server and maintenance fees. Additionally, it significantly reduces IT personnel costs and offers free upgrades as part of the subscription or support fees.

This platform is ideal for start-ups requiring a centralized source to share updated information. In the medical field, this software plays a vital role in managing and preventing conditions such as thrombosis and blood clots, which can lead to complications like blood loss and damage to vital organs during surgery. By utilizing advanced tests to monitor and manage blood clots, these tools contribute to improved patient outcomes and overall efficiency in healthcare operations.

Equity Management Software Market Size

Get a glance at the market report of share of various segments Request Free Sample

The Start-ups segment was valued at USD 97.00 million in 2018 and showed a gradual increase during the forecast period.

Regional Analysis

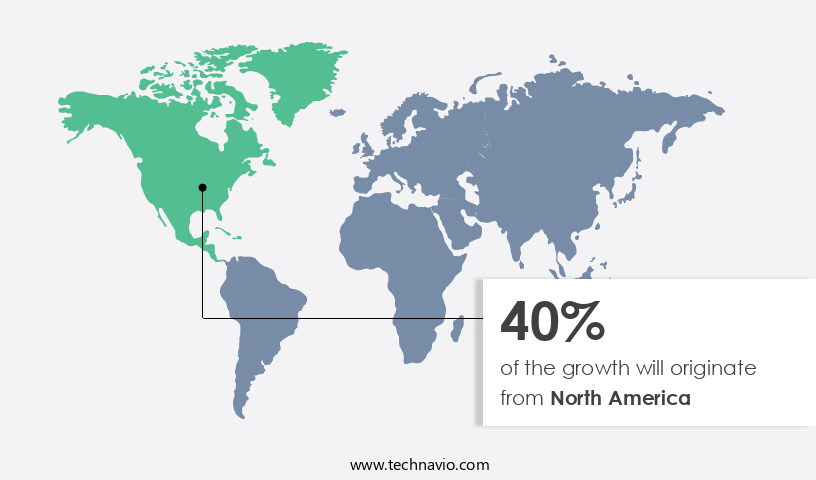
  • North America is estimated to contribute 40% to the growth of the global market during the forecast period.

Technavio's analysts have elaborately explained the regional trends and drivers that shape the market during the forecast period.

Equity Management Software Market Share by Geography

For more insights on the market share of various regions Request Free Sample

In North America, the equities management software market is experiencing significant growth due to the increasing importance of efficient supply chain management and global trade compliance in an uncertain regulatory environment. The collapse of the Trans-Pacific Partnership and potential modifications to the North American Free Trade Agreement, as well as the US redefining its trade relationships with China, are altering trade dynamics in the region. Despite these political changes, North American enterprises continue to expand their business globally. To mitigate the potential negative effects of shifting trade regulations, they are turning to equity management automation through trade management software. This technology enables them to streamline their operations, enhance transparency, and ensure regulatory compliance.

Additionally, the therapeutic segment of the equities management software market, which includes applications for managing blood clotting disorders such as Antithrombin Deficiency, is expected to grow due to the increasing prevalence of genetic disorders and the need for effective treatments, including goat milk and lyophilized antithrombin.

Market Dynamics

Our researchers analyzed the data with 2023 as the base year, along with the key drivers, trends, and challenges. A holistic analysis of drivers will help companies refine their marketing strategies to gain a competitive advantage.

What are the key market drivers leading to the rise in adoption of Equity Management Software Market ?

Vendors pricing strategies is the key driver of the market.

  • In today's competitive market, companies are adopting customer-focused pricing strategies to meet the unique needs and value perceptions of their clients. These pricing models vary based on the differentiating features and added value of software solutions. Economic and market factors, such as return on investment (ROI), availability of free models, and limited IT budgets, are crucial considerations for customers during software implementation. companies must accommodate diverse customer pricing preferences and budgets, leading to a reevaluation of software pricing and delivery models.
  • For instance, in the healthcare sector, software for managing procedures related to Thromboembolism, Extracorporeal membrane oxygenation, and monitoring Antithrombin antigen levels may require customized pricing due to the critical nature of these applications. companies offering activity assays and immunological assays may also need to consider tailored pricing strategies to cater to the specific requirements of hospitals and clinics. By offering flexible pricing models, companies can build strong customer relationships and gain a competitive edge in the market.

What are the market trends shaping the Equity Management Software Market?

The rising number of high-net-worth individuals (HNWIs) globally is the upcoming trend in the market.

  • High net worth individuals (HNWIs), defined as those with a net worth of over USD1 million, have seen a significant increase in number worldwide. These affluent individuals seek exclusive investment opportunities, such as private equity and hedge funds, and pre-IPO placements or pre-ICO sales. Managing their substantial financial portfolios necessitates the assistance of skilled wealth managers or advisors. These professionals specialize in wealth management, estate planning, asset protection, and tax strategies to ensure HNWIs maximize their investments and minimize risk. For instance, Acta Haematologica, a leading hematology journal, and the British Heart Foundation have highlighted the importance of effective equity management for individuals with hereditary antithrombin deficiency and AT III deficiency.
  • Octapharma, a global healthcare company, offers treatments for these conditions, underscoring the importance of strategic investment in healthcare. Furthermore, research in Frontiers in Neurology and the SERPINC1 gene has shown the potential for new therapies and treatments, further emphasizing the need for HNWIs to stay informed and invest wisely. By partnering with experienced wealth managers, HNWIs can make informed decisions and optimize their financial portfolios.

What challenges does Equity Management Software Market face during the growth?

Increasing availability of open-source solutions is a key challenge affecting the market growth.

  • Open-source equity management software offers organizations an efficient solution for managing their assets without the need for substantial upfront investment. Small businesses are the primary adopters of this cost-effective alternative to licensed asset management software. Cross-industry collaborations and ecosystem partnerships are fostering the growth of this market. By adopting open-source asset management software, businesses can reduce their expenses on initial investments and optimize their asset utilization.

Exclusive Customer Landscape

The market forecasting report includes the adoption lifecycle of the market, covering from the innovator's stage to the laggard's stage. It focuses on adoption rates in different regions based on penetration. Furthermore, the market report also includes key purchase criteria and drivers of price sensitivity to help companies evaluate and develop their market growth analysis strategies.
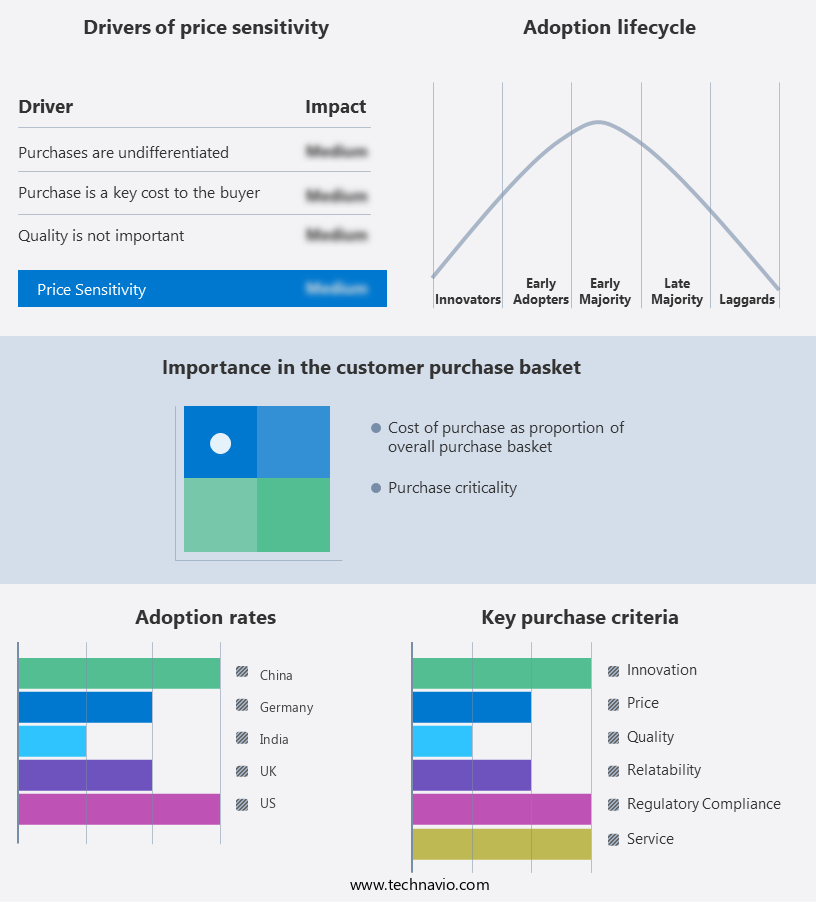
Equity Management Software Market Share by Geography

 Customer Landscape

Key Companies & Market Insights

Companies are implementing various strategies, such as strategic alliances, market forecast, partnerships, mergers and acquisitions, geographical expansion, and product/service launches, to enhance their presence in the market.

The market research and growth report includes detailed analyses of the competitive landscape of the market and information about key companies, including:

  • Altvia Solutions LLC
  • bobsguide
  • By Global Shares
  • Capdesk
  • Computershare Ltd.
  • Diligent Corp.
  • Dynamo Software Inc.
  • Equiniti Group
  • Eqvista Inc.
  • eShares Inc. DBA Carta Inc.
  • Euronext N.V.
  • GS Topco GP LLC
  • Gust Inc.
  • HighCastle
  • Imagineer Technology Group LLC
  • Ledgy AG
  • Papaya Global Ltd.
  • Prolific Labs Inc.
  • Qapita Corp.
  • Vestd Ltd.

Qualitative and quantitative analysis of companies has been conducted to help clients understand the wider business environment as well as the strengths and weaknesses of key market players. Data is qualitatively analyzed to categorize companies as pure play, category-focused, industry-focused, and diversified; it is quantitatively analyzed to categorize companies as dominant, leading, strong, tentative, and weak.

Research Analyst Overview

Equity management software plays a crucial role in the healthcare industry, particularly in managing and monitoring various clotting disorders, including antithrombin deficiencies and at I III deficiencies. These disorders can lead to severe complications such as blood clots, thrombosis, and even death during surgeries or in cases of septic shock. The market for equity management software in this domain is driven by the therapeutic segment, which includes the development and use of drugs to treat these conditions. The protein deficiencies associated with these disorders can be diagnosed through various tests, including activity assays and immunological assays. The importance of effective equity management in this context cannot be overstated, as timely and accurate diagnosis and treatment are vital for ensuring patient safety during hospital procedures and surgeries.

Moreover, cross-industry collaborations and ecosystem partnerships are increasingly driving innovation in the field, leading to the development of point-of-care testing devices and mobile testing apps. Equity management software also plays a crucial role in managing the production and distribution of antithrombin, which is often derived from goat milk and available in lyophilized form. This protein plays a vital role in preventing blood clotting and is essential for the effective treatment of various clotting disorders. In summary, equity management software is a critical tool for managing and monitoring various clotting disorders, ensuring patient safety during healthcare procedures, and driving innovation in the development of new treatments and diagnostic tools.

Market Scope

Report Coverage

Details

Page number

152

Base year

2023

Historic period

2018-2022

Forecast period

2024-2028

Growth momentum & CAGR

Accelerate at a CAGR of 18.51%

Market growth 2024-2028

USD 547.5 million

Market structure

Fragmented

YoY growth 2023-2024(%)

15.88

Key countries

US, UK, China, India, and Germany

Competitive landscape

Leading Companies, Market Positioning of Companies, Competitive Strategies, and Industry Risks

Request Free Sample

What are the Key Data Covered in this Market Research and Growth Report?

  • CAGR of the market during the forecast period
  • Detailed information on factors that will drive the market growth and forecasting between 2024 and 2028
  • Precise estimation of the size of the market  and its contribution of the market in focus to the parent market
  • Accurate predictions about upcoming market growth and trends and changes in consumer behaviour
  • Growth of the market across North America, Europe, APAC, South America, and Middle East and Africa
  • Thorough analysis of the market's competitive landscape and detailed information about companies
  • Comprehensive analysis of factors that will challenge the growth of market companies

We can help! Our analysts can customize this market research report to meet your requirements. Get in touch

1 Executive Summary

  • 1.1 Market overview
    • Executive Summary - Chart on Market Overview
    • Executive Summary - Data Table on Market Overview
    • Executive Summary - Chart on Global Market Characteristics
    • Executive Summary - Chart on Market by Geography
    • Executive Summary - Chart on Market Segmentation by Application
    • Executive Summary - Chart on Incremental Growth
    • Executive Summary - Data Table on Incremental Growth
    • Executive Summary - Chart on Company Market Positioning

2 Market Landscape

  • 2.1 Market ecosystem
    • Parent Market
    • Data Table on - Parent Market
  • 2.2 Market characteristics
    • Market characteristics analysis
  • 2.3 Value chain analysis
    • Value Chain Analysis

3 Market Sizing

  • 3.1 Market definition
    • Offerings of companies included in the market definition
  • 3.2 Market segment analysis
    • Market segments
  • 3.3 Market size 2023
    • 3.4 Market outlook: Forecast for 2023-2028
      • Chart on Global - Market size and forecast 2023-2028 ($ million)
      • Data Table on Global - Market size and forecast 2023-2028 ($ million)
      • Chart on Global Market: Year-over-year growth 2023-2028 (%)
      • Data Table on Global Market: Year-over-year growth 2023-2028 (%)

    4 Historic Market Size

    • 4.1 Global Equity Management Software Market 2018 - 2022
      • Historic Market Size - Data Table on Global Equity Management Software Market 2018 - 2022 ($ million)
    • 4.2 Application segment analysis 2018 - 2022
      • Historic Market Size - Application Segment 2018 - 2022 ($ million)
    • 4.3 Geography segment analysis 2018 - 2022
      • Historic Market Size - Geography Segment 2018 - 2022 ($ million)
    • 4.4 Country segment analysis 2018 - 2022
      • Historic Market Size - Country Segment 2018 - 2022 ($ million)

    5 Five Forces Analysis

    • 5.1 Five forces summary
      • Five forces analysis - Comparison between 2023 and 2028
    • 5.2 Bargaining power of buyers
      • Bargaining power of buyers - Impact of key factors 2023 and 2028
    • 5.3 Bargaining power of suppliers
      • Bargaining power of suppliers - Impact of key factors in 2023 and 2028
    • 5.4 Threat of new entrants
      • Threat of new entrants - Impact of key factors in 2023 and 2028
    • 5.5 Threat of substitutes
      • Threat of substitutes - Impact of key factors in 2023 and 2028
    • 5.6 Threat of rivalry
      • Threat of rivalry - Impact of key factors in 2023 and 2028
    • 5.7 Market condition
      • Chart on Market condition - Five forces 2023 and 2028

    6 Market Segmentation by Application

    • 6.1 Market segments
      • Chart on Application - Market share 2023-2028 (%)
      • Data Table on Application - Market share 2023-2028 (%)
    • 6.2 Comparison by Application
      • Chart on Comparison by Application
      • Data Table on Comparison by Application
    • 6.3 Start-ups - Market size and forecast 2023-2028
      • Chart on Start-ups - Market size and forecast 2023-2028 ($ million)
      • Data Table on Start-ups - Market size and forecast 2023-2028 ($ million)
      • Chart on Start-ups - Year-over-year growth 2023-2028 (%)
      • Data Table on Start-ups - Year-over-year growth 2023-2028 (%)
    • 6.4 Private corporation - Market size and forecast 2023-2028
      • Chart on Private corporation - Market size and forecast 2023-2028 ($ million)
      • Data Table on Private corporation - Market size and forecast 2023-2028 ($ million)
      • Chart on Private corporation - Year-over-year growth 2023-2028 (%)
      • Data Table on Private corporation - Year-over-year growth 2023-2028 (%)
    • 6.5 Listed companies - Market size and forecast 2023-2028
      • Chart on Listed companies - Market size and forecast 2023-2028 ($ million)
      • Data Table on Listed companies - Market size and forecast 2023-2028 ($ million)
      • Chart on Listed companies - Year-over-year growth 2023-2028 (%)
      • Data Table on Listed companies - Year-over-year growth 2023-2028 (%)
    • 6.6 Financial team - Market size and forecast 2023-2028
      • Chart on Financial team - Market size and forecast 2023-2028 ($ million)
      • Data Table on Financial team - Market size and forecast 2023-2028 ($ million)
      • Chart on Financial team - Year-over-year growth 2023-2028 (%)
      • Data Table on Financial team - Year-over-year growth 2023-2028 (%)
    • 6.7 Others - Market size and forecast 2023-2028
      • Chart on Others - Market size and forecast 2023-2028 ($ million)
      • Data Table on Others - Market size and forecast 2023-2028 ($ million)
      • Chart on Others - Year-over-year growth 2023-2028 (%)
      • Data Table on Others - Year-over-year growth 2023-2028 (%)
    • 6.8 Market opportunity by Application
      • Market opportunity by Application ($ million)
      • Data Table on Market opportunity by Application ($ million)

    7 Customer Landscape

    • 7.1 Customer landscape overview
      • Analysis of price sensitivity, lifecycle, customer purchase basket, adoption rates, and purchase criteria

    8 Geographic Landscape

    • 8.1 Geographic segmentation
      • Chart on Market share by geography 2023-2028 (%)
      • Data Table on Market share by geography 2023-2028 (%)
    • 8.2 Geographic comparison
      • Chart on Geographic comparison
      • Data Table on Geographic comparison
    • 8.3 North America - Market size and forecast 2023-2028
      • Chart on North America - Market size and forecast 2023-2028 ($ million)
      • Data Table on North America - Market size and forecast 2023-2028 ($ million)
      • Chart on North America - Year-over-year growth 2023-2028 (%)
      • Data Table on North America - Year-over-year growth 2023-2028 (%)
    • 8.4 Europe - Market size and forecast 2023-2028
      • Chart on Europe - Market size and forecast 2023-2028 ($ million)
      • Data Table on Europe - Market size and forecast 2023-2028 ($ million)
      • Chart on Europe - Year-over-year growth 2023-2028 (%)
      • Data Table on Europe - Year-over-year growth 2023-2028 (%)
    • 8.5 APAC - Market size and forecast 2023-2028
      • Chart on APAC - Market size and forecast 2023-2028 ($ million)
      • Data Table on APAC - Market size and forecast 2023-2028 ($ million)
      • Chart on APAC - Year-over-year growth 2023-2028 (%)
      • Data Table on APAC - Year-over-year growth 2023-2028 (%)
    • 8.6 South America - Market size and forecast 2023-2028
      • Chart on South America - Market size and forecast 2023-2028 ($ million)
      • Data Table on South America - Market size and forecast 2023-2028 ($ million)
      • Chart on South America - Year-over-year growth 2023-2028 (%)
      • Data Table on South America - Year-over-year growth 2023-2028 (%)
    • 8.7 Middle East and Africa - Market size and forecast 2023-2028
      • Chart on Middle East and Africa - Market size and forecast 2023-2028 ($ million)
      • Data Table on Middle East and Africa - Market size and forecast 2023-2028 ($ million)
      • Chart on Middle East and Africa - Year-over-year growth 2023-2028 (%)
      • Data Table on Middle East and Africa - Year-over-year growth 2023-2028 (%)
    • 8.8 US - Market size and forecast 2023-2028
      • Chart on US - Market size and forecast 2023-2028 ($ million)
      • Data Table on US - Market size and forecast 2023-2028 ($ million)
      • Chart on US - Year-over-year growth 2023-2028 (%)
      • Data Table on US - Year-over-year growth 2023-2028 (%)
    • 8.9 UK - Market size and forecast 2023-2028
      • Chart on UK - Market size and forecast 2023-2028 ($ million)
      • Data Table on UK - Market size and forecast 2023-2028 ($ million)
      • Chart on UK - Year-over-year growth 2023-2028 (%)
      • Data Table on UK - Year-over-year growth 2023-2028 (%)
    • 8.10 China - Market size and forecast 2023-2028
      • Chart on China - Market size and forecast 2023-2028 ($ million)
      • Data Table on China - Market size and forecast 2023-2028 ($ million)
      • Chart on China - Year-over-year growth 2023-2028 (%)
      • Data Table on China - Year-over-year growth 2023-2028 (%)
    • 8.11 India - Market size and forecast 2023-2028
      • Chart on India - Market size and forecast 2023-2028 ($ million)
      • Data Table on India - Market size and forecast 2023-2028 ($ million)
      • Chart on India - Year-over-year growth 2023-2028 (%)
      • Data Table on India - Year-over-year growth 2023-2028 (%)
    • 8.12 Germany - Market size and forecast 2023-2028
      • Chart on Germany - Market size and forecast 2023-2028 ($ million)
      • Data Table on Germany - Market size and forecast 2023-2028 ($ million)
      • Chart on Germany - Year-over-year growth 2023-2028 (%)
      • Data Table on Germany - Year-over-year growth 2023-2028 (%)
    • 8.13 Market opportunity by geography
      • Market opportunity by geography ($ million)
      • Data Tables on Market opportunity by geography ($ million)

    9 Drivers, Challenges, and Opportunity/Restraints

    • 9.1 Market drivers
      • 9.2 Market challenges
        • 9.3 Impact of drivers and challenges
          • Impact of drivers and challenges in 2023 and 2028
        • 9.4 Market opportunities/restraints

          10 Competitive Landscape

          • 10.1 Overview
            • 10.2 Competitive Landscape
              • Overview on criticality of inputs and factors of differentiation
            • 10.3 Landscape disruption
              • Overview on factors of disruption
            • 10.4 Industry risks
              • Impact of key risks on business

            11 Competitive Analysis

            • 11.1 Companies profiled
              • Companies covered
            • 11.2 Market positioning of companies
              • Matrix on companies position and classification
            • 11.3 bobsguide
              • bobsguide - Overview
              • bobsguide - Product / Service
              • bobsguide - Key offerings
            • 11.4 Capdesk
              • Capdesk - Overview
              • Capdesk - Product / Service
              • Capdesk - Key offerings
            • 11.5 Diligent Corp.
              • Diligent Corp. - Overview
              • Diligent Corp. - Product / Service
              • Diligent Corp. - Key offerings
            • 11.6 Dynamo Software Inc.
              • Dynamo Software Inc. - Overview
              • Dynamo Software Inc. - Product / Service
              • Dynamo Software Inc. - Key offerings
            • 11.7 Eqvista Inc.
              • Eqvista Inc. - Overview
              • Eqvista Inc. - Product / Service
              • Eqvista Inc. - Key offerings
            • 11.8 eShares Inc. DBA Carta Inc.
              • eShares Inc. DBA Carta Inc. - Overview
              • eShares Inc. DBA Carta Inc. - Product / Service
              • eShares Inc. DBA Carta Inc. - Key offerings
            • 11.9 GS Topco GP LLC
              • GS Topco GP LLC - Overview
              • GS Topco GP LLC - Product / Service
              • GS Topco GP LLC - Key news
              • GS Topco GP LLC - Key offerings
            • 11.10 Gust Inc.
              • Gust Inc. - Overview
              • Gust Inc. - Product / Service
              • Gust Inc. - Key offerings
            • 11.11 Ledgy AG
              • Ledgy AG - Overview
              • Ledgy AG - Product / Service
              • Ledgy AG - Key offerings
            • 11.12 Vestd Ltd.
              • Vestd Ltd. - Overview
              • Vestd Ltd. - Product / Service
              • Vestd Ltd. - Key offerings

            12 Appendix

            • 12.1 Scope of the report
              • 12.2 Inclusions and exclusions checklist
                • Inclusions checklist
                • Exclusions checklist
              • 12.3 Currency conversion rates for US$
                • Currency conversion rates for US$
              • 12.4 Research methodology
                • Research methodology
              • 12.5 Data procurement
                • Information sources
              • 12.6 Data validation
                • Data validation
              • 12.7 Validation techniques employed for market sizing
                • Validation techniques employed for market sizing
              • 12.8 Data synthesis
                • Data synthesis
              • 12.9 360 degree market analysis
                • 360 degree market analysis
              • 12.10 List of abbreviations
                • List of abbreviations

              Research Methodology

              Technavio presents a detailed picture of the market by way of study, synthesis, and summation of data from multiple sources. The analysts have presented the various facets of the market with a particular focus on identifying the key industry influencers. The data thus presented is comprehensive, reliable, and the result of extensive research, both primary and secondary.

              INFORMATION SOURCES

              Primary sources

              • Manufacturers and suppliers
              • Channel partners
              • Industry experts
              • Strategic decision makers

              Secondary sources

              • Industry journals and periodicals
              • Government data
              • Financial reports of key industry players
              • Historical data
              • Press releases

              DATA ANALYSIS

              Data Synthesis

              • Collation of data
              • Estimation of key figures
              • Analysis of derived insights

              Data Validation

              • Triangulation with data models
              • Reference against proprietary databases
              • Corroboration with industry experts

              REPORT WRITING

              Qualitative

              • Market drivers
              • Market challenges
              • Market trends
              • Five forces analysis

              Quantitative

              • Market size and forecast
              • Market segmentation
              • Geographical insights
              • Competitive landscape

              Interested in this report?

              Get your sample now to see our research methodology and insights!

              Download Now

              Frequently Asked Questions

              Equity Management Software market growth will increase by $ 547.5 mn during 2024-2028 .

              The Equity Management Software market is expected to grow at a CAGR of 18.51% during 2024-2028 .

              Equity Management Software market is segmented by Application( Start-ups, Private corporation, Listed companies, Financial team, Others)

              Altvia Solutions LLC, bobsguide, By Global Shares, Capdesk, Computershare Ltd., Diligent Corp., Dynamo Software Inc., Equiniti Group, Eqvista Inc., eShares Inc. DBA Carta Inc., Euronext N.V., GS Topco GP LLC, Gust Inc., HighCastle, Imagineer Technology Group LLC, Ledgy AG, Papaya Global Ltd., Prolific Labs Inc., Qapita Corp., Vestd Ltd. are a few of the key vendors in the Equity Management Software market.

              North America will register the highest growth rate of 40% among the other regions. Therefore, the Equity Management Software market in North America is expected to garner significant business opportunities for the vendors during the forecast period.

              US, UK, China, India, Germany

              • Vendors pricing strategiesTo thrive in a competitive market environment is the driving factor this market.
              • software vendors are adopting customer-centric pricing strategies that are enabled by advances in technology. A number of vendors in the equity management software market are focusing on providing value-based pricing models depending on the customers needs and value perception. The pricing of software is based on the differentiating and value-added features of software solutions. While implementing software is the driving factor this market.
              • customers focus on certain economic and market factors such as ROI is the driving factor this market.
              • the ability to opt for free models is the driving factor this market.
              • and the limited IT budgets. The vendors have to accommodate varying customer pricing preferences and budgets. The high price of the software and limited IT budgets have compelled the vendors to re-evaluate the software pricing and delivery models. Therefore is the driving factor this market.
              • vendors are providing SaaS is the driving factor this market.
              • commercial open-source models is the driving factor this market.
              • and term licensing to be in sync with the changing demands. The varied pricing structures of the equity software will increase its adoption among end-users during the forecast period. is the driving factor this market.

              The Equity Management Software market vendors should focus on grabbing business opportunities from the Start-ups segment as it accounted for the largest market share in the base year.