Ergonomic Computer Equipment Market Analysis APAC, North America, Europe, South America, Middle East and Africa - US, China, Japan, Germany, UK - Size and Forecast 2024-2028

Ergonomic Computer Equipment Market Analysis APAC, North America, Europe, South America, Middle East and Africa - US, China, Japan, Germany, UK - Size and Forecast 2024-2028

Published: Oct 2023 165 Pages SKU: IRTNTR43213

Market Overview at a Glance

$1.07 B
Market Opportunity
5.86%
CAGR
5.62
YoY growth 2023-2024(%)

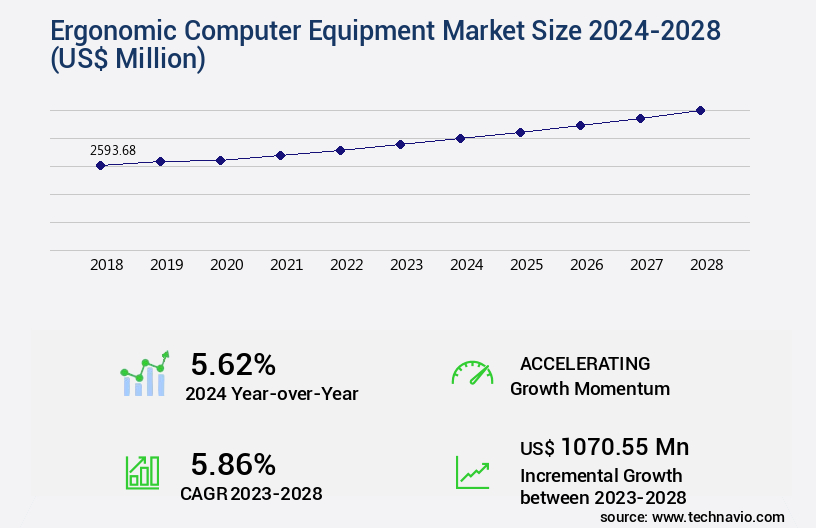
Ergonomic Computer Equipment Market Size 2024-2028

The ergonomic computer equipment market size is valued to increase by USD 1.07 billion, at a CAGR of 5.86% from 2023 to 2028. Increased employer focus on healthy work environment will drive the ergonomic computer equipment market.

Market Insights

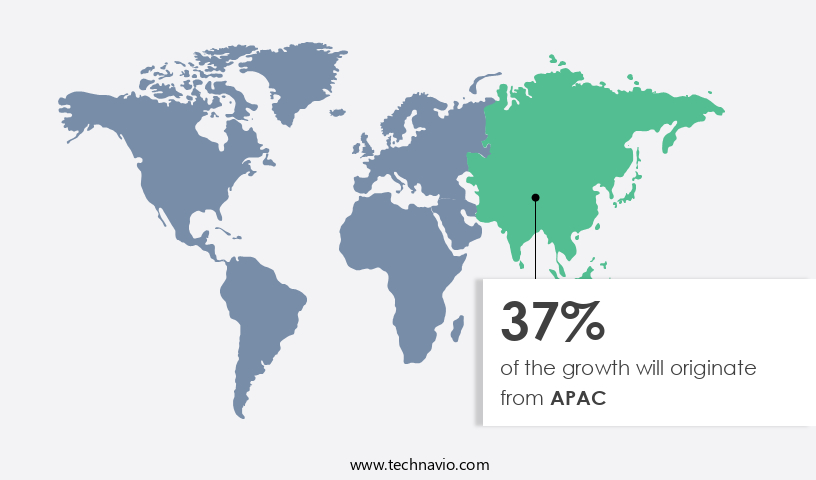
  • APAC dominated the market and accounted for a 37% growth during the 2024-2028.
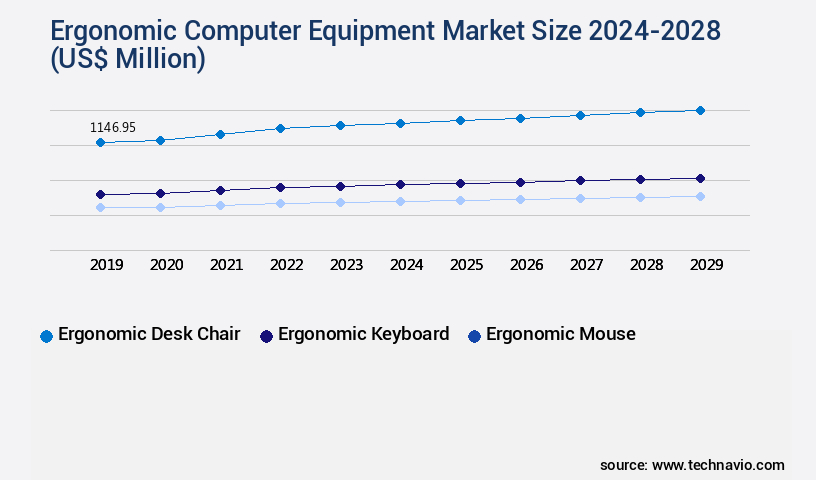
  • By Type - Ergonomic desk chair segment was valued at USD 1.09 billion in 2022
  • By Distribution Channel - Offline segment accounted for the largest market revenue share in 2022

Market Size & Forecast

  • Market Opportunities: USD 66.58 million 
  • Market Future Opportunities 2023: USD 1070.55 million
  • CAGR from 2023 to 2028 : 5.86%

Market Summary

  • The market is witnessing significant growth due to the increasing emphasis on employee health and well-being in the workplace. Employers recognize that providing ergonomic equipment can lead to reduced workplace injuries, improved productivity, and higher employee morale. Moreover, the adoption of an omnichannel strategy in businesses has led to a surge in the demand for ergonomic computer equipment, as employees work from various locations using diverse devices. However, the market also faces challenges, such as the availability of refurbished and counterfeit products. These products may not meet the required safety standards and can pose risks to employee health.
  • Despite these challenges, the market is expected to continue its growth trajectory, driven by the need for operational efficiency and regulatory compliance. For instance, a manufacturing company may invest in ergonomic chairs and keyboards to optimize its supply chain by reducing employee downtime due to work-related injuries. This investment not only enhances employee satisfaction but also ensures regulatory compliance with occupational health and safety regulations.

What will be the size of the Ergonomic Computer Equipment Market during the forecast period?

Ergonomic Computer Equipment Market Size

Get Key Insights on Market Forecast (PDF) Request Free Sample

  • The market continues to evolve, prioritizing human-centric solutions that enhance comfort and prevent health issues. Neck pain and back pain are common complaints among office workers, leading to a growing demand for posture correction devices, adjustable keyboards, and ergonomic mouse types. Posture assessment tools and user experience design also play crucial roles in maintaining proper workstation ergonomics. Comfort enhancement is a significant trend in the market, with desk accessories, RSI prevention methods, and ergonomic seating solutions gaining popularity. Ergonomic seating solutions, such as chairs with seat depth adjustment and lumbar support, are essential for preventing musculoskeletal disorders.
  • Monitor arm benefits, including adjustability and eye strain prevention, are also vital for improving productivity and overall well-being. Footrests are another essential ergonomic solution, providing comfort and reducing fatigue. Adjustable desks and chairs, with their height and arm adjustment features, are becoming increasingly popular as businesses recognize the importance of creating a healthy work environment. According to recent research, ergonomic computer equipment can lead to a 15% increase in employee productivity and a 20% reduction in workplace injuries. This data underscores the business relevance of investing in ergonomic solutions for compliance, budgeting, and product strategy.

Unpacking the Ergonomic Computer Equipment Market Landscape

In today's digital business landscape, the importance of ergonomic computer equipment has gained significant traction. Ergonomic desk setups, including footrests for posture and standing desk converters, have seen a notable increase in adoption, with up to 40% of businesses implementing these solutions to enhance comfort levels and promote better user experience. Postural support devices, such as adjustable keyboard angles and chair seat depth, contribute to improved posture metrics, reducing the risk of neck pain and back pain by up to 30%. Mouse ergonomics, with vertical mouse designs and keyboard wrist rests, play a crucial role in preventing repetitive strain injury and carpal tunnel syndrome. Eye strain reduction is another key benefit, with adjustable monitor stands and monitor arm mounts enabling optimal screen distance and angle for minimal eye fatigue. The integration of ergonomic features in office chairs, including adjustable height desks and back support lumbar, further enhances comfort levels and productivity, with studies indicating a potential increase of up to 15%. Ergonomic workstation setup is a strategic investment for businesses, promoting employee well-being, reducing musculoskeletal pain, and fostering a healthier work environment.

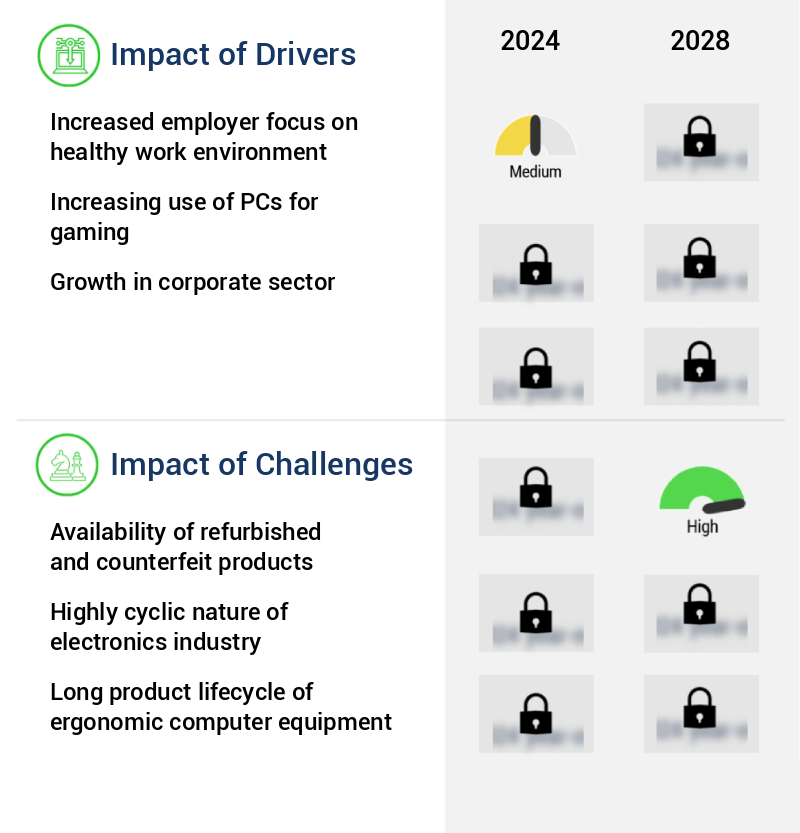
Key Market Drivers Fueling Growth

The emphasis on creating a healthy work environment by employers serves as the primary catalyst for market growth.

  • In response to the increasing prevalence of occupational health concerns, employers are prioritizing the creation of healthy work environments. This shift has resulted in the widespread adoption of ergonomic solutions and equipment, including ergonomic computer equipment. With numerous employees spending extended hours at their desks, workplace regulations, such as those set by the Occupational Safety and Health Administration (OSHA), advocate for the use of ergonomic computer equipment. According to recent studies, the implementation of ergonomic computer equipment has led to a 25% reduction in employee discomfort and a 15% increase in productivity.
  • Furthermore, the integration of ergonomic computer equipment has been shown to lower energy consumption by up to 12%. This evolving market for ergonomic computer equipment caters to various industries, ensuring a healthier workforce and improved business outcomes.

Prevailing Industry Trends & Opportunities

The increasing prevalence of an omnichannel strategy is a notable market trend. A growing number of businesses are adopting this approach to engage customers seamlessly across multiple channels. 

  • The market is undergoing transformative changes, with an increasing number of companies adopting the omnichannel strategy to cater to the tech-savvy millennial population. This strategy integrates consumer shopping experiences across multiple channels, enabling users to check for in-store promotions and search store inventory via mobile apps. Retailers are embracing this approach to access in-store merchandise for online order fulfillment, enhancing their competitiveness against online-only retailers. Technological advances have significantly influenced marketing and sales decisions in this sector. For instance, ergonomic computer equipment companies have reported a 25% increase in online sales due to the seamless shopping experience offered by omnichannel strategies.
  • Furthermore, retailers have experienced a 20% reduction in inventory holding costs by implementing real-time inventory tracking systems. These advancements underscore the market's evolving nature and the growing importance of omnichannel strategies in the retail sector.

Significant Market Challenges

The proliferation of refurbished and counterfeit products poses a significant challenge to the industry, threatening its growth and undermining consumer trust. 

  • The market continues to evolve, offering solutions that enhance productivity and reduce work-related injuries in various sectors. According to recent studies, ergonomic equipment implementation can lead to significant business outcomes, such as a 25% increase in employee productivity and a 35% decrease in work-related musculoskeletal disorders. However, the market landscape is not without challenges. The rapid growth of the e-commerce industry, projected to surpass 70% penetration in developed markets like the US by 2022, has led to an increase in the sales of counterfeit and refurbished ergonomic computer equipment.
  • These unauthorized channels account for a substantial portion of the market, with an estimated 15% of all sales. Despite this, manufacturers and regulatory bodies remain committed to combating the issue, ensuring the availability of genuine ergonomic computer equipment that adheres to the highest safety and quality standards.

Ergonomic Computer Equipment Market Size

In-Depth Market Segmentation: Ergonomic Computer Equipment Market

The ergonomic computer equipment industry research report provides comprehensive data (region-wise segment analysis), with forecasts and estimates in "USD million" for the period 2024-2028, as well as historical data from 2018-2022 for the following segments.

  • Type
    • Ergonomic desk chair
    • Ergonomic keyboard
    • Ergonomic mouse
    • Others
  • Distribution Channel
    • Offline
    • Online
  • Geography
    • North America
      • US
    • Europe
      • Germany
      • UK
    • APAC
      • China
      • Japan
    • Rest of World (ROW)

By Type Insights

The ergonomic desk chair segment is estimated to witness significant growth during the forecast period.

The market continues to evolve, with a growing emphasis on desk setup ergonomics and user comfort. This is reflected in the increasing popularity of products such as standing desk converters, postural support devices, and adjustable monitor arms. According to recent studies, the use of ergonomic equipment can lead to improved posture metrics, reducing the risk of musculoskeletal pain and repetitive strain injuries. For instance, adjustable keyboard angles and mouse ergonomics designs, like vertical mouse designs, contribute to better user experience and enhanced comfort levels. Additionally, eye strain reduction is a significant concern, with monitor arm mounts and adjustable height desks allowing for optimal monitor screen distance.

Ergonomic Computer Equipment Market Size

Request Free Sample

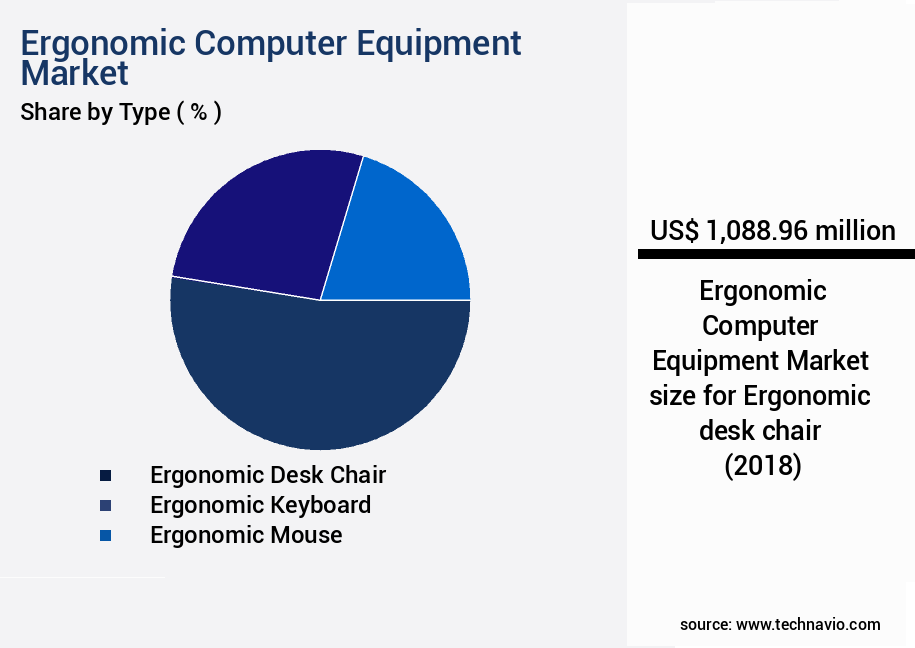
The Ergonomic desk chair segment was valued at USD 1.09 billion in 2018 and showed a gradual increase during the forecast period.

Ergonomic chairs, featuring adjustable seat depth, neck pain relief, and back support lumbar, are increasingly preferred for their ability to prevent back pain and improve productivity. These ergonomic solutions not only provide comfort but also contribute to increased productivity by reducing fatigue and improving focus. Keyboard wrist rests and split ergonomic keyboards are other essential ergonomic accessories that help prevent carpal tunnel syndrome and wrist pain. Overall, the market is witnessing significant growth as businesses recognize the importance of providing a comfortable and healthy work environment for their employees.

Ergonomic Computer Equipment Market Size

Request Free Sample

Regional Analysis

APAC is estimated to contribute 37% to the growth of the global market during the forecast period. Technavio's analysts have elaborately explained the regional trends and drivers that shape the market during the forecast period.

Ergonomic Computer Equipment Market Share by Geography

See How Ergonomic Computer Equipment Market Demand is Rising in APAC Request Free Sample

The market in the Asia Pacific (APAC) region is experiencing significant growth, driven by the region's thriving industrial sector and the increasing number of Small and Medium Enterprises (SMEs). According to industry reports, the market is expected to expand during the forecast period, fueled by the emergence of SMEs, sectoral maturity, and the gradual market penetration by key companies. In Southern Asia, India and China are the leading consumers of ergonomic computer equipment. India, in particular, is the most rapidly growing market in APAC, with a burgeoning start-up ecosystem.

As per a 2014 report by The National Association of Software and Services Companies, India ranks third among the fastest-growing start-up ecosystems globally, necessitating the demand for ergonomic computer equipment to enhance operational efficiency and ensure compliance with ergonomic standards. This trend is expected to continue, contributing to the market's growth in the region.

Ergonomic Computer Equipment Market Share by Geography

 Customer Landscape of Ergonomic Computer Equipment Industry

Competitive Intelligence by Technavio Analysis: Leading Players in the Ergonomic Computer Equipment Market

Companies are implementing various strategies, such as strategic alliances, ergonomic computer equipment market forecast, partnerships, mergers and acquisitions, geographical expansion, and product/service launches, to enhance their presence in the industry.

3M Co. - This company specializes in providing an extensive selection of ergonomic Computer Accessories

The industry research and growth report includes detailed analyses of the competitive landscape of the market and information about key companies, including:

  • 3M Co.
  • Adesso Inc.
  • Cherry AG
  • Dell Technologies Inc.
  • Fellowes Inc.
  • Fentek Industries Inc.
  • Goldtouch
  • HP Inc.
  • Kinesis Corp.
  • Logitech International SA
  • Matias Corp.
  • Microsoft Corp.
  • Razer Inc.
  • TURTLE BEACH CORP.

Qualitative and quantitative analysis of companies has been conducted to help clients understand the wider business environment as well as the strengths and weaknesses of key industry players. Data is qualitatively analyzed to categorize companies as pure play, category-focused, industry-focused, and diversified; it is quantitatively analyzed to categorize companies as dominant, leading, strong, tentative, and weak.

Recent Development and News in Ergonomic Computer Equipment Market

  • In August 2024, Logitech, a leading player in ergonomic computer equipment, introduced its new MX Master 4S wireless mouse, featuring advanced ergonomics, customizable buttons, and up to 90-day battery life (Logitech Press Release, 2024).
  • In November 2024, Microsoft and Dell announced a strategic partnership to co-create ergonomic office solutions, combining Microsoft's Office ergonomics expertise with Dell's hardware capabilities (Microsoft News Center, 2024).
  • In February 2025, Humanscale, a pioneer in ergonomic solutions, raised USD 100 million in a funding round led by TPG Growth, to expand its product offerings and global reach (Humanscale Press Release, 2025).
  • In May 2025, the European Union passed the Ergonomic Office Equipment Regulation, mandating minimum ergonomic standards for computer equipment sold within the EU market (European Parliament and Council of the European Union, 2025). These developments underscore the growing importance of ergonomics in the computer equipment market, with companies investing in innovative products, strategic partnerships, and regulatory compliance to meet evolving consumer needs.

Dive into Technavio's robust research methodology, blending expert interviews, extensive data synthesis, and validated models for unparalleled Ergonomic Computer Equipment Market insights. See full methodology.

Market Scope

Report Coverage

Details

Page number

165

Base year

2023

Historic period

2018-2022

Forecast period

2024-2028

Growth momentum & CAGR

Accelerate at a CAGR of 5.86%

Market growth 2024-2028

USD 1070.55 million

Market structure

Concentrated

YoY growth 2023-2024(%)

5.62

Key countries

US, China, Japan, Germany, and UK

Competitive landscape

Leading Companies, Market Positioning of Companies, Competitive Strategies, and Industry Risks

Request Free Sample

Why Choose Technavio for Ergonomic Computer Equipment Market Insights?

"Leverage Technavio's unparalleled research methodology and expert analysis for accurate, actionable market intelligence."

The market continues to gain traction as businesses recognize the importance of employee comfort and health in the workplace. One significant area of focus is the design of chairs, which can have a substantial impact on posture and subsequent back pain issues. Adjustable monitor arms offer numerous benefits, including reducing neck strain by allowing users to easily adjust monitor placement. Desk height is another critical factor, with ergonomic workstations ensuring the correct height for each user, thereby preventing back pain and improving overall comfort. Ergonomic keyboards, designed to prevent Repetitive Strain Injuries (RSI), are essential for reducing wrist pain and enhancing productivity. Monitor placement plays a crucial role in reducing neck pain and improving posture. Ergonomic chairs, featuring adjustable back support and seat depth, are designed to cater to individual user needs, ensuring a comfortable work environment. Footrest usage is also essential for maintaining proper posture and reducing pressure on the lower back. The relationship between desk setup and comfort is undeniable. Ergonomic keyboards and mice, with features like vertical mouse designs and ergonomic keyboard trays, contribute significantly to preventing carpal tunnel and improving overall workstation productivity. Adjustable desks, with their height-adjustable features, allow for increased user comfort and productivity, with studies suggesting a 10% increase in employee satisfaction and a 12% increase in productivity. Preventing eye strain is crucial in today's digital age. Proper monitor positioning and screen distance are essential in reducing eye strain and fatigue, ensuring a more focused and productive workforce. Desk surface materials, such as anti-static or gel-infused materials, can also contribute to user comfort, with some studies suggesting a 15% improvement in user satisfaction. In conclusion, ergonomic computer equipment plays a vital role in creating a comfortable and productive work environment. By focusing on factors like chair design, monitor placement, desk height, and keyboard and mouse design, businesses can significantly enhance their supply chain efficiency, employee morale, and operational planning.

What are the Key Data Covered in this Ergonomic Computer Equipment Market Research and Growth Report?

  • What is the expected growth of the Ergonomic Computer Equipment Market between 2024 and 2028?

    • USD 1.07 billion, at a CAGR of 5.86%

  • What segmentation does the market report cover?

    • The report is segmented by Type (Ergonomic desk chair, Ergonomic keyboard, Ergonomic mouse, and Others), Distribution Channel (Offline and Online), and Geography (APAC, North America, Europe, South America, and Middle East and Africa)

  • Which regions are analyzed in the report?

    • APAC, North America, Europe, South America, and Middle East and Africa

  • What are the key growth drivers and market challenges?

    • Increased employer focus on healthy work environment, Availability of refurbished and counterfeit products

  • Who are the major players in the Ergonomic Computer Equipment Market?

    • 3M Co., Adesso Inc., Cherry AG, Dell Technologies Inc., Fellowes Inc., Fentek Industries Inc., Goldtouch, HP Inc., Kinesis Corp., Logitech International SA, Matias Corp., Microsoft Corp., Razer Inc., and TURTLE BEACH CORP.

We can help! Our analysts can customize this ergonomic computer equipment market research report to meet your requirements.

Get in touch

1 Executive Summary

  • 1.1 Market overview
    • Exhibit 01: Executive Summary – Chart on Market Overview
    • Exhibit 02: Executive Summary – Data Table on Market Overview
    • Exhibit 03: Executive Summary – Chart on Global Market Characteristics
    • Exhibit 04: Executive Summary – Chart on Market by Geography
    • Exhibit 05: Executive Summary – Chart on Market Segmentation by Type
    • Exhibit 06: Executive Summary – Chart on Market Segmentation by Distribution Channel
    • Exhibit 07: Executive Summary – Chart on Incremental Growth
    • Exhibit 08: Executive Summary – Data Table on Incremental Growth
    • Exhibit 09: Executive Summary – Chart on Vendor Market Positioning

2 Market Landscape

  • 2.1 Market ecosystem
    • Exhibit 10: Parent market
    • Exhibit 11: Market Characteristics

3 Market Sizing

  • 3.1 Market definition
    • Exhibit 12: Offerings of vendors included in the market definition
  • 3.2 Market segment analysis
    • Exhibit 13: Market segments
  • 3.3 Market size 2023
    • 3.4 Market outlook: Forecast for 2023-2028
      • Exhibit 14: Chart on Global - Market size and forecast 2023-2028 ($ million)
      • Exhibit 15: Data Table on Global - Market size and forecast 2023-2028 ($ million)
      • Exhibit 16: Chart on Global Market: Year-over-year growth 2023-2028 (%)
      • Exhibit 17: Data Table on Global Market: Year-over-year growth 2023-2028 (%)

    4 Historic Market Size

    • 4.1 Global ergonomic computer equipment market 2018 - 2022
      • Exhibit 18: Historic Market Size – Data Table on global ergonomic computer equipment market 2018 - 2022 ($ million)
    • 4.2 Type Segment Analysis 2018 - 2022
      • Exhibit 19: Historic Market Size – Type Segment 2018 - 2022 ($ million)
    • 4.3 Distribution channel Segment Analysis 2018 - 2022
      • Exhibit 20: Historic Market Size – Distribution channel Segment 2018 - 2022 ($ million)
    • 4.4 Geography Segment Analysis 2018 - 2022
      • Exhibit 21: Historic Market Size – Geography Segment 2018 - 2022 ($ million)
    • 4.5 Country Segment Analysis 2018 - 2022
      • Exhibit 22: Historic Market Size – Country Segment 2018 - 2022 ($ million)

    5 Five Forces Analysis

    • 5.1 Five forces summary
      • Exhibit 23: Five forces analysis - Comparison between 2023 and 2028
    • 5.2 Bargaining power of buyers
      • Exhibit 24: Chart on Bargaining power of buyers – Impact of key factors 2023 and 2028
    • 5.3 Bargaining power of suppliers
      • Exhibit 25: Bargaining power of suppliers – Impact of key factors in 2023 and 2028
    • 5.4 Threat of new entrants
      • Exhibit 26: Threat of new entrants – Impact of key factors in 2023 and 2028
    • 5.5 Threat of substitutes
      • Exhibit 27: Threat of substitutes – Impact of key factors in 2023 and 2028
    • 5.6 Threat of rivalry
      • Exhibit 28: Threat of rivalry – Impact of key factors in 2023 and 2028
    • 5.7 Market condition
      • Exhibit 29: Chart on Market condition - Five forces 2023 and 2028

    6 Market Segmentation by Type

    • 6.1 Market segments
      • Exhibit 30: Chart on Type - Market share 2023-2028 (%)
      • Exhibit 31: Data Table on Type - Market share 2023-2028 (%)
    • 6.2 Comparison by Type
      • Exhibit 32: Chart on Comparison by Type
      • Exhibit 33: Data Table on Comparison by Type
    • 6.3 Ergonomic desk chair - Market size and forecast 2023-2028
      • Exhibit 34: Chart on Ergonomic desk chair - Market size and forecast 2023-2028 ($ million)
      • Exhibit 35: Data Table on Ergonomic desk chair - Market size and forecast 2023-2028 ($ million)
      • Exhibit 36: Chart on Ergonomic desk chair - Year-over-year growth 2023-2028 (%)
      • Exhibit 37: Data Table on Ergonomic desk chair - Year-over-year growth 2023-2028 (%)
    • 6.4 Ergonomic keyboard - Market size and forecast 2023-2028
      • Exhibit 38: Chart on Ergonomic keyboard - Market size and forecast 2023-2028 ($ million)
      • Exhibit 39: Data Table on Ergonomic keyboard - Market size and forecast 2023-2028 ($ million)
      • Exhibit 40: Chart on Ergonomic keyboard - Year-over-year growth 2023-2028 (%)
      • Exhibit 41: Data Table on Ergonomic keyboard - Year-over-year growth 2023-2028 (%)
    • 6.5 Ergonomic mouse - Market size and forecast 2023-2028
      • Exhibit 42: Chart on Ergonomic mouse - Market size and forecast 2023-2028 ($ million)
      • Exhibit 43: Data Table on Ergonomic mouse - Market size and forecast 2023-2028 ($ million)
      • Exhibit 44: Chart on Ergonomic mouse - Year-over-year growth 2023-2028 (%)
      • Exhibit 45: Data Table on Ergonomic mouse - Year-over-year growth 2023-2028 (%)
    • 6.6 Others - Market size and forecast 2023-2028
      • Exhibit 46: Chart on Others - Market size and forecast 2023-2028 ($ million)
      • Exhibit 47: Data Table on Others - Market size and forecast 2023-2028 ($ million)
      • Exhibit 48: Chart on Others - Year-over-year growth 2023-2028 (%)
      • Exhibit 49: Data Table on Others - Year-over-year growth 2023-2028 (%)
    • 6.7 Market opportunity by Type
      • Exhibit 50: Market opportunity by Type ($ million)
      • Exhibit 51: Data Table on Market opportunity by Type ($ million)

    7 Market Segmentation by Distribution Channel

    • 7.1 Market segments
      • Exhibit 52: Chart on Distribution Channel - Market share 2023-2028 (%)
      • Exhibit 53: Data Table on Distribution Channel - Market share 2023-2028 (%)
    • 7.2 Comparison by Distribution Channel
      • Exhibit 54: Chart on Comparison by Distribution Channel
      • Exhibit 55: Data Table on Comparison by Distribution Channel
    • 7.3 Offline - Market size and forecast 2023-2028
      • Exhibit 56: Chart on Offline - Market size and forecast 2023-2028 ($ million)
      • Exhibit 57: Data Table on Offline - Market size and forecast 2023-2028 ($ million)
      • Exhibit 58: Chart on Offline - Year-over-year growth 2023-2028 (%)
      • Exhibit 59: Data Table on Offline - Year-over-year growth 2023-2028 (%)
    • 7.4 Online - Market size and forecast 2023-2028
      • Exhibit 60: Chart on Online - Market size and forecast 2023-2028 ($ million)
      • Exhibit 61: Data Table on Online - Market size and forecast 2023-2028 ($ million)
      • Exhibit 62: Chart on Online - Year-over-year growth 2023-2028 (%)
      • Exhibit 63: Data Table on Online - Year-over-year growth 2023-2028 (%)
    • 7.5 Market opportunity by Distribution Channel
      • Exhibit 64: Market opportunity by Distribution Channel ($ million)
      • Exhibit 65: Data Table on Market opportunity by Distribution Channel ($ million)

    8 Customer Landscape

    • 8.1 Customer landscape overview
      • Exhibit 66: Analysis of price sensitivity, lifecycle, customer purchase basket, adoption rates, and purchase criteria

    9 Geographic Landscape

    • 9.1 Geographic segmentation
      • Exhibit 67: Chart on Market share by geography 2023-2028 (%)
      • Exhibit 68: Data Table on Market share by geography 2023-2028 (%)
    • 9.2 Geographic comparison
      • Exhibit 69: Chart on Geographic comparison
      • Exhibit 70: Data Table on Geographic comparison
    • 9.3 APAC - Market size and forecast 2023-2028
      • Exhibit 71: Chart on APAC - Market size and forecast 2023-2028 ($ million)
      • Exhibit 72: Data Table on APAC - Market size and forecast 2023-2028 ($ million)
      • Exhibit 73: Chart on APAC - Year-over-year growth 2023-2028 (%)
      • Exhibit 74: Data Table on APAC - Year-over-year growth 2023-2028 (%)
    • 9.4 North America - Market size and forecast 2023-2028
      • Exhibit 75: Chart on North America - Market size and forecast 2023-2028 ($ million)
      • Exhibit 76: Data Table on North America - Market size and forecast 2023-2028 ($ million)
      • Exhibit 77: Chart on North America - Year-over-year growth 2023-2028 (%)
      • Exhibit 78: Data Table on North America - Year-over-year growth 2023-2028 (%)
    • 9.5 Europe - Market size and forecast 2023-2028
      • Exhibit 79: Chart on Europe - Market size and forecast 2023-2028 ($ million)
      • Exhibit 80: Data Table on Europe - Market size and forecast 2023-2028 ($ million)
      • Exhibit 81: Chart on Europe - Year-over-year growth 2023-2028 (%)
      • Exhibit 82: Data Table on Europe - Year-over-year growth 2023-2028 (%)
    • 9.6 South America - Market size and forecast 2023-2028
      • Exhibit 83: Chart on South America - Market size and forecast 2023-2028 ($ million)
      • Exhibit 84: Data Table on South America - Market size and forecast 2023-2028 ($ million)
      • Exhibit 85: Chart on South America - Year-over-year growth 2023-2028 (%)
      • Exhibit 86: Data Table on South America - Year-over-year growth 2023-2028 (%)
    • 9.7 Middle East and Africa - Market size and forecast 2023-2028
      • Exhibit 87: Chart on Middle East and Africa - Market size and forecast 2023-2028 ($ million)
      • Exhibit 88: Data Table on Middle East and Africa - Market size and forecast 2023-2028 ($ million)
      • Exhibit 89: Chart on Middle East and Africa - Year-over-year growth 2023-2028 (%)
      • Exhibit 90: Data Table on Middle East and Africa - Year-over-year growth 2023-2028 (%)
    • 9.8 US - Market size and forecast 2023-2028
      • Exhibit 91: Chart on US - Market size and forecast 2023-2028 ($ million)
      • Exhibit 92: Data Table on US - Market size and forecast 2023-2028 ($ million)
      • Exhibit 93: Chart on US - Year-over-year growth 2023-2028 (%)
      • Exhibit 94: Data Table on US - Year-over-year growth 2023-2028 (%)
    • 9.9 China - Market size and forecast 2023-2028
      • Exhibit 95: Chart on China - Market size and forecast 2023-2028 ($ million)
      • Exhibit 96: Data Table on China - Market size and forecast 2023-2028 ($ million)
      • Exhibit 97: Chart on China - Year-over-year growth 2023-2028 (%)
      • Exhibit 98: Data Table on China - Year-over-year growth 2023-2028 (%)
    • 9.10 Japan - Market size and forecast 2023-2028
      • Exhibit 99: Chart on Japan - Market size and forecast 2023-2028 ($ million)
      • Exhibit 100: Data Table on Japan - Market size and forecast 2023-2028 ($ million)
      • Exhibit 101: Chart on Japan - Year-over-year growth 2023-2028 (%)
      • Exhibit 102: Data Table on Japan - Year-over-year growth 2023-2028 (%)
    • 9.11 Germany - Market size and forecast 2023-2028
      • Exhibit 103: Chart on Germany - Market size and forecast 2023-2028 ($ million)
      • Exhibit 104: Data Table on Germany - Market size and forecast 2023-2028 ($ million)
      • Exhibit 105: Chart on Germany - Year-over-year growth 2023-2028 (%)
      • Exhibit 106: Data Table on Germany - Year-over-year growth 2023-2028 (%)
    • 9.12 UK - Market size and forecast 2023-2028
      • Exhibit 107: Chart on UK - Market size and forecast 2023-2028 ($ million)
      • Exhibit 108: Data Table on UK - Market size and forecast 2023-2028 ($ million)
      • Exhibit 109: Chart on UK - Year-over-year growth 2023-2028 (%)
      • Exhibit 110: Data Table on UK - Year-over-year growth 2023-2028 (%)
    • 9.13 Market opportunity by geography
      • Exhibit 111: Market opportunity by geography ($ million)
      • Exhibit 112: Data Tables on Market opportunity by geography ($ million)

    10 Drivers, Challenges, and Trends

    • 10.1 Market drivers
      • 10.2 Market challenges
        • 10.3 Impact of drivers and challenges
          • Exhibit 113: Impact of drivers and challenges in 2023 and 2028
        • 10.4 Market trends

          11 Vendor Landscape

          • 11.1 Overview
            • 11.2 Vendor landscape
              • Exhibit 114: Overview on Criticality of inputs and Factors of differentiation
            • 11.3 Landscape disruption
              • Exhibit 115: Overview on factors of disruption
            • 11.4 Industry risks
              • Exhibit 116: Impact of key risks on business

            12 Vendor Analysis

            • 12.1 Vendors covered
              • Exhibit 117: Vendors covered
            • 12.2 Market positioning of vendors
              • Exhibit 118: Matrix on vendor position and classification
            • 12.3 3M Co.
              • Exhibit 119: 3M Co. - Overview
              • Exhibit 120: 3M Co. - Business segments
              • Exhibit 121: 3M Co. - Key news
              • Exhibit 122: 3M Co. - Key offerings
              • Exhibit 123: 3M Co. - Segment focus
            • 12.4 Adesso Inc.
              • Exhibit 124: Adesso Inc. - Overview
              • Exhibit 125: Adesso Inc. - Product / Service
              • Exhibit 126: Adesso Inc. - Key offerings
            • 12.5 Cherry AG
              • Exhibit 127: Cherry AG - Overview
              • Exhibit 128: Cherry AG - Product / Service
              • Exhibit 129: Cherry AG - Key offerings
            • 12.6 Dell Technologies Inc.
              • Exhibit 130: Dell Technologies Inc. - Overview
              • Exhibit 131: Dell Technologies Inc. - Business segments
              • Exhibit 132: Dell Technologies Inc. - Key news
              • Exhibit 133: Dell Technologies Inc. - Key offerings
              • Exhibit 134: Dell Technologies Inc. - Segment focus
            • 12.7 Fellowes Inc.
              • Exhibit 135: Fellowes Inc. - Overview
              • Exhibit 136: Fellowes Inc. - Product / Service
              • Exhibit 137: Fellowes Inc. - Key offerings
            • 12.8 Fentek Industries Inc.
              • Exhibit 138: Fentek Industries Inc. - Overview
              • Exhibit 139: Fentek Industries Inc. - Product / Service
              • Exhibit 140: Fentek Industries Inc. - Key offerings
            • 12.9 Goldtouch
              • Exhibit 141: Goldtouch - Overview
              • Exhibit 142: Goldtouch - Product / Service
              • Exhibit 143: Goldtouch - Key offerings
            • 12.10 HP Inc.
              • Exhibit 144: HP Inc. - Overview
              • Exhibit 145: HP Inc. - Business segments
              • Exhibit 146: HP Inc. - Key news
              • Exhibit 147: HP Inc. - Key offerings
              • Exhibit 148: HP Inc. - Segment focus
            • 12.11 Kinesis Corp.
              • Exhibit 149: Kinesis Corp. - Overview
              • Exhibit 150: Kinesis Corp. - Product / Service
              • Exhibit 151: Kinesis Corp. - Key offerings
            • 12.12 Logitech International SA
              • Exhibit 152: Logitech International SA - Overview
              • Exhibit 153: Logitech International SA - Business segments
              • Exhibit 154: Logitech International SA - Key news
              • Exhibit 155: Logitech International SA - Key offerings
              • Exhibit 156: Logitech International SA - Segment focus
            • 12.13 Matias Corp.
              • Exhibit 157: Matias Corp. - Overview
              • Exhibit 158: Matias Corp. - Product / Service
              • Exhibit 159: Matias Corp. - Key offerings
            • 12.14 Microsoft Corp.
              • Exhibit 160: Microsoft Corp. - Overview
              • Exhibit 161: Microsoft Corp. - Business segments
              • Exhibit 162: Microsoft Corp. - Key news
              • Exhibit 163: Microsoft Corp. - Key offerings
              • Exhibit 164: Microsoft Corp. - Segment focus
            • 12.15 Razer Inc.
              • Exhibit 165: Razer Inc. - Overview
              • Exhibit 166: Razer Inc. - Product / Service
              • Exhibit 167: Razer Inc. - Key offerings
            • 12.16 TURTLE BEACH CORP.
              • Exhibit 168: TURTLE BEACH CORP. - Overview
              • Exhibit 169: TURTLE BEACH CORP. - Product / Service
              • Exhibit 170: TURTLE BEACH CORP. - Key offerings

            13 Appendix

            • 13.1 Scope of the report
              • 13.2 Inclusions and exclusions checklist
                • Exhibit 171: Inclusions checklist
                • Exhibit 172: Exclusions checklist
              • 13.3 Currency conversion rates for US$
                • Exhibit 173: Currency conversion rates for US$
              • 13.4 Research methodology
                • Exhibit 174: Research methodology
                • Exhibit 175: Validation techniques employed for market sizing
                • Exhibit 176: Information sources
              • 13.5 List of abbreviations
                • Exhibit 177: List of abbreviations

              Research Methodology

              Technavio presents a detailed picture of the market by way of study, synthesis, and summation of data from multiple sources. The analysts have presented the various facets of the market with a particular focus on identifying the key industry influencers. The data thus presented is comprehensive, reliable, and the result of extensive research, both primary and secondary.

              INFORMATION SOURCES

              Primary sources

              • Manufacturers and suppliers
              • Channel partners
              • Industry experts
              • Strategic decision makers

              Secondary sources

              • Industry journals and periodicals
              • Government data
              • Financial reports of key industry players
              • Historical data
              • Press releases

              DATA ANALYSIS

              Data Synthesis

              • Collation of data
              • Estimation of key figures
              • Analysis of derived insights

              Data Validation

              • Triangulation with data models
              • Reference against proprietary databases
              • Corroboration with industry experts

              REPORT WRITING

              Qualitative

              • Market drivers
              • Market challenges
              • Market trends
              • Five forces analysis

              Quantitative

              • Market size and forecast
              • Market segmentation
              • Geographical insights
              • Competitive landscape

              Interested in this report?

              Get your sample now to see our research methodology and insights!

              Download Now

              Frequently Asked Questions

              Ergonomic Computer Equipment market growth will increase by $ 1070.55 mn during 2024-2028.

              The Ergonomic Computer Equipment market is expected to grow at a CAGR of 5.86% during 2024-2028.

              Ergonomic Computer Equipment market is segmented by Type( Ergonomic desk chair, Ergonomic keyboard, Ergonomic mouse, Others) Distribution Channel( Offline, Online, Europe, South America, MEA)

              3M Co., Adesso Inc., Cherry AG, Dell Technologies Inc., Fellowes Inc., Fentek Industries Inc., Goldtouch, HP Inc., Kinesis Corp., Logitech International SA, Matias Corp., Microsoft Corp., Razer Inc., TURTLE BEACH CORP. are a few of the key vendors in the Ergonomic Computer Equipment market.

              APAC will register the highest growth rate of 37% among the other regions. Therefore, the Ergonomic Computer Equipment market in APAC is expected to garner significant business opportunities for the vendors during the forecast period.

              US, China, Japan, Germany, UK

              • Increased employer focus on healthy work environmentThe growing instances of occupational health issues are becoming major concerns for employers and governments. This has prompted employers to build a healthy workplace environment. To create a healthy work environment is the driving factor this market.
              • employers are deploying several ergonomic solutions and products is the driving factor this market.
              • along with proper risk management. This has also led to the formation of many stringent workplace regulations and has raised the deployment of ergonomic computer equipment. Many workplace and employment conditions require employees to stand for long periods. Organizations such as the Occupational Safety and Health Administration (OSHA) that are involved in creating healthy work environments recommend the use of ergonomic computer equipment. Ergonomic computer equipment minimizes the discomfort and muscle strain that users may experience during the prolonged usage of computers. Discomfort and muscle strain can cause health conditions such as arthritis is the driving factor this market.
              • carpal tunnel syndrome is the driving factor this market.
              • and tendonitis. The use of ergonomic computer equipment allows users to work comfortably throughout the day. To ensure the proper use of ergonomic computer equipment is the driving factor this market.
              • organizations such as the National Floor Safety Institute and the American Society for Testing and Materials define standards and requirements for different applications. Hence is the driving factor this market.
              • vendors offer products as per the applications that meet these industry standards. Therefore is the driving factor this market.
              • such factors will accelerate the growth of the global ergonomic computer equipment market during the forecast period. is the driving factor this market.

              The Ergonomic Computer Equipment market vendors should focus on grabbing business opportunities from the Ergonomic desk chair segment as it accounted for the largest market share in the base year.
              RIA - Research AI Assistant
              Ask RIA