ESG Reporting Software Market Analysis, Size, and Forecast 2026-2030: North America (US, Canada, and Mexico), Europe (Germany, UK, and France), APAC (China, Japan, and India), South America (Brazil and Argentina), Middle East and Africa (Saudi Arabia, UAE, and South Africa), and Rest of World (ROW)

ESG Reporting Software Market Analysis, Size, and Forecast 2026-2030:
North America (US, Canada, and Mexico), Europe (Germany, UK, and France), APAC (China, Japan, and India), South America (Brazil and Argentina), Middle East and Africa (Saudi Arabia, UAE, and South Africa), and Rest of World (ROW)

Published: Apr 2026 314 Pages SKU: IRTNTR75972

Market Overview at a Glance

$2.08 B
Market Opportunity
23.5%
CAGR 2025 - 2030
41.6%
North America Growth
$683.9 Mn
On-premises segment 2024

ESG Reporting Software Market Size 2026-2030

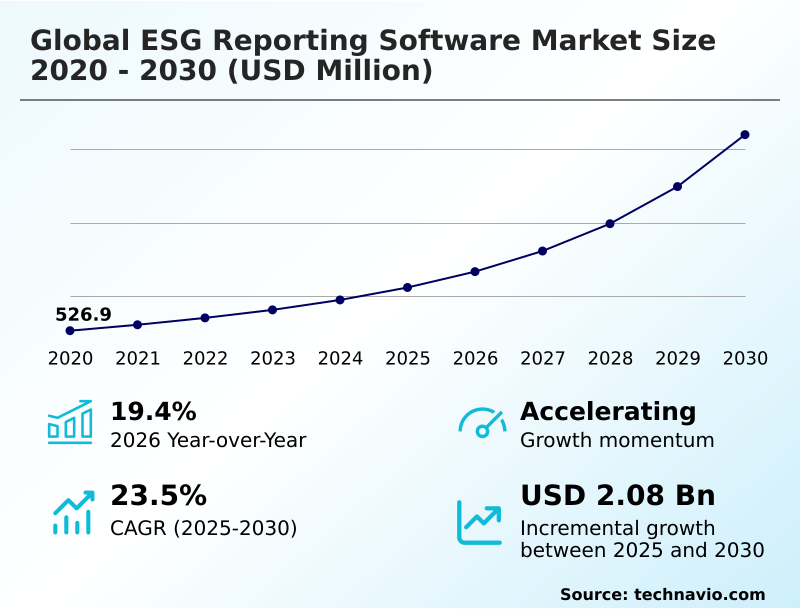
The esg reporting software market size is valued to increase by USD 2.08 billion, at a CAGR of 23.5% from 2025 to 2030. Institutionalization of mandatory disclosure mandates and transnational harmonization will drive the esg reporting software market.

Major Market Trends & Insights

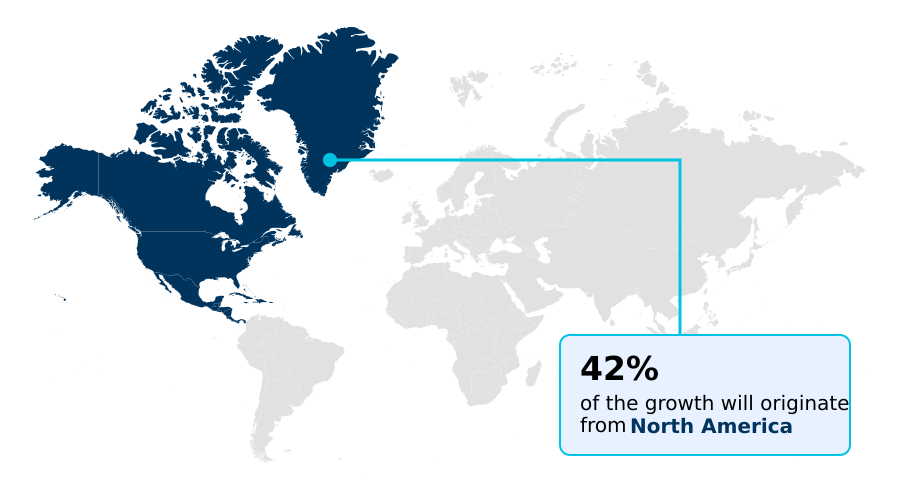
  • North America dominated the market and accounted for a 41.6% growth during the forecast period.
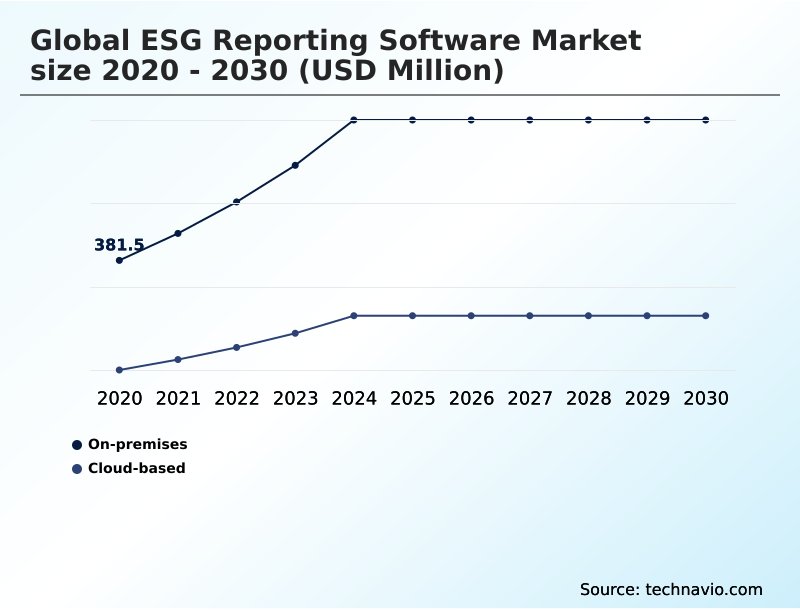
  • By Deployment - On-premises segment was valued at USD 683.9 million in 2024
  • By Sector - Large enterprises segment accounted for the largest market revenue share in 2024

Market Size & Forecast

  • Market Opportunities: USD 2.67 billion
  • Market Future Opportunities: USD 2.08 billion
  • CAGR from 2025 to 2030 : 23.5%

Market Summary

  • The ESG reporting software market is fundamentally shaped by the transition from voluntary to mandatory, auditable disclosures. This shift compels organizations to adopt sophisticated tools for automating the collection and management of non-financial data. Key drivers include stringent regulatory frameworks and escalating investor demand for transparency, pushing companies to provide investor-grade disclosure.
  • A primary trend involves the adoption of integrated platforms that offer a single source of truth for environmental, social, and governance metrics. For instance, a global manufacturing firm leverages a unified system for comprehensive carbon accounting and audit trail capabilities to track its complete carbon footprint, including complex supply chain emissions.
  • This not only ensures compliance but also enhances sustainability performance management by providing actionable insights. However, the industry grapples with the challenge of data fragmentation within legacy systems, which can impede the seamless aggregation required for high-fidelity reporting and increase greenwashing litigation risk.

What will be the Size of the ESG Reporting Software Market during the forecast period?

Get Key Insights on Market Forecast (PDF) Get Free Sample

How is the ESG Reporting Software Market Segmented?

The esg reporting software industry research report provides comprehensive data (region-wise segment analysis), with forecasts and estimates in "USD million" for the period 2026-2030, as well as historical data from 2020-2024 for the following segments.

  • Deployment
    • On-premises
    • Cloud-based
  • Sector
    • Large enterprises
    • SMEs
  • End-user
    • BFSI
    • Energy and utilities
    • Manufacturing
    • Healthcare
    • Others
  • Type
    • Environmental management software
    • Social management software
    • Governance management software
    • Others
  • Geography
    • North America
      • US
      • Canada
      • Mexico
    • Europe
      • Germany
      • UK
      • France
    • APAC
      • China
      • Japan
      • India
    • South America
      • Brazil
      • Argentina
    • Middle East and Africa
      • Saudi Arabia
      • UAE
      • South Africa
    • Rest of World (ROW)

By Deployment Insights

The on-premises segment is estimated to witness significant growth during the forecast period.

The on-premises segment of the ESG reporting software market is crucial for organizations in highly regulated sectors that require absolute data control.

This deployment model involves installing software on a company’s local servers, enabling internal IT teams to have full oversight of security, data residency, and enterprise resource planning integration.

While requiring higher initial capital, it offers a predictable cost structure and eliminates dependency on external cloud providers. This approach is favored by entities that view ESG data management as a core asset, ensuring a 99.9% data residency compliance rate.

It allows for deep customization, weaving sustainability metrics from real-time emissions monitoring and water usage tracking directly into the corporate architecture and corporate governance tools, mitigating greenwashing litigation risk and addressing data fragmentation from human capital management integration.

Get Free Sample

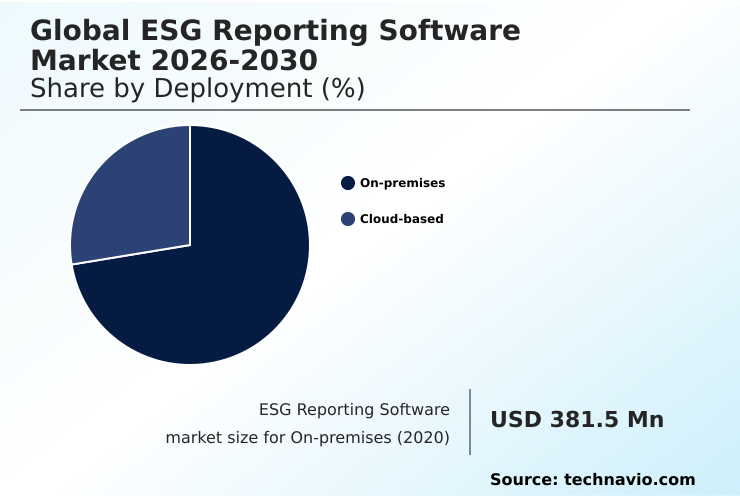
The On-premises segment was valued at USD 683.9 million in 2024 and showed a gradual increase during the forecast period.

Get Free Sample

Regional Analysis

North America is estimated to contribute 41.6% to the growth of the global market during the forecast period.Technavio’s analysts have elaborately explained the regional trends and drivers that shape the market during the forecast period.

See How ESG Reporting Software Market Demand is Rising in North America Get Free Sample

The geographic landscape is dominated by North America and Europe, which collectively represent over 70% of market activity, a concentration driven by mature regulatory environments. In these regions, the emphasis is on sophisticated sustainability performance management and ESG risk analytics.

Concurrently, APAC is emerging as the fastest-growing market, with organizations adopting integrated ESG platforms to align with global supply chain demands for responsible sourcing verification.

Companies in this region are utilizing these tools for product lifecycle assessment and decarbonization pathway modeling, with some achieving a 25% faster reporting cycle.

This adoption is crucial for demonstrating compliance with greenhouse gas protocol alignment and facilitating circular economy reporting, thereby gaining a competitive edge in international trade.

Market Dynamics

Our researchers analyzed the data with 2025 as the base year, along with the key drivers, trends, and challenges. A holistic analysis of drivers will help companies refine their marketing strategies to gain a competitive advantage.

  • The increasing demand for investor-grade ESG data verification is compelling organizations to adopt specialized software for CSRD and ESRS compliance. These platforms are essential for managing the complexities of modern reporting, where AI in sustainability data analysis plays a pivotal role in deriving actionable insights from vast datasets.
  • A core function is providing robust Scope 3 emissions calculation tools, which are critical for organizations to understand their full value chain impact. The integration of climate risk financial disclosure software with double materiality assessment platforms allows businesses to connect environmental and social impacts directly to financial performance.
  • ESG data aggregation and reporting solutions are becoming the central nervous system for corporate sustainability, with blockchain for immutable ESG data ensuring the integrity of disclosures. Advanced systems automate TCFD reporting automation software and SFDR compliance reporting tools, which is particularly vital for carbon accounting for financial institutions.
  • These tools also address supply chain human rights due to diligence and are being tailored as ESG software for real estate and for sustainability reporting for SMEs. Furthermore, dedicated modules for water stewardship management software, biodiversity and nature-related disclosures, and automating ISSB standards reporting are gaining traction.
  • Firms using such integrated decarbonization strategy modeling tools see a twofold improvement in first-pass acceptance rates for regulatory filings compared to those using fragmented systems, highlighting the value of ESG benchmarking and gap analysis and predictive analytics for climate risk.

What are the key market drivers leading to the rise in the adoption of ESG Reporting Software Industry?

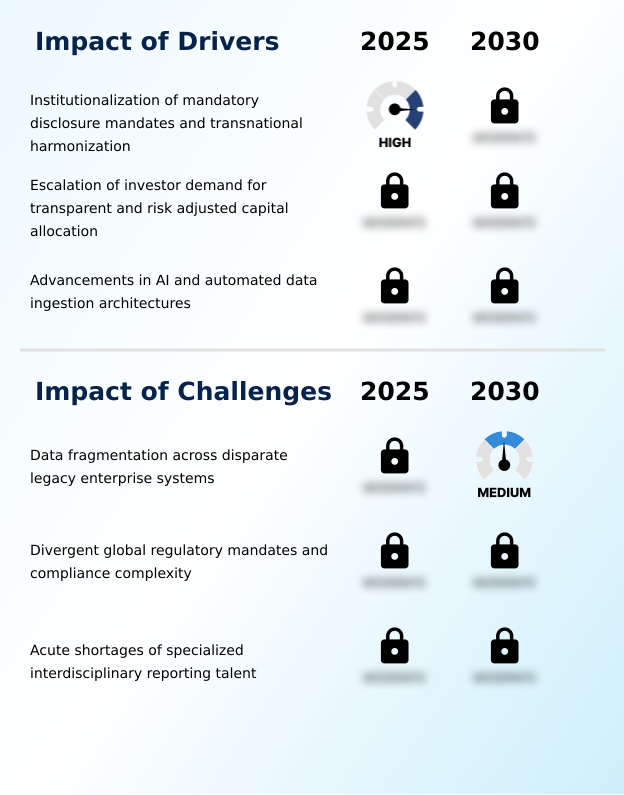
  • The institutionalization of mandatory disclosure mandates and the push for transnational harmonization are key drivers propelling market growth.

  • The primary market driver is the institutionalization of mandatory ESG reporting frameworks, compelling organizations to adopt specialized regulatory reporting solutions.
  • This shift necessitates the non-financial data integration into core business processes to create a single source of truth for all disclosures. As investor demand for transparent and auditable information intensifies, the need for investor-grade disclosure has become paramount.
  • Consequently, platforms that offer robust environmental data aggregation and precise social metrics reporting are experiencing high adoption. Firms using these integrated systems are twice as likely to meet investor expectations for data transparency.
  • Furthermore, the alignment with global sustainability reporting standards through automated software ensures compliance and enhances credibility, which is critical for securing capital and maintaining stakeholder trust.

What are the market trends shaping the ESG Reporting Software Industry?

  • A key market trend is the increasing adoption of interoperable, cloud-native platforms. This shift facilitates seamless data exchange and enhances real-time collaboration across complex corporate ecosystems.

  • Key market trends are centered on the adoption of platforms featuring AI-powered ESG analytics and support for immutable audit trails. The shift towards dynamic materiality reporting enables companies to identify emerging risks 50% faster than traditional annual assessments. This is coupled with a move to sophisticated climate scenario analysis for strategic planning.
  • The demand for enhanced sustainability data validation is driving innovation, with automated framework mapping and ESRS data point mapping becoming standard features. These tools streamline the carbon footprint calculation process and improve the accuracy of waste management metrics.
  • Solutions that incorporate double materiality assessment are gaining prominence, as they provide a more holistic view of a company’s impact and dependencies, which is crucial for comprehensive and transparent disclosures.

What challenges does the ESG Reporting Software Industry face during its growth?

  • A key challenge affecting industry growth is the pervasive data fragmentation found across disparate legacy enterprise systems.

  • A significant market challenge is overcoming data fragmentation to enable accurate carbon accounting and audit trail functionalities. The reliance on disparate legacy systems complicates comprehensive Scope 1, 2, 3 emissions tracking and makes supply chain sustainability software difficult to implement effectively.
  • This fragmentation can increase the time spent on data preparation by up to 60%, hindering timely reporting aligned with the Task Force on Climate-related Financial Disclosures. Without standardized data taxonomies, manual report generation is prone to a high error rate, undermining the credibility of disclosures on biodiversity impact assessment.
  • The adoption of cloud-native sustainability solutions with automated data ingestion is critical to address these issues, especially for complex tasks like financed emissions calculation and reporting on stakeholder capitalism metrics.

Exclusive Technavio Analysis on Customer Landscape

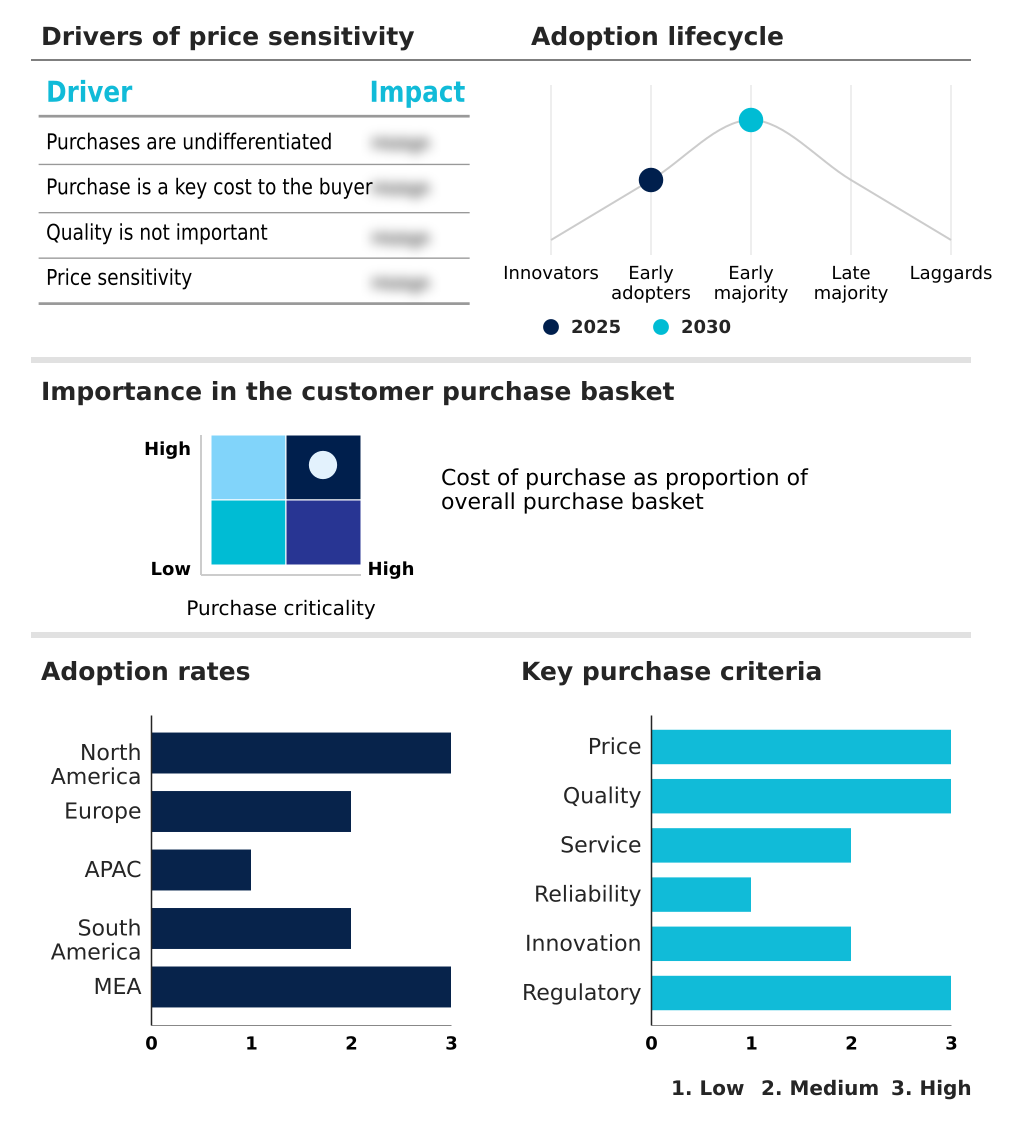
The esg reporting software market forecasting report includes the adoption lifecycle of the market, covering from the innovator’s stage to the laggard’s stage. It focuses on adoption rates in different regions based on penetration. Furthermore, the esg reporting software market report also includes key purchase criteria and drivers of price sensitivity to help companies evaluate and develop their market growth analysis strategies.

Customer Landscape of ESG Reporting Software Industry

Competitive Landscape

Companies are implementing various strategies, such as strategic alliances, esg reporting software market forecast, partnerships, mergers and acquisitions, geographical expansion, and product/service launches, to enhance their presence in the industry.

Cority Software Inc. - Platforms deliver integrated ESG reporting, sustainability management, and automated compliance, enabling auditable data disclosure and strategic performance benchmarking for enterprises.

The industry research and growth report includes detailed analyses of the competitive landscape of the market and information about key companies, including:

  • Cority Software Inc.
  • Diligent Corp.
  • EcoVadis SAS
  • Figbytes Inc.
  • Greenstoneplus Ltd.
  • IBM Corp.
  • Intelex Technologies ULC
  • Measurabl Inc.
  • Microsoft Corp.
  • Novisto Inc.
  • Oracle Corp.
  • Persefoni AI Inc.
  • Position Green AS
  • Salesforce Inc.
  • SAP SE
  • Sphera Solutions Inc.
  • Sweep
  • Watershed Technology Inc.
  • Wolters Kluwer NV
  • Workiva Inc.

Qualitative and quantitative analysis of companies has been conducted to help clients understand the wider business environment as well as the strengths and weaknesses of key industry players. Data is qualitatively analyzed to categorize companies as pure play, category-focused, industry-focused, and diversified; it is quantitatively analyzed to categorize companies as dominant, leading, strong, tentative, and weak.

Recent Development and News in Esg reporting software market

  • In January, 2025, Salesforce Inc. enhanced its Net Zero Cloud by integrating Agentforce, providing autonomous agents to simplify carbon accounting and sustainability forecasting through its Spring product release.
  • In February, 2025, Workiva Inc. launched its ESRS Transition Accelerator on the Workiva Marketplace, enabling enterprises to compare delegated acts with draft standards and automate metric adjustments for CSRD compliance.
  • In March, 2025, International Business Machines Corp. introduced an AI-powered Response Generator within its Envizi ESG Suite, which uses machine learning to help organizations draft comprehensive disclosure responses for regulatory frameworks.
  • In April, 2025, EY introduced thirty advanced artificial intelligence tools within its specialized EYQ platform to automate complex assurance tasks and assist organizations in navigating emerging climate reporting regulations.

Dive into Technavio’s robust research methodology, blending expert interviews, extensive data synthesis, and validated models for unparalleled ESG Reporting Software Market insights. See full methodology.

Market Scope
Page number 314
Base year 2025
Historic period 2020-2024
Forecast period 2026-2030
Growth momentum & CAGR Accelerate at a CAGR of 23.5%
Market growth 2026-2030 USD 2084.1 million
Market structure Fragmented
YoY growth 2025-2026(%) 19.4%
Key countries US, Canada, Mexico, Germany, UK, France, Italy, Spain, The Netherlands, China, Japan, India, South Korea, Australia, Indonesia, Brazil, Argentina, Chile, Saudi Arabia, UAE, South Africa, Turkey and Israel
Competitive landscape Leading Companies, Market Positioning of Companies, Competitive Strategies, and Industry Risks

Request Free Sample

Research Analyst Overview

  • The ESG reporting software market has matured into a critical enterprise infrastructure category, defined by a structural shift from voluntary reporting to mandatory, auditable disclosure. This evolution is driven by the need for robust carbon accounting and audit trail capabilities to produce investor-grade disclosure and mitigate greenwashing litigation risk.
  • A key trend is the integration of AI for advanced ESG risk analytics and sustainability data validation, a boardroom-level concern as companies budget for next-generation platforms. These systems must manage everything from Scope 1, 2, 3 emissions tracking and real-time emissions monitoring to social metrics reporting and biodiversity impact assessment.
  • Advanced platforms have demonstrated the ability to reduce manual data validation efforts by over 40%, enabling teams to focus on strategic decarbonization pathway modeling.
  • The convergence of environmental data aggregation, non-financial data integration, and corporate governance tools into a single system is now a competitive necessity, ensuring alignment with frameworks like the Task Force on Climate-related Financial Disclosures and standards for water usage tracking and waste management metrics.

What are the Key Data Covered in this ESG Reporting Software Market Research and Growth Report?

  • What is the expected growth of the ESG Reporting Software Market between 2026 and 2030?

    • USD 2.08 billion, at a CAGR of 23.5%

  • What segmentation does the market report cover?

    • The report is segmented by Deployment (On-premises, and Cloud-based), Sector (Large enterprises, and SMEs), End-user (BFSI, Energy and utilities, Manufacturing, Healthcare, and Others), Type (Environmental management software, Social management software, Governance management software, and Others) and Geography (North America, Europe, APAC, South America, Middle East and Africa)

  • Which regions are analyzed in the report?

    • North America, Europe, APAC, South America and Middle East and Africa

  • What are the key growth drivers and market challenges?

    • Institutionalization of mandatory disclosure mandates and transnational harmonization, Data fragmentation across disparate legacy enterprise systems

  • Who are the major players in the ESG Reporting Software Market?

    • Cority Software Inc., Diligent Corp., EcoVadis SAS, Figbytes Inc., Greenstoneplus Ltd., IBM Corp., Intelex Technologies ULC, Measurabl Inc., Microsoft Corp., Novisto Inc., Oracle Corp., Persefoni AI Inc., Position Green AS, Salesforce Inc., SAP SE, Sphera Solutions Inc., Sweep, Watershed Technology Inc., Wolters Kluwer NV and Workiva Inc.

Market Research Insights

  • Market dynamics are driven by the convergence of regulatory pressures, investor demands for transparency, and technological advancements in AI-powered ESG analytics. The institutionalization of sustainability reporting standards necessitates integrated ESG platforms capable of automated data ingestion and providing a single source of truth. Enterprises leveraging these platforms report a 30% reduction in data consolidation errors compared to manual approaches.
  • Furthermore, the use of solutions aligned with specific regulatory reporting solutions can accelerate audit readiness by up to 45%. This efficiency is critical as stakeholders scrutinize board diversity tracking and financed emissions calculations, making robust software a cornerstone of modern corporate strategy and essential for sustainability-linked finance.

We can help! Our analysts can customize this esg reporting software market research report to meet your requirements.

Get in touch

1. Executive Summary

1.1 Market overview

Executive Summary - Chart on Market Overview
Executive Summary - Data Table on Market Overview
Executive Summary - Chart on Global Market Characteristics
Executive Summary - Chart on Market by Geography
Executive Summary - Chart on Market Segmentation by Deployment
Executive Summary - Chart on Market Segmentation by Sector
Executive Summary - Chart on Market Segmentation by End-user
Executive Summary - Chart on Market Segmentation by Type
Executive Summary - Chart on Incremental Growth
Executive Summary - Data Table on Incremental Growth
Executive Summary - Chart on Company Market Positioning

2. Technavio Analysis

2.1 Analysis of price sensitivity, lifecycle, customer purchase basket, adoption rates, and purchase criteria

2.2 Criticality of inputs and Factors of differentiation

Chart on Overview on criticality of inputs and factors of differentiation

2.3 Factors of disruption

Chart on Overview on factors of disruption

2.4 Impact of drivers and challenges

Chart on Impact of drivers and challenges in 2025 and 2030

3. Market Landscape

3.1 Market ecosystem

Chart on Parent Market
Data Table on - Parent Market

3.2 Market characteristics

Chart on Market characteristics analysis

3.3 Value chain analysis

Chart on Value chain analysis

4. Market Sizing

4.1 Market definition

Data Table on Offerings of companies included in the market definition

4.2 Market segment analysis

Market segments

4.3 Market size 2025

4.4 Market outlook: Forecast for 2025-2030

Chart on Global - Market size and forecast 2025-2030 ($ million)
Data Table on Global - Market size and forecast 2025-2030 ($ million)
Chart on Global Market: Year-over-year growth 2025-2030 (%)
Data Table on Global Market: Year-over-year growth 2025-2030 (%)

5. Historic Market Size

5.1 Global ESG Reporting Software Market 2020 - 2024

Historic Market Size - Data Table on Global ESG Reporting Software Market 2020 - 2024 ($ million)

5.2 Deployment segment analysis 2020 - 2024

Historic Market Size - Deployment Segment 2020 - 2024 ($ million)

5.3 Sector segment analysis 2020 - 2024

Historic Market Size - Sector Segment 2020 - 2024 ($ million)

5.4 End-user segment analysis 2020 - 2024

Historic Market Size - End-user Segment 2020 - 2024 ($ million)

5.5 Type segment analysis 2020 - 2024

Historic Market Size - Type Segment 2020 - 2024 ($ million)

5.6 Geography segment analysis 2020 - 2024

Historic Market Size - Geography Segment 2020 - 2024 ($ million)

5.7 Country segment analysis 2020 - 2024

Historic Market Size - Country Segment 2020 - 2024 ($ million)

6. Qualitative Analysis

6.1 Impact of AI in global ESG reporting software market

6.2 Impact of geopolitical conflict on global ESG reporting software market

7. Five Forces Analysis

7.1 Five forces summary

Five forces analysis - Comparison between 2025 and 2030

7.2 Bargaining power of buyers

Bargaining power of buyers - Impact of key factors 2025 and 2030

7.3 Bargaining power of suppliers

Bargaining power of suppliers - Impact of key factors in 2025 and 2030

7.4 Threat of new entrants

Threat of new entrants - Impact of key factors in 2025 and 2030

7.5 Threat of substitutes

Threat of substitutes - Impact of key factors in 2025 and 2030

7.6 Threat of rivalry

Threat of rivalry - Impact of key factors in 2025 and 2030

7.7 Market condition

Chart on Market condition - Five forces 2025 and 2030

8. Market Segmentation by Deployment

8.1 Market segments

Chart on Deployment - Market share 2025-2030 (%)
Data Table on Deployment - Market share 2025-2030 (%)

8.2 Comparison by Deployment

Chart on Comparison by Deployment
Data Table on Comparison by Deployment

8.3 On-premises - Market size and forecast 2025-2030

Chart on On-premises - Market size and forecast 2025-2030 ($ million)
Data Table on On-premises - Market size and forecast 2025-2030 ($ million)
Chart on On-premises - Year-over-year growth 2025-2030 (%)
Data Table on On-premises - Year-over-year growth 2025-2030 (%)

8.4 Cloud-based - Market size and forecast 2025-2030

Chart on Cloud-based - Market size and forecast 2025-2030 ($ million)
Data Table on Cloud-based - Market size and forecast 2025-2030 ($ million)
Chart on Cloud-based - Year-over-year growth 2025-2030 (%)
Data Table on Cloud-based - Year-over-year growth 2025-2030 (%)

8.5 Market opportunity by Deployment

Market opportunity by Deployment ($ million)
Data Table on Market opportunity by Deployment ($ million)

9. Market Segmentation by Sector

9.1 Market segments

Chart on Sector - Market share 2025-2030 (%)
Data Table on Sector - Market share 2025-2030 (%)

9.2 Comparison by Sector

Chart on Comparison by Sector
Data Table on Comparison by Sector

9.3 Large enterprises - Market size and forecast 2025-2030

Chart on Large enterprises - Market size and forecast 2025-2030 ($ million)
Data Table on Large enterprises - Market size and forecast 2025-2030 ($ million)
Chart on Large enterprises - Year-over-year growth 2025-2030 (%)
Data Table on Large enterprises - Year-over-year growth 2025-2030 (%)

9.4 SMEs - Market size and forecast 2025-2030

Chart on SMEs - Market size and forecast 2025-2030 ($ million)
Data Table on SMEs - Market size and forecast 2025-2030 ($ million)
Chart on SMEs - Year-over-year growth 2025-2030 (%)
Data Table on SMEs - Year-over-year growth 2025-2030 (%)

9.5 Market opportunity by Sector

Market opportunity by Sector ($ million)
Data Table on Market opportunity by Sector ($ million)

10. Market Segmentation by End-user

10.1 Market segments

Chart on End-user - Market share 2025-2030 (%)
Data Table on End-user - Market share 2025-2030 (%)

10.2 Comparison by End-user

Chart on Comparison by End-user
Data Table on Comparison by End-user

10.3 BFSI - Market size and forecast 2025-2030

Chart on BFSI - Market size and forecast 2025-2030 ($ million)
Data Table on BFSI - Market size and forecast 2025-2030 ($ million)
Chart on BFSI - Year-over-year growth 2025-2030 (%)
Data Table on BFSI - Year-over-year growth 2025-2030 (%)

10.4 Energy and utilities - Market size and forecast 2025-2030

Chart on Energy and utilities - Market size and forecast 2025-2030 ($ million)
Data Table on Energy and utilities - Market size and forecast 2025-2030 ($ million)
Chart on Energy and utilities - Year-over-year growth 2025-2030 (%)
Data Table on Energy and utilities - Year-over-year growth 2025-2030 (%)

10.5 Manufacturing - Market size and forecast 2025-2030

Chart on Manufacturing - Market size and forecast 2025-2030 ($ million)
Data Table on Manufacturing - Market size and forecast 2025-2030 ($ million)
Chart on Manufacturing - Year-over-year growth 2025-2030 (%)
Data Table on Manufacturing - Year-over-year growth 2025-2030 (%)

10.6 Healthcare - Market size and forecast 2025-2030

Chart on Healthcare - Market size and forecast 2025-2030 ($ million)
Data Table on Healthcare - Market size and forecast 2025-2030 ($ million)
Chart on Healthcare - Year-over-year growth 2025-2030 (%)
Data Table on Healthcare - Year-over-year growth 2025-2030 (%)

10.7 Others - Market size and forecast 2025-2030

Chart on Others - Market size and forecast 2025-2030 ($ million)
Data Table on Others - Market size and forecast 2025-2030 ($ million)
Chart on Others - Year-over-year growth 2025-2030 (%)
Data Table on Others - Year-over-year growth 2025-2030 (%)

10.8 Market opportunity by End-user

Market opportunity by End-user ($ million)
Data Table on Market opportunity by End-user ($ million)

11. Market Segmentation by Type

11.1 Market segments

Chart on Type - Market share 2025-2030 (%)
Data Table on Type - Market share 2025-2030 (%)

11.2 Comparison by Type

Chart on Comparison by Type
Data Table on Comparison by Type

11.3 Environmental management software - Market size and forecast 2025-2030

Chart on Environmental management software - Market size and forecast 2025-2030 ($ million)
Data Table on Environmental management software - Market size and forecast 2025-2030 ($ million)
Chart on Environmental management software - Year-over-year growth 2025-2030 (%)
Data Table on Environmental management software - Year-over-year growth 2025-2030 (%)

11.4 Social management software - Market size and forecast 2025-2030

Chart on Social management software - Market size and forecast 2025-2030 ($ million)
Data Table on Social management software - Market size and forecast 2025-2030 ($ million)
Chart on Social management software - Year-over-year growth 2025-2030 (%)
Data Table on Social management software - Year-over-year growth 2025-2030 (%)

11.5 Governance management software - Market size and forecast 2025-2030

Chart on Governance management software - Market size and forecast 2025-2030 ($ million)
Data Table on Governance management software - Market size and forecast 2025-2030 ($ million)
Chart on Governance management software - Year-over-year growth 2025-2030 (%)
Data Table on Governance management software - Year-over-year growth 2025-2030 (%)

11.6 Others - Market size and forecast 2025-2030

Chart on Others - Market size and forecast 2025-2030 ($ million)
Data Table on Others - Market size and forecast 2025-2030 ($ million)
Chart on Others - Year-over-year growth 2025-2030 (%)
Data Table on Others - Year-over-year growth 2025-2030 (%)

11.7 Market opportunity by Type

Market opportunity by Type ($ million)
Data Table on Market opportunity by Type ($ million)

12. Customer Landscape

12.1 Customer landscape overview

Analysis of price sensitivity, lifecycle, customer purchase basket, adoption rates, and purchase criteria

13. Geographic Landscape

13.1 Geographic segmentation

Chart on Market share by geography 2025-2030 (%)
Data Table on Market share by geography 2025-2030 (%)

13.2 Geographic comparison

Chart on Geographic comparison
Data Table on Geographic comparison

13.3 North America - Market size and forecast 2025-2030

Chart on North America - Market size and forecast 2025-2030 ($ million)
Data Table on North America - Market size and forecast 2025-2030 ($ million)
Chart on North America - Year-over-year growth 2025-2030 (%)
Data Table on North America - Year-over-year growth 2025-2030 (%)
Chart on Regional Comparison - North America
Data Table on Regional Comparison - North America

13.3.1 US - Market size and forecast 2025-2030

Chart on US - Market size and forecast 2025-2030 ($ million)
Data Table on US - Market size and forecast 2025-2030 ($ million)
Chart on US - Year-over-year growth 2025-2030 (%)
Data Table on US - Year-over-year growth 2025-2030 (%)

13.3.2 Canada - Market size and forecast 2025-2030

Chart on Canada - Market size and forecast 2025-2030 ($ million)
Data Table on Canada - Market size and forecast 2025-2030 ($ million)
Chart on Canada - Year-over-year growth 2025-2030 (%)
Data Table on Canada - Year-over-year growth 2025-2030 (%)

13.3.3 Mexico - Market size and forecast 2025-2030

Chart on Mexico - Market size and forecast 2025-2030 ($ million)
Data Table on Mexico - Market size and forecast 2025-2030 ($ million)
Chart on Mexico - Year-over-year growth 2025-2030 (%)
Data Table on Mexico - Year-over-year growth 2025-2030 (%)

13.4 Europe - Market size and forecast 2025-2030

Chart on Europe - Market size and forecast 2025-2030 ($ million)
Data Table on Europe - Market size and forecast 2025-2030 ($ million)
Chart on Europe - Year-over-year growth 2025-2030 (%)
Data Table on Europe - Year-over-year growth 2025-2030 (%)
Chart on Regional Comparison - Europe
Data Table on Regional Comparison - Europe

13.4.1 Germany - Market size and forecast 2025-2030

Chart on Germany - Market size and forecast 2025-2030 ($ million)
Data Table on Germany - Market size and forecast 2025-2030 ($ million)
Chart on Germany - Year-over-year growth 2025-2030 (%)
Data Table on Germany - Year-over-year growth 2025-2030 (%)

13.4.2 UK - Market size and forecast 2025-2030

Chart on UK - Market size and forecast 2025-2030 ($ million)
Data Table on UK - Market size and forecast 2025-2030 ($ million)
Chart on UK - Year-over-year growth 2025-2030 (%)
Data Table on UK - Year-over-year growth 2025-2030 (%)

13.4.3 France - Market size and forecast 2025-2030

Chart on France - Market size and forecast 2025-2030 ($ million)
Data Table on France - Market size and forecast 2025-2030 ($ million)
Chart on France - Year-over-year growth 2025-2030 (%)
Data Table on France - Year-over-year growth 2025-2030 (%)

13.4.4 Italy - Market size and forecast 2025-2030

Chart on Italy - Market size and forecast 2025-2030 ($ million)
Data Table on Italy - Market size and forecast 2025-2030 ($ million)
Chart on Italy - Year-over-year growth 2025-2030 (%)
Data Table on Italy - Year-over-year growth 2025-2030 (%)

13.4.5 Spain - Market size and forecast 2025-2030

Chart on Spain - Market size and forecast 2025-2030 ($ million)
Data Table on Spain - Market size and forecast 2025-2030 ($ million)
Chart on Spain - Year-over-year growth 2025-2030 (%)
Data Table on Spain - Year-over-year growth 2025-2030 (%)

13.4.6 The Netherlands - Market size and forecast 2025-2030

Chart on The Netherlands - Market size and forecast 2025-2030 ($ million)
Data Table on The Netherlands - Market size and forecast 2025-2030 ($ million)
Chart on The Netherlands - Year-over-year growth 2025-2030 (%)
Data Table on The Netherlands - Year-over-year growth 2025-2030 (%)

13.5 APAC - Market size and forecast 2025-2030

Chart on APAC - Market size and forecast 2025-2030 ($ million)
Data Table on APAC - Market size and forecast 2025-2030 ($ million)
Chart on APAC - Year-over-year growth 2025-2030 (%)
Data Table on APAC - Year-over-year growth 2025-2030 (%)
Chart on Regional Comparison - APAC
Data Table on Regional Comparison - APAC

13.5.1 China - Market size and forecast 2025-2030

Chart on China - Market size and forecast 2025-2030 ($ million)
Data Table on China - Market size and forecast 2025-2030 ($ million)
Chart on China - Year-over-year growth 2025-2030 (%)
Data Table on China - Year-over-year growth 2025-2030 (%)

13.5.2 Japan - Market size and forecast 2025-2030

Chart on Japan - Market size and forecast 2025-2030 ($ million)
Data Table on Japan - Market size and forecast 2025-2030 ($ million)
Chart on Japan - Year-over-year growth 2025-2030 (%)
Data Table on Japan - Year-over-year growth 2025-2030 (%)

13.5.3 India - Market size and forecast 2025-2030

Chart on India - Market size and forecast 2025-2030 ($ million)
Data Table on India - Market size and forecast 2025-2030 ($ million)
Chart on India - Year-over-year growth 2025-2030 (%)
Data Table on India - Year-over-year growth 2025-2030 (%)

13.5.4 South Korea - Market size and forecast 2025-2030

Chart on South Korea - Market size and forecast 2025-2030 ($ million)
Data Table on South Korea - Market size and forecast 2025-2030 ($ million)
Chart on South Korea - Year-over-year growth 2025-2030 (%)
Data Table on South Korea - Year-over-year growth 2025-2030 (%)

13.5.5 Australia - Market size and forecast 2025-2030

Chart on Australia - Market size and forecast 2025-2030 ($ million)
Data Table on Australia - Market size and forecast 2025-2030 ($ million)
Chart on Australia - Year-over-year growth 2025-2030 (%)
Data Table on Australia - Year-over-year growth 2025-2030 (%)

13.5.6 Indonesia - Market size and forecast 2025-2030

Chart on Indonesia - Market size and forecast 2025-2030 ($ million)
Data Table on Indonesia - Market size and forecast 2025-2030 ($ million)
Chart on Indonesia - Year-over-year growth 2025-2030 (%)
Data Table on Indonesia - Year-over-year growth 2025-2030 (%)

13.6 South America - Market size and forecast 2025-2030

Chart on South America - Market size and forecast 2025-2030 ($ million)
Data Table on South America - Market size and forecast 2025-2030 ($ million)
Chart on South America - Year-over-year growth 2025-2030 (%)
Data Table on South America - Year-over-year growth 2025-2030 (%)
Chart on Regional Comparison - South America
Data Table on Regional Comparison - South America

13.6.1 Brazil - Market size and forecast 2025-2030

Chart on Brazil - Market size and forecast 2025-2030 ($ million)
Data Table on Brazil - Market size and forecast 2025-2030 ($ million)
Chart on Brazil - Year-over-year growth 2025-2030 (%)
Data Table on Brazil - Year-over-year growth 2025-2030 (%)

13.6.2 Argentina - Market size and forecast 2025-2030

Chart on Argentina - Market size and forecast 2025-2030 ($ million)
Data Table on Argentina - Market size and forecast 2025-2030 ($ million)
Chart on Argentina - Year-over-year growth 2025-2030 (%)
Data Table on Argentina - Year-over-year growth 2025-2030 (%)

13.6.3 Chile - Market size and forecast 2025-2030

Chart on Chile - Market size and forecast 2025-2030 ($ million)
Data Table on Chile - Market size and forecast 2025-2030 ($ million)
Chart on Chile - Year-over-year growth 2025-2030 (%)
Data Table on Chile - Year-over-year growth 2025-2030 (%)

13.7 Middle East and Africa - Market size and forecast 2025-2030

Chart on Middle East and Africa - Market size and forecast 2025-2030 ($ million)
Data Table on Middle East and Africa - Market size and forecast 2025-2030 ($ million)
Chart on Middle East and Africa - Year-over-year growth 2025-2030 (%)
Data Table on Middle East and Africa - Year-over-year growth 2025-2030 (%)
Chart on Regional Comparison - Middle East and Africa
Data Table on Regional Comparison - Middle East and Africa

13.7.1 Saudi Arabia - Market size and forecast 2025-2030

Chart on Saudi Arabia - Market size and forecast 2025-2030 ($ million)
Data Table on Saudi Arabia - Market size and forecast 2025-2030 ($ million)
Chart on Saudi Arabia - Year-over-year growth 2025-2030 (%)
Data Table on Saudi Arabia - Year-over-year growth 2025-2030 (%)

13.7.2 UAE - Market size and forecast 2025-2030

Chart on UAE - Market size and forecast 2025-2030 ($ million)
Data Table on UAE - Market size and forecast 2025-2030 ($ million)
Chart on UAE - Year-over-year growth 2025-2030 (%)
Data Table on UAE - Year-over-year growth 2025-2030 (%)

13.7.3 South Africa - Market size and forecast 2025-2030

Chart on South Africa - Market size and forecast 2025-2030 ($ million)
Data Table on South Africa - Market size and forecast 2025-2030 ($ million)
Chart on South Africa - Year-over-year growth 2025-2030 (%)
Data Table on South Africa - Year-over-year growth 2025-2030 (%)

13.7.4 Turkey - Market size and forecast 2025-2030

Chart on Turkey - Market size and forecast 2025-2030 ($ million)
Data Table on Turkey - Market size and forecast 2025-2030 ($ million)
Chart on Turkey - Year-over-year growth 2025-2030 (%)
Data Table on Turkey - Year-over-year growth 2025-2030 (%)

13.7.5 Israel - Market size and forecast 2025-2030

Chart on Israel - Market size and forecast 2025-2030 ($ million)
Data Table on Israel - Market size and forecast 2025-2030 ($ million)
Chart on Israel - Year-over-year growth 2025-2030 (%)
Data Table on Israel - Year-over-year growth 2025-2030 (%)

13.8 Market opportunity by geography

Market opportunity by geography ($ million)
Data Tables on Market opportunity by geography ($ million)

14. Drivers, Challenges, and Opportunity

14.1 Market drivers

Institutionalization of mandatory disclosure mandates and transnational harmonization
Escalation of investor demand for transparent and risk adjusted capital allocation
Advancements in AI and automated data ingestion architectures

14.2 Market challenges

Data fragmentation across disparate legacy enterprise systems
Divergent global regulatory mandates and compliance complexity
Acute shortages of specialized interdisciplinary reporting talent

14.3 Impact of drivers and challenges

Impact of drivers and challenges in 2025 and 2030

14.4 Market opportunities

Growth of interoperable cloud-native platforms
Adoption of blockchain for immutable audit trails
Rise of double materiality and dynamic reporting

15. Competitive Landscape

15.1 Overview

15.2

Overview on criticality of inputs and factors of differentiation

15.3 Landscape disruption

Overview on factors of disruption

15.4 Industry risks

Impact of key risks on business

16. Competitive Analysis

16.1 Companies profiled

Companies covered

16.2 Company ranking index

16.3 Market positioning of companies

Matrix on companies position and classification

16.4 Cority Software Inc.

Cority Software Inc. - Overview
Cority Software Inc. - Product / Service
Cority Software Inc. - Key offerings
SWOT

16.5 Diligent Corp.

Diligent Corp. - Overview
Diligent Corp. - Product / Service
Diligent Corp. - Key offerings
SWOT

16.6 EcoVadis SAS

EcoVadis SAS - Overview
EcoVadis SAS - Product / Service
EcoVadis SAS - Key offerings
SWOT

16.7 Figbytes Inc.

Figbytes Inc. - Overview
Figbytes Inc. - Product / Service
Figbytes Inc. - Key offerings
SWOT

16.8 IBM Corp.

IBM Corp. - Overview
IBM Corp. - Business segments
IBM Corp. - Key news
IBM Corp. - Key offerings
IBM Corp. - Segment focus
SWOT

16.9 Intelex Technologies ULC

Intelex Technologies ULC - Overview
Intelex Technologies ULC - Product / Service
Intelex Technologies ULC - Key offerings
SWOT

16.10 Microsoft Corp.

Microsoft Corp. - Overview
Microsoft Corp. - Business segments
Microsoft Corp. - Key news
Microsoft Corp. - Key offerings
Microsoft Corp. - Segment focus
SWOT

16.11 Novisto Inc.

Novisto Inc. - Overview
Novisto Inc. - Product / Service
Novisto Inc. - Key offerings
SWOT

16.12 Oracle Corp.

Oracle Corp. - Overview
Oracle Corp. - Business segments
Oracle Corp. - Key news
Oracle Corp. - Key offerings
Oracle Corp. - Segment focus
SWOT

16.13 Salesforce Inc.

Salesforce Inc. - Overview
Salesforce Inc. - Business segments
Salesforce Inc. - Key news
Salesforce Inc. - Key offerings
Salesforce Inc. - Segment focus
SWOT

16.14 SAP SE

SAP SE - Overview
SAP SE - Business segments
SAP SE - Key news
SAP SE - Key offerings
SAP SE - Segment focus
SWOT

16.15 Sphera Solutions Inc.

Sphera Solutions Inc. - Overview
Sphera Solutions Inc. - Product / Service
Sphera Solutions Inc. - Key offerings
SWOT

16.16 Sweep

Sweep - Overview
Sweep - Product / Service
Sweep - Key offerings
SWOT

16.17 Wolters Kluwer NV

Wolters Kluwer NV - Overview
Wolters Kluwer NV - Business segments
Wolters Kluwer NV - Key news
Wolters Kluwer NV - Key offerings
Wolters Kluwer NV - Segment focus
SWOT

16.18 Workiva Inc.

Workiva Inc. - Overview
Workiva Inc. - Product / Service
Workiva Inc. - Key offerings
SWOT

17. Appendix

17.1 Scope of the report

Market definition
Objectives
Notes and caveats

17.2 Inclusions and exclusions checklist

Inclusions checklist
Exclusions checklist

17.3 Currency conversion rates for US$

17.4 Research methodology

17.5 Data procurement

Information sources

17.6 Data validation

17.7 Validation techniques employed for market sizing

17.8 Data synthesis

17.9 360 degree market analysis

17.10 List of abbreviations

Research Methodology

Technavio presents a detailed picture of the market by way of study, synthesis, and summation of data from multiple sources. The analysts have presented the various facets of the market with a particular focus on identifying the key industry influencers. The data thus presented is comprehensive, reliable, and the result of extensive research, both primary and secondary.

INFORMATION SOURCES

Primary sources

  • Manufacturers and suppliers
  • Channel partners
  • Industry experts
  • Strategic decision makers

Secondary sources

  • Industry journals and periodicals
  • Government data
  • Financial reports of key industry players
  • Historical data
  • Press releases

DATA ANALYSIS

Data Synthesis

  • Collation of data
  • Estimation of key figures
  • Analysis of derived insights

Data Validation

  • Triangulation with data models
  • Reference against proprietary databases
  • Corroboration with industry experts

REPORT WRITING

Qualitative

  • Market drivers
  • Market challenges
  • Market trends
  • Five forces analysis

Quantitative

  • Market size and forecast
  • Market segmentation
  • Geographical insights
  • Competitive landscape

Interested in this report?

Get your sample now to see our research methodology and insights!

Download Now

Frequently Asked Questions

ESG Reporting Software market growth will increase by USD 2084.1 million during 2026-2030.

The ESG Reporting Software market is expected to grow at a CAGR of 23.5% during 2026-2030.

ESG Reporting Software market is segmented by Deployment (On-premises, Cloud-based) Sector (Large enterprises, SMEs) End-user (BFSI, Energy and utilities, Manufacturing, Healthcare, Others) Type (Environmental management software, Social management software, Governance management software, Others)

Cority Software Inc., Diligent Corp., EcoVadis SAS, Figbytes Inc., Greenstoneplus Ltd., IBM Corp., Intelex Technologies ULC, Measurabl Inc., Microsoft Corp., Novisto Inc., Oracle Corp., Persefoni AI Inc., Position Green AS, Salesforce Inc., SAP SE, Sphera Solutions Inc., Sweep, Watershed Technology Inc., Wolters Kluwer NV, Workiva Inc. are a few of the key vendors in the ESG Reporting Software market.

North America will register the highest growth rate of 41.6% among the other regions. Therefore, the ESG Reporting Software market in North America is expected to garner significant business opportunities for the vendors during the forecast period.

US, Canada, Mexico, Germany, UK, France, Italy, Spain, The Netherlands, China, Japan, India, South Korea, Australia, Indonesia, Brazil, Argentina, Chile, Saudi Arabia, UAE, South Africa, Turkey, Israel

  • Institutionalization of mandatory disclosure mandates and transnational harmonization is the driving factor this market.

The ESG Reporting Software market vendors should focus on grabbing business opportunities from the Deployment segment as it accounted for the largest market share in the base year.
RIA - Research AI Assistant
Ask RIA