Ethyl Acetate Market Analysis, Size, and Forecast 2026-2030: APAC (China, Japan, and India), Europe (Germany, UK, and France), North America (US, Canada, and Mexico), Middle East and Africa (Saudi Arabia, UAE, and South Africa), South America (Brazil, Argentina, and Colombia), and Rest of World (ROW)

Ethyl Acetate Market Analysis, Size, and Forecast 2026-2030:
APAC (China, Japan, and India), Europe (Germany, UK, and France), North America (US, Canada, and Mexico), Middle East and Africa (Saudi Arabia, UAE, and South Africa), South America (Brazil, Argentina, and Colombia), and Rest of World (ROW)

Published: Mar 2026 309 Pages SKU: IRTNTR41141

Market Overview at a Glance

$1.75 B
Market Opportunity
5.5%
CAGR 2025 - 2030
76.3%
APAC Growth
$2.96 B
Paints and coatings segment 2024

Ethyl Acetate Market Size 2026-2030

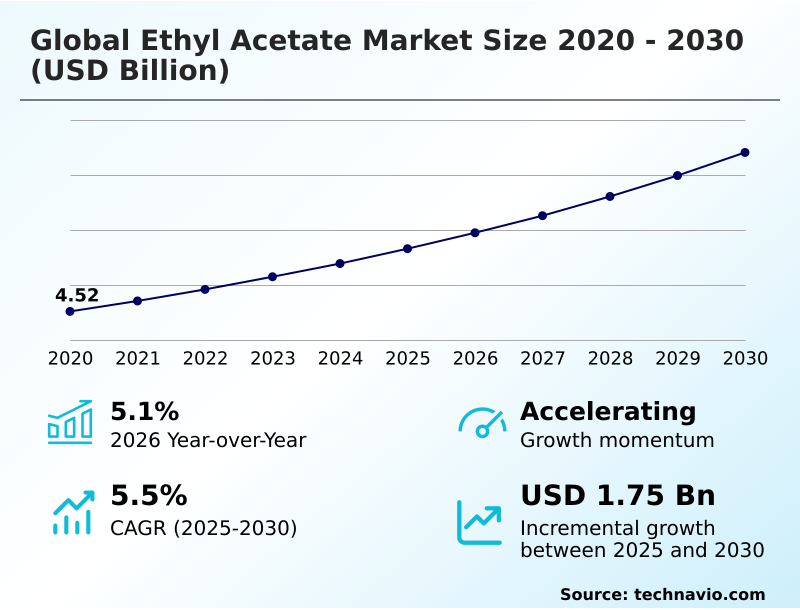
The ethyl acetate market size is valued to increase by USD 1.75 billion, at a CAGR of 5.5% from 2025 to 2030. Increasing demand for ethyl acetate from food and beverage industry will drive the ethyl acetate market.

Major Market Trends & Insights

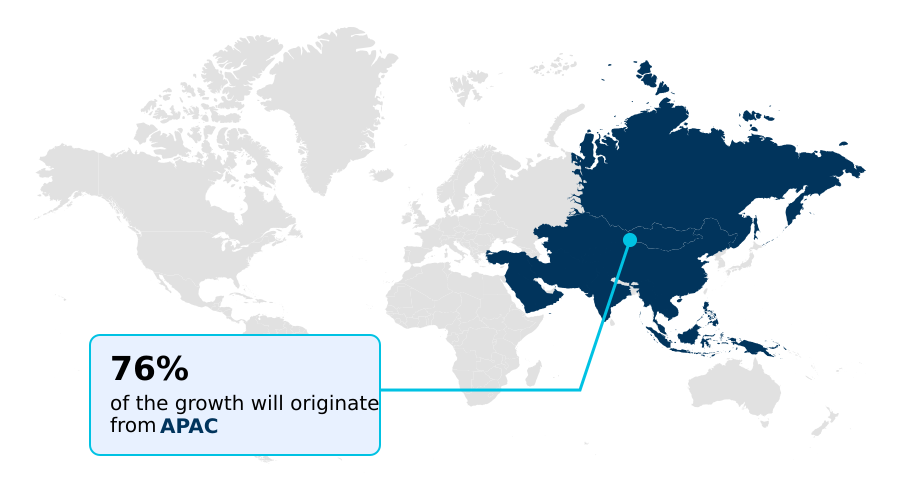
  • APAC dominated the market and accounted for a 76.3% growth during the forecast period.
  • By Application - Paints and coatings segment was valued at USD 2.96 billion in 2024
  • By End-user - Construction segment accounted for the largest market revenue share in 2024

Market Size & Forecast

  • Market Opportunities: USD 2.89 billion
  • Market Future Opportunities: USD 1.75 billion
  • CAGR from 2025 to 2030 : 5.5%

Market Summary

  • The ethyl acetate market is characterized by its fundamental role as a versatile organic solvent across a spectrum of industries, including paints, coatings, pharmaceuticals, and packaging. Its growth is propelled by increasing demand for high-performance materials in construction and automotive sectors, coupled with rising consumption of packaged foods and personal care products.
  • A key trend shaping the landscape is the industry-wide shift toward sustainability, with a pronounced emphasis on developing bio-based alternatives derived from renewable feedstocks to meet stringent environmental regulations and evolving consumer preferences. This transition presents both opportunities for innovation and challenges related to cost-competitiveness and scalable production.
  • For instance, a flexible packaging manufacturer must balance the operational efficiency gained from a fast-evaporating solvent with the capital investment required for a new solvent recovery system to comply with volatile organic compound (VOC) emission standards.
  • Navigating the volatility of raw material prices, such as ethanol and acetic acid, while maintaining supply chain integrity remains a persistent operational hurdle for market participants. The market's trajectory is thus defined by a delicate balance between industrial demand, regulatory pressures, and the pursuit of sustainable manufacturing excellence.

What will be the Size of the Ethyl Acetate Market during the forecast period?

Get Key Insights on Market Forecast (PDF) Request Free Sample

How is the Ethyl Acetate Market Segmented?

The ethyl acetate industry research report provides comprehensive data (region-wise segment analysis), with forecasts and estimates in "USD million" for the period 2026-2030, as well as historical data from 2020-2024 for the following segments.

  • Application
    • Paints and coatings
    • Printing ink
    • Process solvents
    • Others
  • End-user
    • Construction
    • Automotive
    • Furniture
    • Food and beverages
    • Others
  • Distribution channel
    • Offline
    • Online
  • Geography
    • APAC
      • China
      • Japan
      • India
    • Europe
      • Germany
      • UK
      • France
    • North America
      • US
      • Canada
      • Mexico
    • Middle East and Africa
      • Saudi Arabia
      • UAE
      • South Africa
    • South America
      • Brazil
      • Argentina
      • Colombia
    • Rest of World (ROW)

By Application Insights

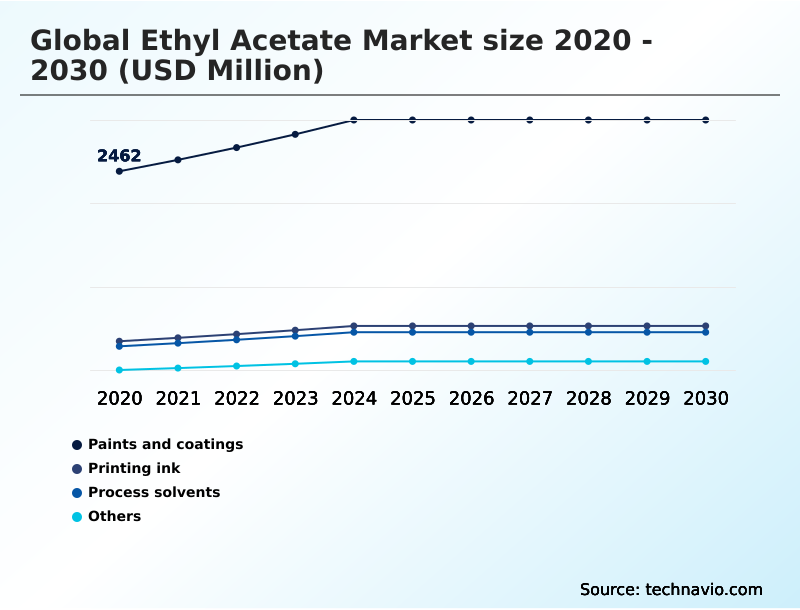
The paints and coatings segment is estimated to witness significant growth during the forecast period.

The paints and coatings segment remains a primary consumer, accounting for over 50% of total application-based consumption. Demand is driven by the need for superior coating film formation and high-performance finishes in construction and automotive sectors.

Effective solvent formulation technology is critical, with a focus on achieving optimal resin solubility performance and a fast evaporation rate to improve production efficiency.

Formulations often require a high purity specification to meet stringent end-user industry demand, especially for urethane grade solvent applications.

As part of a broader environmental impact assessment, there is a growing preference for low-odor formulation options that enhance product shelf life stability. Quality assurance systems ensure consistency across downstream industrial applications, solidifying the segment's market position.

Request Free Sample

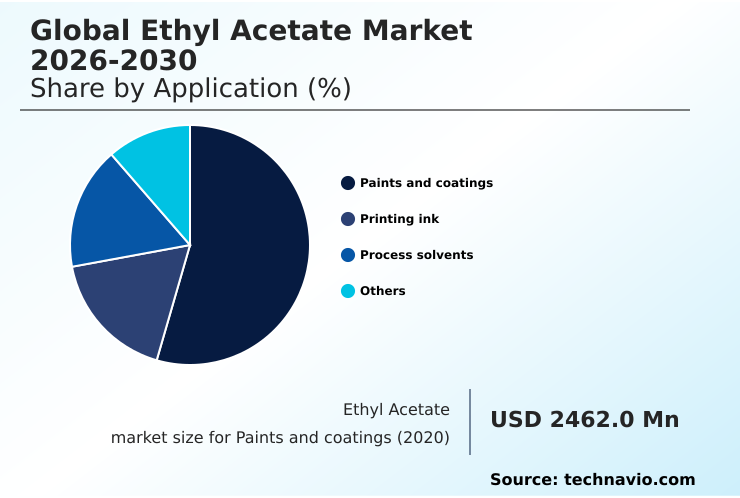
The Paints and coatings segment was valued at USD 2.96 billion in 2024 and showed a gradual increase during the forecast period.

Request Free Sample

Regional Analysis

APAC is estimated to contribute 76.3% to the growth of the global market during the forecast period.Technavio’s analysts have elaborately explained the regional trends and drivers that shape the market during the forecast period.

See How Ethyl Acetate Market Demand is Rising in APAC Request Free Sample

The geographic landscape is dominated by the APAC region, which accounts for over 75% of incremental growth, driven by its expansive manufacturing base.

The high end-user industry demand for industrial grade solvent in sectors like synthetic leather production underpins this dominance.

In contrast, North America and Europe focus on high-value applications, such as pharmaceutical grade solvent manufacturing, which requires advanced techniques like azeotropic distillation method for superior solvent purity analysis.

The production process, whether a traditional esterification process or a more advanced transesterification reaction, is optimized based on regional supply chain logistics and regulatory compliance framework.

The underlying reaction medium chemistry is refined to meet specific standards, with robust quality assurance systems ensuring consistency across all downstream industrial applications.

Market Dynamics

Our researchers analyzed the data with 2025 as the base year, along with the key drivers, trends, and challenges. A holistic analysis of drivers will help companies refine their marketing strategies to gain a competitive advantage.

  • The strategic application of ethyl acetate hinges on its specific properties and the processes used to produce it. The demand for high purity solvent for pharmaceuticals is driving advancements in production, including the refinement of the esterification process for solvent synthesis and the use of azeotropic distillation for high purity.
  • Simultaneously, sustainability goals are promoting the use of renewable feedstock for solvent production and the development of bio-based solvent for printing inks, aligning with green chemistry principles in production. This shift also involves exploring circular carbon feedstock utilization to reduce environmental footprints.
  • In industrial applications, it serves as a fast evaporating solvent for coatings and a versatile solvent for flexible packaging adhesives, where the right solvent properties for adhesive formulation are critical for performance. For printing, it is a key solvent for gravure and flexographic inks.
  • In food processing, its role as a low toxicity food flavor extraction medium and a solvent for decaffeination of coffee is well-established. The market also sees demand for its use in urethane grade industrial solvent uses and as a solvent for automotive refinishing coatings.
  • Its function as a chemical intermediate for organic synthesis and its performance as a solvent performance in synthetic leather production highlight its versatility.
  • A significant challenge remains controlling voc emissions from solvents, which is driving investment in solvent recovery systems in manufacturing and the use of an effective catalyst for transesterification reaction to improve process efficiency, with some systems demonstrating over 95% recovery rates compared to older methods.

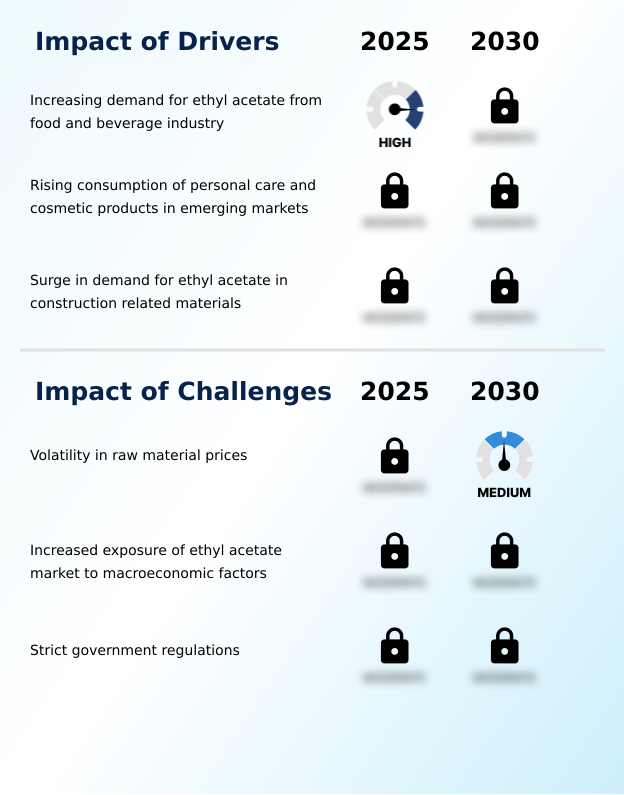
What are the key market drivers leading to the rise in the adoption of Ethyl Acetate Industry?

  • Increasing demand from the food and beverage industry serves as a key driver for the ethyl acetate market.

  • Growth is heavily influenced by downstream industrial applications, particularly in consumer-facing sectors.
  • The demand for high-quality flexible packaging adhesive and inks for both gravure printing ink and flexographic printing ink is a major driver, with innovations improving print quality enhancement by over 20%.
  • In the food and beverage industry, food grade solvent is essential for processes like flavor extraction solvent and as a decaffeination process solvent, where material residue minimization is critical.
  • The cosmetics sector also contributes, with nail polish remover formulation being a key application. This broad consumer product formulation base relies on consistent adhesive bonding strength and compliance with packaging safety standards to meet market expectations for quality and safety.

What are the market trends shaping the Ethyl Acetate Industry?

  • The growing adoption of bio-based ethyl acetate is a key market trend, as sustainability initiatives and regulatory pressures steer manufacturers toward renewable resources.

  • A significant trend is the industry's pivot toward a circular economy model, driven by advancements in sustainable production methods. The adoption of green chemistry principles is leading to the development of a closed-loop solvent portfolio, where circular carbon feedstock is utilized to create solvents, reducing lifecycle carbon footprints by up to 25%.
  • This shift is supported by increasing bio-based ethanol sourcing and the use of renewable feedstock utilization. Leading manufacturers are achieving bio-based product certification, which improves their market position and aligns with a 15% increase in demand for sustainable materials.
  • Effective supply chain logistics and adherence to a strict regulatory compliance framework are essential for scaling these innovations, which also involve solvent blend customization to meet specific performance and environmental targets. These efforts are tracked via process efficiency metrics to validate greenhouse gas emissions reduction.

What challenges does the Ethyl Acetate Industry face during its growth?

  • Volatility in raw material prices presents a key challenge affecting industry growth.

  • Market stability is challenged by feedstock price volatility, particularly for primary inputs like acetic acid feedstock and ethanol feedstock. This instability requires robust supply chain logistics and flexible procurement strategies. Simultaneously, regulatory pressures to limit volatile organic compound (VOC) emissions necessitate investments in process solvent recovery and catalytic conversion technology.
  • Adherence to stringent occupational safety standards and chemical handling protocols adds operational complexity, especially concerning transport in containers like a high-density polyethylene drum. Ensuring solvent compatibility in formulations while managing costs and compliance is a constant balancing act. Innovations like advanced fractional distillation can improve purity but also increase capital expenditure, with some systems delivering up to 10% higher yields.

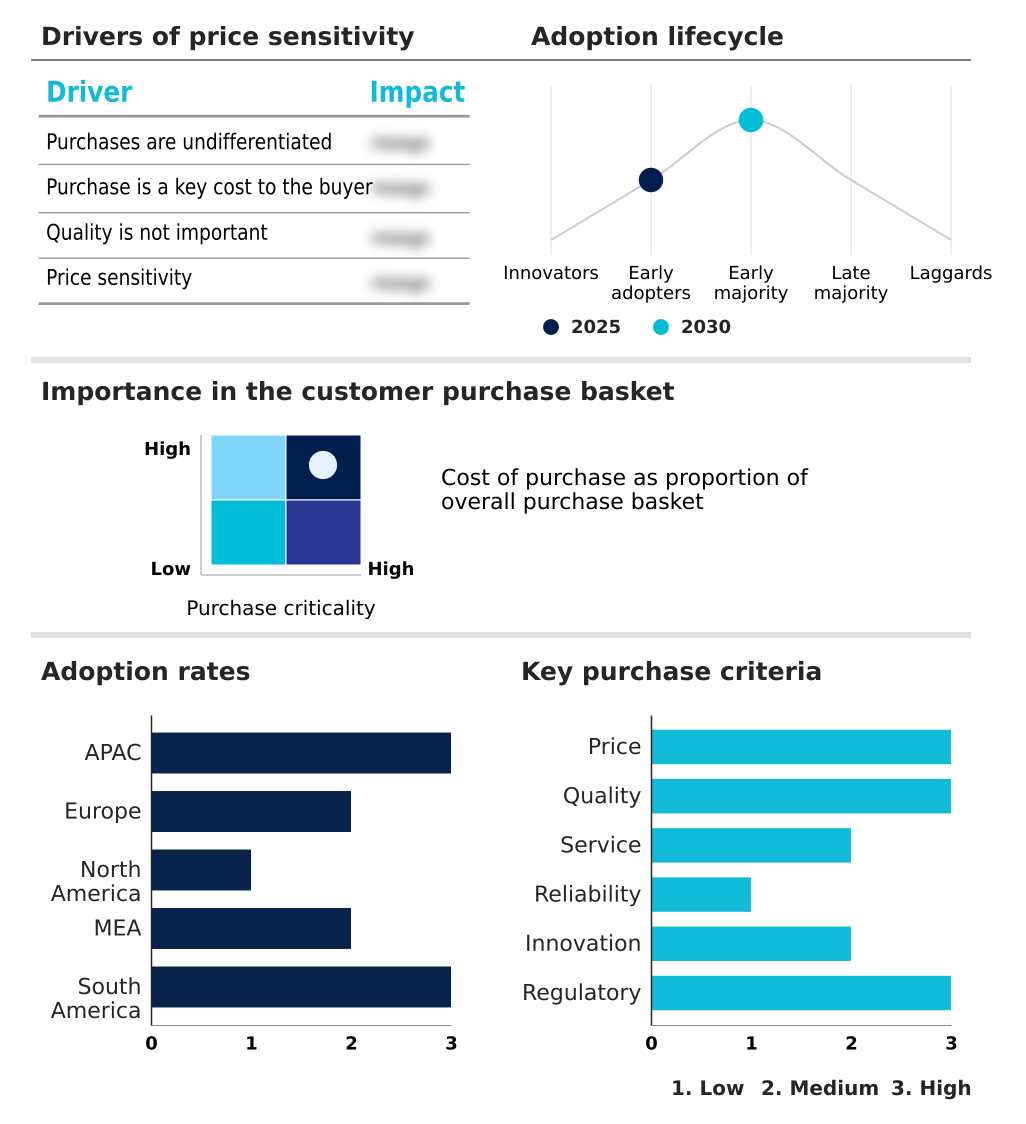
Exclusive Technavio Analysis on Customer Landscape

The ethyl acetate market forecasting report includes the adoption lifecycle of the market, covering from the innovator’s stage to the laggard’s stage. It focuses on adoption rates in different regions based on penetration. Furthermore, the ethyl acetate market report also includes key purchase criteria and drivers of price sensitivity to help companies evaluate and develop their market growth analysis strategies.

Customer Landscape of Ethyl Acetate Industry

Competitive Landscape

Companies are implementing various strategies, such as strategic alliances, ethyl acetate market forecast, partnerships, mergers and acquisitions, geographical expansion, and product/service launches, to enhance their presence in the industry.

Accordd Organics - Specialized ethyl acetate is provided for paints, coatings, adhesives, and packaging, fulfilling diverse industrial needs with high-purity and customized formulations.

The industry research and growth report includes detailed analyses of the competitive landscape of the market and information about key companies, including:

  • Accordd Organics
  • Celanese Corp.
  • Central Drug House Pvt. Ltd.
  • Daicel Corp.
  • Dev International
  • DHALOP CHEMICALS
  • Eastman Chemical Co.
  • Godavari Biorefineries Ltd.
  • IOL Chemicals and Pharma Ltd.
  • Jubilant Ingrevia Ltd.
  • Modi Chemical
  • SEKAB Biofuels and Chemicals
  • Shandong Jinyimeng Group Co.
  • Sipchem Co.
  • Solvay SA

Qualitative and quantitative analysis of companies has been conducted to help clients understand the wider business environment as well as the strengths and weaknesses of key industry players. Data is qualitatively analyzed to categorize companies as pure play, category-focused, industry-focused, and diversified; it is quantitatively analyzed to categorize companies as dominant, leading, strong, tentative, and weak.

Recent Development and News in Ethyl acetate market

  • In March, 2025, INEOS USA expanded its ethyl acetate production capacity at its Texas facility to address rising demand from key end-use sectors such as paints and coatings, adhesives, and flexible packaging.
  • In January, 2025, Celanese Corp. launched a new bio-based ethyl acetate line derived from renewable ethanol feedstocks, targeting sustainable supply for paints, inks, and pharmaceutical solvent applications.
  • In November, 2024, Eastman Chemical Co. announced a partnership with LanzaTech to scale circular ethyl acetate production using captured carbon emissions from industrial sources, aiming to lower greenhouse gas emissions.
  • In April, 2025, Dow Inc. initiated pilot-scale trials for a green ethyl acetate manufacturing process that uses advanced catalytic conversion technologies to improve production efficiency and reduce energy consumption.

Dive into Technavio’s robust research methodology, blending expert interviews, extensive data synthesis, and validated models for unparalleled Ethyl Acetate Market insights. See full methodology.

Market Scope
Page number 309
Base year 2025
Historic period 2020-2024
Forecast period 2026-2030
Growth momentum & CAGR Accelerate at a CAGR of 5.5%
Market growth 2026-2030 USD 1749.4 million
Market structure Fragmented
YoY growth 2025-2026(%) 5.1%
Key countries China, Japan, India, Indonesia, South Korea, Australia, Germany, UK, France, Italy, Spain, The Netherlands, US, Canada, Mexico, Saudi Arabia, UAE, South Africa, Israel, Turkey, Brazil, Argentina and Colombia
Competitive landscape Leading Companies, Market Positioning of Companies, Competitive Strategies, and Industry Risks

Request Free Sample

Research Analyst Overview

  • The ethyl acetate market is defined by its core production methods and versatile applications. The foundational esterification process, relying on acetic acid feedstock and ethanol feedstock, is increasingly being supplemented by transesterification reaction and catalytic conversion technology to align with green chemistry principles.
  • Purity is achieved through fractional distillation and the azeotropic distillation method, yielding industrial grade solvent, pharmaceutical grade solvent, and food grade solvent. These variants serve critical roles as a solvent extraction medium and reaction medium chemistry base.
  • A key trend is the shift to sustainability, involving bio-based ethanol sourcing, renewable feedstock utilization, and the development of a circular carbon feedstock supply chain. This move supports the creation of a closed-loop solvent portfolio and products with a low toxicity solvent profile.
  • Key performance characteristics include a fast evaporation rate and superior resin solubility performance, which are crucial for applications like coating film formation in paints, flexible packaging adhesive, gravure printing ink, and flexographic printing ink. The high purity specification is vital for its use as a flavor extraction solvent, decaffeination process solvent, and in nail polish remover formulation.
  • For boardroom decisions, the adoption of advanced solvent recovery system technology is paramount, as it directly impacts compliance with volatile organic compound (VOC) regulations and offers a verifiable 15% reduction in operational costs. This strategic investment in solvent formulation technology is essential for maintaining competitiveness in sectors like synthetic leather production and for products like urethane grade solvent.
  • Safe handling is managed with packaging like the high-density polyethylene drum.

What are the Key Data Covered in this Ethyl Acetate Market Research and Growth Report?

  • What is the expected growth of the Ethyl Acetate Market between 2026 and 2030?

    • USD 1.75 billion, at a CAGR of 5.5%

  • What segmentation does the market report cover?

    • The report is segmented by Application (Paints and coatings, Printing ink, Process solvents, and Others), End-user (Construction, Automotive, Furniture, Food and beverages, and Others), Distribution Channel (Offline, and Online) and Geography (APAC, Europe, North America, Middle East and Africa, South America)

  • Which regions are analyzed in the report?

    • APAC, Europe, North America, Middle East and Africa and South America

  • What are the key growth drivers and market challenges?

    • Increasing demand for ethyl acetate from food and beverage industry, Volatility in raw material prices

  • Who are the major players in the Ethyl Acetate Market?

    • Accordd Organics, Celanese Corp., Central Drug House Pvt. Ltd., Daicel Corp., Dev International, DHALOP CHEMICALS, Eastman Chemical Co., Godavari Biorefineries Ltd., IOL Chemicals and Pharma Ltd., Jubilant Ingrevia Ltd., Modi Chemical, SEKAB Biofuels and Chemicals, Shandong Jinyimeng Group Co., Sipchem Co. and Solvay SA

Market Research Insights

  • The market's dynamics are shaped by a complex interplay of operational and commercial factors. Effective supply chain logistics are critical to mitigating feedstock price volatility, while a robust regulatory compliance framework dictates everything from greenhouse gas emissions reduction targets to occupational safety standards.
  • Firms are leveraging process efficiency metrics to refine production, with some achieving a 10% improvement in output through optimized process solvent recovery and enhanced solvent compatibility. This focus on efficiency is vital for managing downstream industrial applications and meeting end-user industry demand. On the commercial side, solvent blend customization and low-odor formulation options create differentiation.
  • A strong environmental impact assessment and adherence to chemical handling protocols are non-negotiable, often validated by bio-based product certification. For consumer product formulation, achieving superior print quality enhancement, adhesive bonding strength, and surface coating performance is key.
  • This requires stringent quality assurance systems and solvent purity analysis to ensure material residue minimization, compliance with packaging safety standards, and extended product shelf life stability. Success hinges on a holistic circular economy model that integrates sustainable production methods, from biorefinery integration in chemical intermediate synthesis to the final analytical laboratory standard.

We can help! Our analysts can customize this ethyl acetate market research report to meet your requirements.

Get in touch

1. Executive Summary

1.1 Market overview

Executive Summary - Chart on Market Overview
Executive Summary - Data Table on Market Overview
Executive Summary - Chart on Global Market Characteristics
Executive Summary - Chart on Market by Geography
Executive Summary - Chart on Market Segmentation by Application
Executive Summary - Chart on Market Segmentation by End-user
Executive Summary - Chart on Market Segmentation by Distribution Channel
Executive Summary - Chart on Incremental Growth
Executive Summary - Data Table on Incremental Growth
Executive Summary - Chart on Company Market Positioning

2. Technavio Analysis

2.1 Analysis of price sensitivity, lifecycle, customer purchase basket, adoption rates, and purchase criteria

2.2 Criticality of inputs and Factors of differentiation

Chart on Overview on criticality of inputs and factors of differentiation

2.3 Factors of disruption

Chart on Overview on factors of disruption

2.4 Impact of drivers and challenges

Chart on Impact of drivers and challenges in 2025 and 2030

3. Market Landscape

3.1 Market ecosystem

Chart on Parent Market
Data Table on - Parent Market

3.2 Market characteristics

Chart on Market characteristics analysis

3.3 Value chain analysis

Chart on Value chain analysis

4. Market Sizing

4.1 Market definition

Data Table on Offerings of companies included in the market definition

4.2 Market segment analysis

Market segments

4.3 Market size 2025

4.4 Market outlook: Forecast for 2025-2030

Chart on Global - Market size and forecast 2025-2030 ($ million)
Data Table on Global - Market size and forecast 2025-2030 ($ million)
Chart on Global Market: Year-over-year growth 2025-2030 (%)
Data Table on Global Market: Year-over-year growth 2025-2030 (%)

5. Historic Market Size

5.1 Global Ethyl Acetate Market 2020 - 2024

Historic Market Size - Data Table on Global Ethyl Acetate Market 2020 - 2024 ($ million)

5.2 Application segment analysis 2020 - 2024

Historic Market Size - Application Segment 2020 - 2024 ($ million)

5.3 End-user segment analysis 2020 - 2024

Historic Market Size - End-user Segment 2020 - 2024 ($ million)

5.4 Distribution Channel segment analysis 2020 - 2024

Historic Market Size - Distribution Channel Segment 2020 - 2024 ($ million)

5.5 Geography segment analysis 2020 - 2024

Historic Market Size - Geography Segment 2020 - 2024 ($ million)

5.6 Country segment analysis 2020 - 2024

Historic Market Size - Country Segment 2020 - 2024 ($ million)

6. Qualitative Analysis

6.1 AI impact on Global Ethyl Acetate Market

7. Five Forces Analysis

7.1 Five forces summary

Five forces analysis - Comparison between 2025 and 2030

7.2 Bargaining power of buyers

Bargaining power of buyers - Impact of key factors 2025 and 2030

7.3 Bargaining power of suppliers

Bargaining power of suppliers - Impact of key factors in 2025 and 2030

7.4 Threat of new entrants

Threat of new entrants - Impact of key factors in 2025 and 2030

7.5 Threat of substitutes

Threat of substitutes - Impact of key factors in 2025 and 2030

7.6 Threat of rivalry

Threat of rivalry - Impact of key factors in 2025 and 2030

7.7 Market condition

Chart on Market condition - Five forces 2025 and 2030

8. Market Segmentation by Application

8.1 Market segments

Chart on Application - Market share 2025-2030 (%)
Data Table on Application - Market share 2025-2030 (%)

8.2 Comparison by Application

Chart on Comparison by Application
Data Table on Comparison by Application

8.3 Paints and coatings - Market size and forecast 2025-2030

Chart on Paints and coatings - Market size and forecast 2025-2030 ($ million)
Data Table on Paints and coatings - Market size and forecast 2025-2030 ($ million)
Chart on Paints and coatings - Year-over-year growth 2025-2030 (%)
Data Table on Paints and coatings - Year-over-year growth 2025-2030 (%)

8.4 Printing ink - Market size and forecast 2025-2030

Chart on Printing ink - Market size and forecast 2025-2030 ($ million)
Data Table on Printing ink - Market size and forecast 2025-2030 ($ million)
Chart on Printing ink - Year-over-year growth 2025-2030 (%)
Data Table on Printing ink - Year-over-year growth 2025-2030 (%)

8.5 Process solvents - Market size and forecast 2025-2030

Chart on Process solvents - Market size and forecast 2025-2030 ($ million)
Data Table on Process solvents - Market size and forecast 2025-2030 ($ million)
Chart on Process solvents - Year-over-year growth 2025-2030 (%)
Data Table on Process solvents - Year-over-year growth 2025-2030 (%)

8.6 Others - Market size and forecast 2025-2030

Chart on Others - Market size and forecast 2025-2030 ($ million)
Data Table on Others - Market size and forecast 2025-2030 ($ million)
Chart on Others - Year-over-year growth 2025-2030 (%)
Data Table on Others - Year-over-year growth 2025-2030 (%)

8.7 Market opportunity by Application

Market opportunity by Application ($ million)
Data Table on Market opportunity by Application ($ million)

9. Market Segmentation by End-user

9.1 Market segments

Chart on End-user - Market share 2025-2030 (%)
Data Table on End-user - Market share 2025-2030 (%)

9.2 Comparison by End-user

Chart on Comparison by End-user
Data Table on Comparison by End-user

9.3 Construction - Market size and forecast 2025-2030

Chart on Construction - Market size and forecast 2025-2030 ($ million)
Data Table on Construction - Market size and forecast 2025-2030 ($ million)
Chart on Construction - Year-over-year growth 2025-2030 (%)
Data Table on Construction - Year-over-year growth 2025-2030 (%)

9.4 Automotive - Market size and forecast 2025-2030

Chart on Automotive - Market size and forecast 2025-2030 ($ million)
Data Table on Automotive - Market size and forecast 2025-2030 ($ million)
Chart on Automotive - Year-over-year growth 2025-2030 (%)
Data Table on Automotive - Year-over-year growth 2025-2030 (%)

9.5 Furniture - Market size and forecast 2025-2030

Chart on Furniture - Market size and forecast 2025-2030 ($ million)
Data Table on Furniture - Market size and forecast 2025-2030 ($ million)
Chart on Furniture - Year-over-year growth 2025-2030 (%)
Data Table on Furniture - Year-over-year growth 2025-2030 (%)

9.6 Food and beverages - Market size and forecast 2025-2030

Chart on Food and beverages - Market size and forecast 2025-2030 ($ million)
Data Table on Food and beverages - Market size and forecast 2025-2030 ($ million)
Chart on Food and beverages - Year-over-year growth 2025-2030 (%)
Data Table on Food and beverages - Year-over-year growth 2025-2030 (%)

9.7 Others - Market size and forecast 2025-2030

Chart on Others - Market size and forecast 2025-2030 ($ million)
Data Table on Others - Market size and forecast 2025-2030 ($ million)
Chart on Others - Year-over-year growth 2025-2030 (%)
Data Table on Others - Year-over-year growth 2025-2030 (%)

9.8 Market opportunity by End-user

Market opportunity by End-user ($ million)
Data Table on Market opportunity by End-user ($ million)

10. Market Segmentation by Distribution Channel

10.1 Market segments

Chart on Distribution Channel - Market share 2025-2030 (%)
Data Table on Distribution Channel - Market share 2025-2030 (%)

10.2 Comparison by Distribution Channel

Chart on Comparison by Distribution Channel
Data Table on Comparison by Distribution Channel

10.3 Offline - Market size and forecast 2025-2030

Chart on Offline - Market size and forecast 2025-2030 ($ million)
Data Table on Offline - Market size and forecast 2025-2030 ($ million)
Chart on Offline - Year-over-year growth 2025-2030 (%)
Data Table on Offline - Year-over-year growth 2025-2030 (%)

10.4 Online - Market size and forecast 2025-2030

Chart on Online - Market size and forecast 2025-2030 ($ million)
Data Table on Online - Market size and forecast 2025-2030 ($ million)
Chart on Online - Year-over-year growth 2025-2030 (%)
Data Table on Online - Year-over-year growth 2025-2030 (%)

10.5 Market opportunity by Distribution Channel

Market opportunity by Distribution Channel ($ million)
Data Table on Market opportunity by Distribution Channel ($ million)

11. Customer Landscape

11.1 Customer landscape overview

Analysis of price sensitivity, lifecycle, customer purchase basket, adoption rates, and purchase criteria

12. Geographic Landscape

12.1 Geographic segmentation

Chart on Market share by geography 2025-2030 (%)
Data Table on Market share by geography 2025-2030 (%)

12.2 Geographic comparison

Chart on Geographic comparison
Data Table on Geographic comparison

12.3 APAC - Market size and forecast 2025-2030

Chart on APAC - Market size and forecast 2025-2030 ($ million)
Data Table on APAC - Market size and forecast 2025-2030 ($ million)
Chart on APAC - Year-over-year growth 2025-2030 (%)
Data Table on APAC - Year-over-year growth 2025-2030 (%)
Chart on Regional Comparison - APAC
Data Table on Regional Comparison - APAC

12.3.1 China - Market size and forecast 2025-2030

Chart on China - Market size and forecast 2025-2030 ($ million)
Data Table on China - Market size and forecast 2025-2030 ($ million)
Chart on China - Year-over-year growth 2025-2030 (%)
Data Table on China - Year-over-year growth 2025-2030 (%)

12.3.2 Japan - Market size and forecast 2025-2030

Chart on Japan - Market size and forecast 2025-2030 ($ million)
Data Table on Japan - Market size and forecast 2025-2030 ($ million)
Chart on Japan - Year-over-year growth 2025-2030 (%)
Data Table on Japan - Year-over-year growth 2025-2030 (%)

12.3.3 India - Market size and forecast 2025-2030

Chart on India - Market size and forecast 2025-2030 ($ million)
Data Table on India - Market size and forecast 2025-2030 ($ million)
Chart on India - Year-over-year growth 2025-2030 (%)
Data Table on India - Year-over-year growth 2025-2030 (%)

12.3.4 Indonesia - Market size and forecast 2025-2030

Chart on Indonesia - Market size and forecast 2025-2030 ($ million)
Data Table on Indonesia - Market size and forecast 2025-2030 ($ million)
Chart on Indonesia - Year-over-year growth 2025-2030 (%)
Data Table on Indonesia - Year-over-year growth 2025-2030 (%)

12.3.5 South Korea - Market size and forecast 2025-2030

Chart on South Korea - Market size and forecast 2025-2030 ($ million)
Data Table on South Korea - Market size and forecast 2025-2030 ($ million)
Chart on South Korea - Year-over-year growth 2025-2030 (%)
Data Table on South Korea - Year-over-year growth 2025-2030 (%)

12.3.6 Australia - Market size and forecast 2025-2030

Chart on Australia - Market size and forecast 2025-2030 ($ million)
Data Table on Australia - Market size and forecast 2025-2030 ($ million)
Chart on Australia - Year-over-year growth 2025-2030 (%)
Data Table on Australia - Year-over-year growth 2025-2030 (%)

12.4 Europe - Market size and forecast 2025-2030

Chart on Europe - Market size and forecast 2025-2030 ($ million)
Data Table on Europe - Market size and forecast 2025-2030 ($ million)
Chart on Europe - Year-over-year growth 2025-2030 (%)
Data Table on Europe - Year-over-year growth 2025-2030 (%)
Chart on Regional Comparison - Europe
Data Table on Regional Comparison - Europe

12.4.1 Germany - Market size and forecast 2025-2030

Chart on Germany - Market size and forecast 2025-2030 ($ million)
Data Table on Germany - Market size and forecast 2025-2030 ($ million)
Chart on Germany - Year-over-year growth 2025-2030 (%)
Data Table on Germany - Year-over-year growth 2025-2030 (%)

12.4.2 UK - Market size and forecast 2025-2030

Chart on UK - Market size and forecast 2025-2030 ($ million)
Data Table on UK - Market size and forecast 2025-2030 ($ million)
Chart on UK - Year-over-year growth 2025-2030 (%)
Data Table on UK - Year-over-year growth 2025-2030 (%)

12.4.3 France - Market size and forecast 2025-2030

Chart on France - Market size and forecast 2025-2030 ($ million)
Data Table on France - Market size and forecast 2025-2030 ($ million)
Chart on France - Year-over-year growth 2025-2030 (%)
Data Table on France - Year-over-year growth 2025-2030 (%)

12.4.4 Italy - Market size and forecast 2025-2030

Chart on Italy - Market size and forecast 2025-2030 ($ million)
Data Table on Italy - Market size and forecast 2025-2030 ($ million)
Chart on Italy - Year-over-year growth 2025-2030 (%)
Data Table on Italy - Year-over-year growth 2025-2030 (%)

12.4.5 Spain - Market size and forecast 2025-2030

Chart on Spain - Market size and forecast 2025-2030 ($ million)
Data Table on Spain - Market size and forecast 2025-2030 ($ million)
Chart on Spain - Year-over-year growth 2025-2030 (%)
Data Table on Spain - Year-over-year growth 2025-2030 (%)

12.4.6 The Netherlands - Market size and forecast 2025-2030

Chart on The Netherlands - Market size and forecast 2025-2030 ($ million)
Data Table on The Netherlands - Market size and forecast 2025-2030 ($ million)
Chart on The Netherlands - Year-over-year growth 2025-2030 (%)
Data Table on The Netherlands - Year-over-year growth 2025-2030 (%)

12.5 North America - Market size and forecast 2025-2030

Chart on North America - Market size and forecast 2025-2030 ($ million)
Data Table on North America - Market size and forecast 2025-2030 ($ million)
Chart on North America - Year-over-year growth 2025-2030 (%)
Data Table on North America - Year-over-year growth 2025-2030 (%)
Chart on Regional Comparison - North America
Data Table on Regional Comparison - North America

12.5.1 US - Market size and forecast 2025-2030

Chart on US - Market size and forecast 2025-2030 ($ million)
Data Table on US - Market size and forecast 2025-2030 ($ million)
Chart on US - Year-over-year growth 2025-2030 (%)
Data Table on US - Year-over-year growth 2025-2030 (%)

12.5.2 Canada - Market size and forecast 2025-2030

Chart on Canada - Market size and forecast 2025-2030 ($ million)
Data Table on Canada - Market size and forecast 2025-2030 ($ million)
Chart on Canada - Year-over-year growth 2025-2030 (%)
Data Table on Canada - Year-over-year growth 2025-2030 (%)

12.5.3 Mexico - Market size and forecast 2025-2030

Chart on Mexico - Market size and forecast 2025-2030 ($ million)
Data Table on Mexico - Market size and forecast 2025-2030 ($ million)
Chart on Mexico - Year-over-year growth 2025-2030 (%)
Data Table on Mexico - Year-over-year growth 2025-2030 (%)

12.6 Middle East and Africa - Market size and forecast 2025-2030

Chart on Middle East and Africa - Market size and forecast 2025-2030 ($ million)
Data Table on Middle East and Africa - Market size and forecast 2025-2030 ($ million)
Chart on Middle East and Africa - Year-over-year growth 2025-2030 (%)
Data Table on Middle East and Africa - Year-over-year growth 2025-2030 (%)
Chart on Regional Comparison - Middle East and Africa
Data Table on Regional Comparison - Middle East and Africa

12.6.1 Saudi Arabia - Market size and forecast 2025-2030

Chart on Saudi Arabia - Market size and forecast 2025-2030 ($ million)
Data Table on Saudi Arabia - Market size and forecast 2025-2030 ($ million)
Chart on Saudi Arabia - Year-over-year growth 2025-2030 (%)
Data Table on Saudi Arabia - Year-over-year growth 2025-2030 (%)

12.6.2 UAE - Market size and forecast 2025-2030

Chart on UAE - Market size and forecast 2025-2030 ($ million)
Data Table on UAE - Market size and forecast 2025-2030 ($ million)
Chart on UAE - Year-over-year growth 2025-2030 (%)
Data Table on UAE - Year-over-year growth 2025-2030 (%)

12.6.3 South Africa - Market size and forecast 2025-2030

Chart on South Africa - Market size and forecast 2025-2030 ($ million)
Data Table on South Africa - Market size and forecast 2025-2030 ($ million)
Chart on South Africa - Year-over-year growth 2025-2030 (%)
Data Table on South Africa - Year-over-year growth 2025-2030 (%)

12.6.4 Israel - Market size and forecast 2025-2030

Chart on Israel - Market size and forecast 2025-2030 ($ million)
Data Table on Israel - Market size and forecast 2025-2030 ($ million)
Chart on Israel - Year-over-year growth 2025-2030 (%)
Data Table on Israel - Year-over-year growth 2025-2030 (%)

12.6.5 Turkey - Market size and forecast 2025-2030

Chart on Turkey - Market size and forecast 2025-2030 ($ million)
Data Table on Turkey - Market size and forecast 2025-2030 ($ million)
Chart on Turkey - Year-over-year growth 2025-2030 (%)
Data Table on Turkey - Year-over-year growth 2025-2030 (%)

12.7 South America - Market size and forecast 2025-2030

Chart on South America - Market size and forecast 2025-2030 ($ million)
Data Table on South America - Market size and forecast 2025-2030 ($ million)
Chart on South America - Year-over-year growth 2025-2030 (%)
Data Table on South America - Year-over-year growth 2025-2030 (%)
Chart on Regional Comparison - South America
Data Table on Regional Comparison - South America

12.7.1 Brazil - Market size and forecast 2025-2030

Chart on Brazil - Market size and forecast 2025-2030 ($ million)
Data Table on Brazil - Market size and forecast 2025-2030 ($ million)
Chart on Brazil - Year-over-year growth 2025-2030 (%)
Data Table on Brazil - Year-over-year growth 2025-2030 (%)

12.7.2 Argentina - Market size and forecast 2025-2030

Chart on Argentina - Market size and forecast 2025-2030 ($ million)
Data Table on Argentina - Market size and forecast 2025-2030 ($ million)
Chart on Argentina - Year-over-year growth 2025-2030 (%)
Data Table on Argentina - Year-over-year growth 2025-2030 (%)

12.7.3 Colombia - Market size and forecast 2025-2030

Chart on Colombia - Market size and forecast 2025-2030 ($ million)
Data Table on Colombia - Market size and forecast 2025-2030 ($ million)
Chart on Colombia - Year-over-year growth 2025-2030 (%)
Data Table on Colombia - Year-over-year growth 2025-2030 (%)

12.8 Market opportunity by geography

Market opportunity by geography ($ million)
Data Tables on Market opportunity by geography ($ million)

13. Drivers, Challenges, and Opportunity

13.1 Market drivers

Increasing demand for ethyl acetate from food and beverage industry
Rising consumption of personal care and cosmetic products in emerging markets
Surge in demand for ethyl acetate in construction related materials

13.2 Market challenges

Volatility in raw material prices
Increased exposure of ethyl acetate market to macroeconomic factors
Strict government regulations

13.3 Impact of drivers and challenges

Impact of drivers and challenges in 2025 and 2030

13.4 Market opportunities

Growing adoption of bio based ethyl acetate
Improving living standards driving demand for end user industries
Innovation in solvent formulations and packaging solutions

14. Competitive Landscape

14.1 Overview

14.2

Overview on criticality of inputs and factors of differentiation

14.3 Landscape disruption

Overview on factors of disruption

14.4 Industry risks

Impact of key risks on business

15. Competitive Analysis

15.1 Companies profiled

Companies covered

15.2 Company ranking index

15.3 Market positioning of companies

Matrix on companies position and classification

15.4 Accordd Organics

Accordd Organics - Overview
Accordd Organics - Product / Service
Accordd Organics - Key offerings
SWOT

15.5 Celanese Corp.

Celanese Corp. - Overview
Celanese Corp. - Business segments
Celanese Corp. - Key news
Celanese Corp. - Key offerings
Celanese Corp. - Segment focus
SWOT

15.6 Central Drug House Pvt. Ltd.

Central Drug House Pvt. Ltd. - Overview
Central Drug House Pvt. Ltd. - Product / Service
Central Drug House Pvt. Ltd. - Key offerings
SWOT

15.7 Daicel Corp.

Daicel Corp. - Overview
Daicel Corp. - Business segments
Daicel Corp. - Key news
Daicel Corp. - Key offerings
Daicel Corp. - Segment focus
SWOT

15.8 Dev International

Dev International - Overview
Dev International - Product / Service
Dev International - Key offerings
SWOT

15.9 DHALOP CHEMICALS

DHALOP CHEMICALS - Overview
DHALOP CHEMICALS - Product / Service
DHALOP CHEMICALS - Key offerings
SWOT

15.10 Eastman Chemical Co.

Eastman Chemical Co. - Overview
Eastman Chemical Co. - Business segments
Eastman Chemical Co. - Key news
Eastman Chemical Co. - Key offerings
Eastman Chemical Co. - Segment focus
SWOT

15.11 Godavari Biorefineries Ltd.

Godavari Biorefineries Ltd. - Overview
Godavari Biorefineries Ltd. - Business segments
Godavari Biorefineries Ltd. - Key offerings
Godavari Biorefineries Ltd. - Segment focus
SWOT

15.12 IOL Chemicals and Pharma Ltd.

IOL Chemicals and Pharma Ltd. - Overview
IOL Chemicals and Pharma Ltd. - Business segments
IOL Chemicals and Pharma Ltd. - Key offerings
IOL Chemicals and Pharma Ltd. - Segment focus
SWOT

15.13 Jubilant Ingrevia Ltd.

Jubilant Ingrevia Ltd. - Overview
Jubilant Ingrevia Ltd. - Product / Service
Jubilant Ingrevia Ltd. - Key news
Jubilant Ingrevia Ltd. - Key offerings
SWOT

15.14 Modi Chemical

Modi Chemical - Overview
Modi Chemical - Product / Service
Modi Chemical - Key offerings
SWOT

15.15 SEKAB Biofuels and Chemicals

SEKAB Biofuels and Chemicals - Overview
SEKAB Biofuels and Chemicals - Product / Service
SEKAB Biofuels and Chemicals - Key offerings
SWOT

15.16 Shandong Jinyimeng Group Co.

Shandong Jinyimeng Group Co. - Overview
Shandong Jinyimeng Group Co. - Product / Service
Shandong Jinyimeng Group Co. - Key offerings
SWOT

15.17 Sipchem Co.

Sipchem Co. - Overview
Sipchem Co. - Product / Service
Sipchem Co. - Key offerings
SWOT

15.18 Solvay SA

Solvay SA - Overview
Solvay SA - Business segments
Solvay SA - Key news
Solvay SA - Key offerings
Solvay SA - Segment focus
SWOT

16. Appendix

16.1 Scope of the report

Market definition
Objectives
Notes and caveats

16.2 Inclusions and exclusions checklist

Inclusions checklist
Exclusions checklist

16.3 Currency conversion rates for US$

16.4 Research methodology

16.5 Data procurement

Information sources

16.6 Data validation

16.7 Validation techniques employed for market sizing

16.8 Data synthesis

16.9 360 degree market analysis

16.10 List of abbreviations

Research Methodology

Technavio presents a detailed picture of the market by way of study, synthesis, and summation of data from multiple sources. The analysts have presented the various facets of the market with a particular focus on identifying the key industry influencers. The data thus presented is comprehensive, reliable, and the result of extensive research, both primary and secondary.

INFORMATION SOURCES

Primary sources

  • Manufacturers and suppliers
  • Channel partners
  • Industry experts
  • Strategic decision makers

Secondary sources

  • Industry journals and periodicals
  • Government data
  • Financial reports of key industry players
  • Historical data
  • Press releases

DATA ANALYSIS

Data Synthesis

  • Collation of data
  • Estimation of key figures
  • Analysis of derived insights

Data Validation

  • Triangulation with data models
  • Reference against proprietary databases
  • Corroboration with industry experts

REPORT WRITING

Qualitative

  • Market drivers
  • Market challenges
  • Market trends
  • Five forces analysis

Quantitative

  • Market size and forecast
  • Market segmentation
  • Geographical insights
  • Competitive landscape

Interested in this report?

Get your sample now to see our research methodology and insights!

Download Now

Frequently Asked Questions

Ethyl Acetate market growth will increase by USD 1749.4 million during 2026-2030.

The Ethyl Acetate market is expected to grow at a CAGR of 5.5% during 2026-2030.

Ethyl Acetate market is segmented by Application (Paints and coatings, Printing ink, Process solvents, Others) End-user (Construction, Automotive, Furniture, Food and beverages, Others) Distribution channel (Offline, Online)

Accordd Organics, Celanese Corp., Central Drug House Pvt. Ltd., Daicel Corp., Dev International, DHALOP CHEMICALS, Eastman Chemical Co., Godavari Biorefineries Ltd., IOL Chemicals and Pharma Ltd., Jubilant Ingrevia Ltd., Modi Chemical, SEKAB Biofuels and Chemicals, Shandong Jinyimeng Group Co., Sipchem Co., Solvay SA are a few of the key vendors in the Ethyl Acetate market.

APAC will register the highest growth rate of 76.3% among the other regions. Therefore, the Ethyl Acetate market in APAC is expected to garner significant business opportunities for the vendors during the forecast period.

China, Japan, India, Indonesia, South Korea, Australia, Germany, UK, France, Italy, Spain, The Netherlands, US, Canada, Mexico, Saudi Arabia, UAE, South Africa, Israel, Turkey, Brazil, Argentina, Colombia

  • Increasing demand for ethyl acetate from food and beverage industry is the driving factor this market.

The Ethyl Acetate market vendors should focus on grabbing business opportunities from the Application segment as it accounted for the largest market share in the base year.
RIA - Research AI Assistant
Ask RIA