Ethylene Glycol Market Analysis, Size, and Forecast 2025-2029: North America (US), Europe (Germany and Russia), Middle East and Africa (Iran), APAC (China, India, Japan, and South Korea), South America (Brazil), and Rest of World (ROW)

Ethylene Glycol Market Analysis, Size, and Forecast 2025-2029:
North America (US), Europe (Germany and Russia), Middle East and Africa (Iran), APAC (China, India, Japan, and South Korea), South America (Brazil), and Rest of World (ROW)

Published: Jun 2025 242 Pages SKU: IRTNTR72639

Market Overview at a Glance

$18.42 B
Market Opportunity
8.9%
CAGR
8.4
YoY growth 2024-2025(%)

Ethylene Glycol Market Size 2025-2029

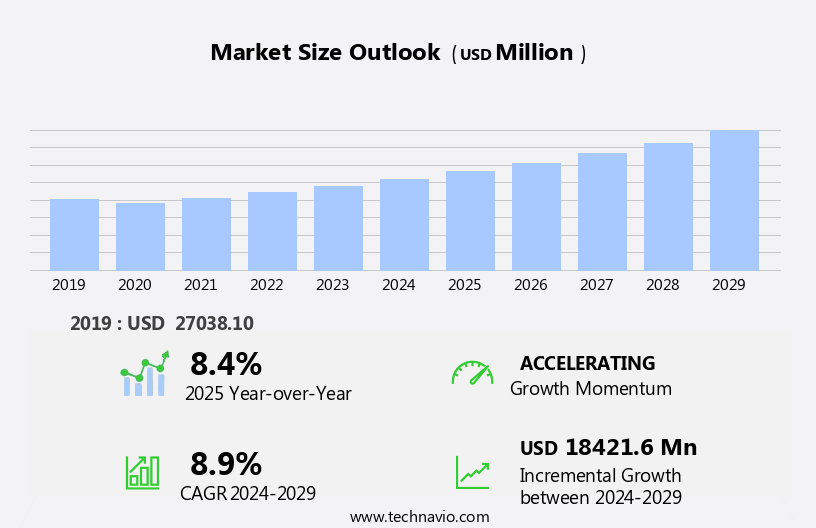
The ethylene glycol market size is forecast to increase by USD 18.42 billion, at a CAGR of 8.9% between 2024 and 2029.

  • The market is driven by the surging demand for polyester fibers, which account for a significant portion of ethylene glycol consumption. This trend is attributed to the growing preference for synthetic textiles due to their durability, affordability, and versatility. However, the market faces challenges from increasing environmental and regulatory pressures. Crude oil processing and natural gas processing are primary sources for ethylene glycol production. Ethylene glycol production contributes to greenhouse gas emissions and poses potential risks to water resources. Consequently, stringent regulations are being imposed to minimize the environmental impact of this chemical.
  • Companies must navigate these challenges by investing in research and development for eco-friendly production processes and collaborating with regulatory bodies to ensure compliance. By addressing these challenges, market participants can capitalize on the growing demand for ethylene glycol in the polyester industry and maintain a competitive edge. Ethylene glycol also finds application as a component in various chemicals, including Printing Inks, polymers, and plastics. Additionally, the industry is under pressure to adopt sustainable production methods, such as recycling and biodegradable alternatives, to mitigate environmental concerns.

What will be the Size of the Ethylene Glycol Market during the forecast period?

Ethylene Glycol Market Size

Explore in-depth regional segment analysis with market size data - historical 2019-2023 and forecasts 2025-2029 - in the full report.  
Request Free Sample

The market continues to evolve, driven by the diverse applications of this versatile chemical in various sectors. Ethylene glycol, a colorless, odorless, and viscous liquid, is a crucial component in the production of polyethylene terephthalate (PET) and polyester resin. Its chemical properties make it an essential ingredient in glycol ethers, glycol esters, and other industrial applications. Bio-based glycols are gaining traction in the market due to their eco-friendly nature, derived from renewable resources such as corn and sugarcane. The continuous unfolding of market activities is reflected in the evolving patterns of ethylene glycol usage. For instance, in the textile industry, it is used in finishing processes to improve fabric quality and enhance durability. In the realm of Renewable Energy, ethylene glycol is employed as a coolant in renewable MegaWatt-scale Energy Storage systems.

In the automotive sector, ethylene glycol is used as a coolant in brake fluid and hydraulic fluid, ensuring efficient heat transfer and corrosion inhibition. Its use in de-icing fluid and as a component in antifreeze solutions is essential in harsh weather conditions. Ethylene glycol's physical properties, such as its low freezing point, make it an ideal choice for these applications. The market is subject to price volatility due to factors such as supply chain disruptions, production capacity constraints, and environmental regulations. The industry's ongoing response to these challenges is shaping the market's future trajectory. For example, safety standards are being upheld through rigorous quality control measures, ensuring the safe handling and disposal of ethylene glycol and its derivatives.

The market's continuous dynamism is also reflected in its usage in industries such as paper manufacturing, water treatment, and occupational safety. Its role in waste management and natural gas processing is a testament to its versatility and importance in various industrial processes. The evolving market landscape is shaped by ongoing research and development efforts, driven by the need to optimize production processes and reduce environmental impact. In summary, the market's continuous evolution is shaped by its diverse applications across various sectors, including textile finishing, automotive, and industrial processes. The market's ongoing response to challenges such as price volatility, environmental regulations, and safety standards is shaping its future trajectory.

Ethylene glycol's chemical properties, such as its low freezing point and high boiling point, make it an essential ingredient in numerous industrial applications. The industry's focus on sustainability and eco-friendliness is driving the adoption of bio-based glycols, ensuring the market's continued growth and innovation. Polyethylene Terephthalate (PET) recycling and the use of diethylene glycol (DEG) in PET production are emerging areas of focus.  

How is this Ethylene Glycol Industry segmented?

The ethylene glycol industry research report provides comprehensive data (region-wise segment analysis), with forecasts and estimates in "USD million" for the period 2025-2029, as well as historical data from 2019-2023 for the following segments.

  • Type
    • MEG
    • DEG
    • TEG
  • Application
    • Polyester fiber and films
    • PET
    • Antifreeze and coolant
    • Others
  • Industry Application
    • Textile
    • Packaging
    • Automotive
  • Geography
    • North America
      • US
    • Europe
      • Germany
      • Russia
    • Middle East and Africa
      • Iran
    • APAC
      • China
      • India
      • Japan
      • South Korea
    • South America
      • Brazil
    • Rest of World (ROW)

By Type Insights

The MEG segment is estimated to witness significant growth during the forecast period. Mono Ethylene Glycol (MEG), the simplest diol with two hydroxyl groups, is the most extensively produced and consumed variant in the market. Due to its molecular structure, MEG functions effectively as a solvent, reactant, and heat transfer agent, making it a versatile compound in various industries. It is a crucial feedstock in the production of polyester fibers and Polyethylene Terephthalate (PET) resins, which are fundamental to textile, packaging, and beverage industries. These materials are used in fabric manufacturing, plastic bottle production, and various forms of flexible and rigid packaging. Propylene Glycol and Triethylene Glycol (TEG) are other significant ethylene glycol derivatives.

Propylene Glycol is employed as a solvent, antifreeze, and humectant in various industries, including textile finishing, cosmetics, and food processing. TEG, with its higher molecular weight, is used in the production of polyethylene glycol (PEG) and glycol ethers, which have applications in industries like oil drilling, lubricants, and asphalt modification. The market is influenced by various factors, including supply chain dynamics, production capacity, and price volatility. Renewable resources, such as biomass, are increasingly being explored as alternative feedstocks to reduce the environmental impact of glycol production.

Health and safety concerns, such as toxicity levels and corrosion inhibition, are essential considerations in the market. Quality control and storage conditions are crucial to ensure product purity and prevent contamination. Ethylene glycol derivatives like glycol esters, alkyd resins, and polyester resins, have applications in industries like paper manufacturing, water treatment, paints and coatings. Environmental regulations and sustainability initiatives are driving the demand for bio-based glycols and the recycling of Polyethylene Terephthalate (PET) to reduce waste and minimize the carbon footprint of the ethylene glycol industry. The market for ethylene glycol and its derivatives is expected to grow, driven by the increasing demand for textiles, packaging, and other industrial applications.

Ethylene Glycol Market Size

Request Free Sample

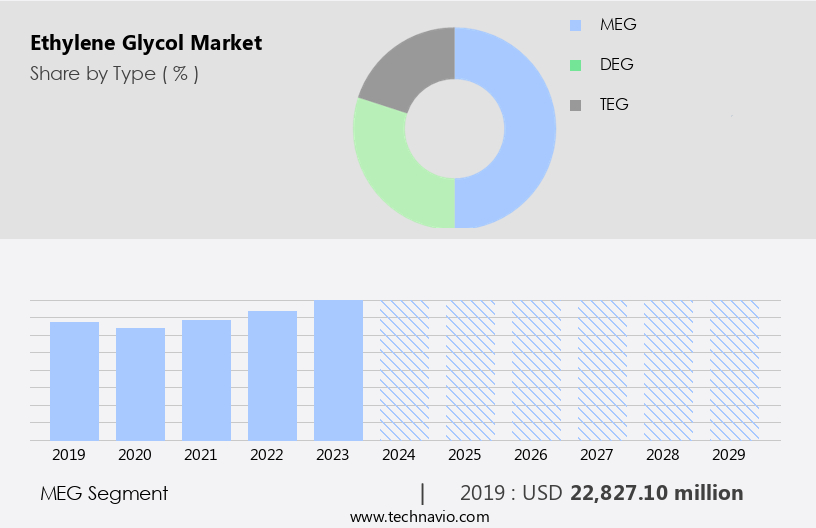
The MEG segment was valued at USD 22.83 billion in 2019 and showed a gradual increase during the forecast period.

Regional Analysis

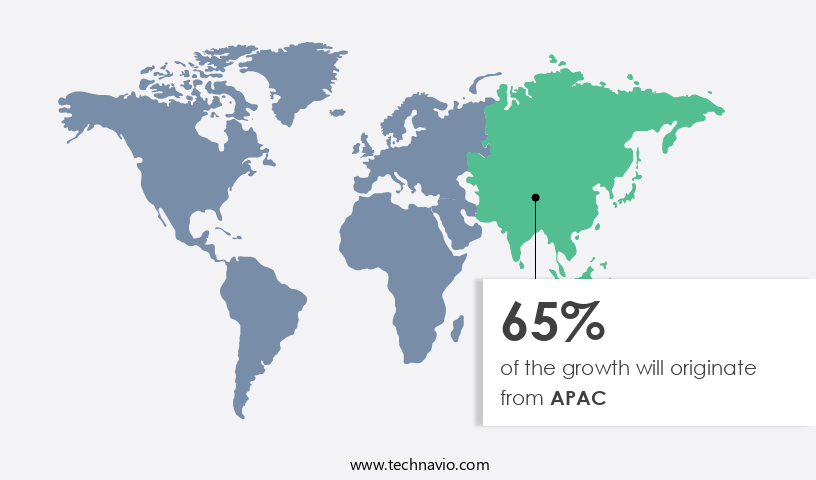
APAC is estimated to contribute 65% to the growth of the global market during the forecast period.Technavio's analysts have elaborately explained the regional trends and drivers that shape the market during the forecast period.

Ethylene Glycol Market Share by Geography

 Request Free Sample

The Ethylene Glycol (EG) market in the Asia-Pacific (APAC) region is experiencing significant growth due to the rapid industrialization and expansion of sectors like textile finishing, packaging, and automotive. China is a key player, leading global production and consumption with its abundant coal reserves, which are utilized through Coal-to-Monoethylene Glycol (CTM) technology. Major Chinese producers, including Sinopec, Hengli Petrochemical, and Zhejiang Rongsheng, operate large-scale facilities using coal gasification and naphtha-based crackers. The APAC the market is intricately linked to production technologies, trade dynamics, and sustainability goals. Propylene Glycol (PG) and Triethylene Glycol (TEG) are derivative products with various applications, such as in alkyd resins, de-icing fluids, and heat transfer fluids.

The market also encompasses bio-based glycols, derived from renewable resources, and glycol ethers, used in polyester resins and as solvents. The market demands strict quality control, storage conditions, and corrosion inhibition to ensure product safety and consistency. Ethylene oxide, a key intermediate, is produced through oxidation of ethylene under high pressure and temperature. The supply chain is influenced by crude oil processing, natural gas processing, and price volatility. Market demand is driven by applications in industries like paper manufacturing, water treatment, and food processing. The market's physical properties, such as freezing point and boiling point, are crucial in determining the applications.

EG is used as a heat transfer fluid, antifreeze in brake and hydraulic fluids, and as a solvent in various industries. The market also faces challenges in health and safety concerns, waste management, and environmental regulations. Production capacity expansion, driven by technological advancements and increasing demand, is a significant trend. The market's chemical properties and toxicity levels necessitate stringent safety standards and occupational safety measures. The evolving market dynamics and trends underscore the importance of understanding the complex interplay of production technologies, trade dynamics, and sustainability goals.

Market Dynamics

Our researchers analyzed the data with 2024 as the base year, along with the key drivers, trends, and challenges. A holistic analysis of drivers will help companies refine their marketing strategies to gain a competitive advantage.

What are the key market drivers leading to the rise in the adoption of Ethylene Glycol Industry?

  • The significant rise in the demand for polyester fibers serves as the primary catalyst for market growth. Ethylene glycol is a crucial chemical compound with diverse applications, primarily in the production of alkyd resins, de-icing fluids, and heat transfer fluids. In the realm of alkyd resins, ethylene glycol serves as a vital intermediate in the production of crude oil processing and gas processing industries. Furthermore, its use as a base component in the synthesis of glycol esters adds to its market significance. The increasing demand for ethylene glycol is driven by the growing need for lightweight, durable, and easy-care textiles, particularly polyester fibers. These fibers, derived from monoethylene glycol (MEG), are extensively used in the textile and apparel industries due to their versatility and affordability.
  • MEG is a critical raw material in the production of polyethylene terephthalate (PET), the primary polymer for polyester fibers. As global consumer preferences lean towards sustainable and eco-friendly alternatives, there is a growing interest in using renewable resources for ethylene glycol production. This trend is expected to gain momentum in the coming years, potentially disrupting the traditional crude oil-dependent production methods. Health and safety concerns, including toxicity levels, are essential factors influencing the market dynamics. Producers and consumers alike are increasingly focusing on implementing stringent safety measures to mitigate potential risks associated with its handling and usage.

What are the market trends shaping the Ethylene Glycol Industry?

  • Focusing on sustainable production is an essential trend in today's market. Professionals are increasingly prioritizing eco-friendly practices in manufacturing processes to meet consumer demand and minimize environmental impact. The market is witnessing significant advancements as the global focus shifts towards sustainable production methods. Regulatory pressures and environmental goals are driving the demand for low-carbon manufacturing pathways, reducing reliance on fossil-based feedstocks. A recent breakthrough in this regard was announced by researchers from the Dalian Institute of Chemical Physics and SinoSci Bio-EG in China. They successfully piloted a biomass-to-bio-based ethylene glycol process using sugars derived from starch and corn stalks. This catalytic conversion technology offers a renewable alternative to conventional petroleum- and coal-based methods, with a pilot capacity of 1,000 tonnes per year. Bio-based glycols, such as ethylene glycol, are gaining traction in various industries, including polyester resin, glycol ethers, freezing point depressants, and water treatment.
  • In the automotive sector, ethylene glycol is used as a primary ingredient in brake fluid and hydraulic fluid. In paper manufacturing, it acts as a solvent and a chemical intermediate. Its use in water treatment applications is essential for industrial processes and municipal wastewater treatment. Occupational safety is another crucial factor influencing the market dynamics. Ethylene glycol's chemical properties necessitate stringent safety measures during production, handling, and disposal. Producers and end-users must adhere to regulatory guidelines and best practices to ensure a safe working environment. The market is evolving, with a focus on sustainable production methods and safety regulations. The successful implementation of the biomass-to-bio-based ethylene glycol process marks a significant step towards reducing the industry's carbon footprint and promoting eco-friendly manufacturing.

What challenges does the Ethylene Glycol Industry face during its growth?

  • The industry's growth is significantly influenced by the complex interplay of environmental and regulatory pressures. These challenges necessitate continuous adaptation and compliance to ensure sustainable business practices. The market is subject to various market dynamics shaped by environmental and regulatory pressures. The toxicity of monoethylene glycol (MEG) necessitates stringent safety standards and regulations from agencies like the EPA, REACH, and the Ministry of Ecology and Environment of China. These guidelines cover production, storage, transportation, and disposal, necessitating advanced safety protocols, emission controls, and wastewater treatment systems.
  • Additionally, price volatility in raw materials, primarily natural gas, impacts the market. In food processing, diethylene glycol (DEG) is used instead of MEG due to its lower toxicity, which adds complexity to the market landscape. Overall, the market is influenced by various factors, including safety standards, environmental regulations, and raw material price volatility. Compliance costs for manufacturers increase due to these regulations. In regions with high textile and PET manufacturing concentrations, such as Asia and Europe, environmental regulations are becoming increasingly stringent.

Exclusive Customer Landscape

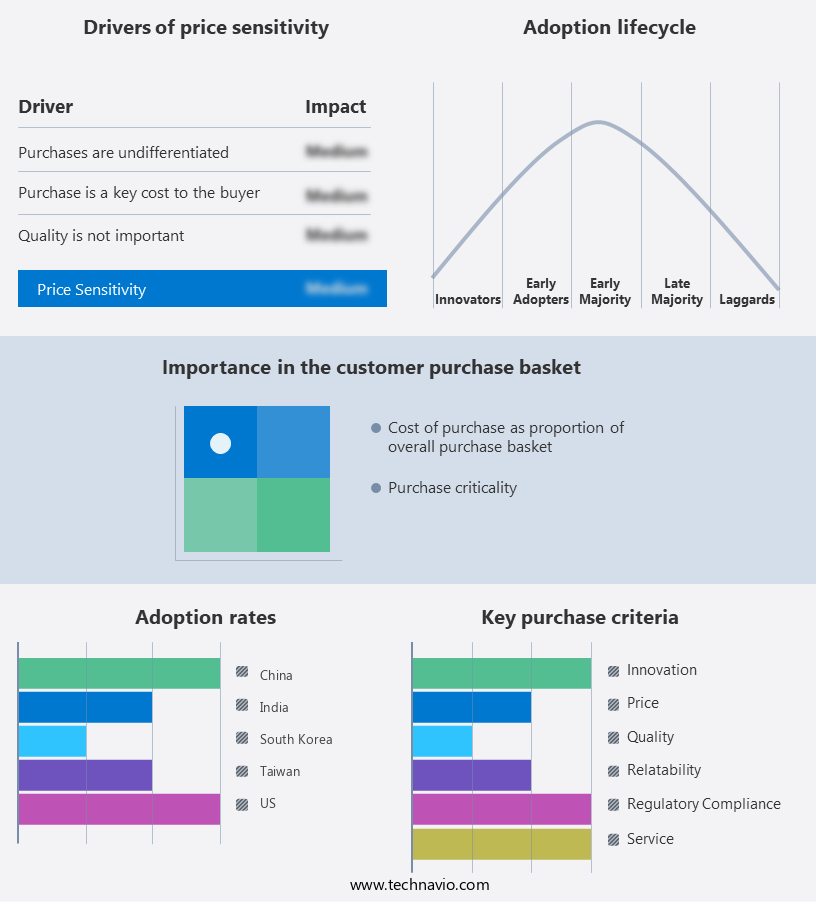
The ethylene glycol market forecasting report includes the adoption lifecycle of the market, covering from the innovator's stage to the laggard's stage. It focuses on adoption rates in different regions based on penetration. Furthermore, the ethylene glycol market report also includes key purchase criteria and drivers of price sensitivity to help companies evaluate and develop their market growth analysis strategies.

Ethylene Glycol Market Share by Geography

 Customer Landscape

Key Companies & Market Insights

Companies are implementing various strategies, such as strategic alliances, ethylene glycol market forecast, partnerships, mergers and acquisitions, geographical expansion, and product/service launches, to enhance their presence in the industry.

BASF SE - The company specializes in Ethylene Glycol, a versatile chemical compound widely utilized for its essential applications across multiple industrial sectors.

The industry research and growth report includes detailed analyses of the competitive landscape of the market and information about key companies, including:

  • BASF SE
  • China Petrochemical Corp.
  • Eastman Chemical Co.
  • Equate Petrochemical Co
  • Exxon Mobil Corp.
  • Huntsman Corp.
  • India Glycols Ltd.
  • Indorama Ventures Public Co. Ltd.
  • INEOS Group Holdings S.A.
  • Lotte Chemical Corp.
  • LyondellBasell Industries NV
  • Mitsubishi Chemical Group Corp.
  • Nan Ya Plastic Corp.
  • NIPPON SHOKUBAI CO. LTD.
  • PETRONAS Chemicals Group Berhad
  • PTT Global Chemical Public Co. Ltd.
  • Reliance Industries Ltd.
  • Saudi Basic Industries Corp.
  • Shell plc
  • The Dow Chemical Co.

Qualitative and quantitative analysis of companies has been conducted to help clients understand the wider business environment as well as the strengths and weaknesses of key industry players. Data is qualitatively analyzed to categorize companies as pure play, category-focused, industry-focused, and diversified; it is quantitatively analyzed to categorize companies as dominant, leading, strong, tentative, and weak.

Recent Development and News in Ethylene Glycol Market

  • In January 2024, INEOS Styrolution, the world's leading styrenics supplier, announced the expansion of its ethylene glycol production capacity at its Marl facility in Germany. This €100 million investment aimed to increase the site's output by 100,000 metric tons per annum (Mtpa), strengthening the company's position in The market (INEOS Styrolution press release).
  • In March 2024, Eastman Chemical Company and LG Chem signed a memorandum of understanding (MOU) to collaborate on the production and commercialization of bio-based ethylene glycol. The partnership aimed to leverage Eastman's biotechnology expertise and LG Chem's manufacturing capabilities to reduce the carbon footprint of ethylene glycol production (Eastman Chemical Company press release).
  • In July 2024, SABIC and Saudi Arabian Mining Company (Ma'aden) announced the completion of their joint venture, Ma'aden Ethylene Glycol Company (MEGC). This strategic partnership aimed to produce 600,000 Mtpa of ethylene glycol, making it one of the largest ethylene glycol production facilities in the world (SABIC press release).
  • In May 2025, Celanese Corporation announced the acquisition of DuPont's Performance Materials New Businesses, including its ethylene glycol business. This acquisition expanded Celanese's global ethylene glycol production capacity by 1.1 million Mtpa and significantly increased its market share (Celanese Corporation press release).

Research Analyst Overview

Ethylene glycol, a versatile chemical intermediate, plays a significant role in various industries, including antifreeze formulations and polymer synthesis. The market for ethylene glycol is influenced by several factors, including supply chain disruptions, safety regulations, and demand drivers. Quality control is crucial in the production of ethylene glycol, ensuring consistency in chemical intermediates for polyester fibers and resin production. Recycled content and sustainability initiatives have gained traction in the market, with an increasing focus on bio-based alternatives and reducing the environmental impact. Global production of ethylene glycol has been on the rise, driven by the growing demand for coolant blends and solvent applications. Manufacturing processes for ethylene glycol derivatives, such as glycol ethers, have evolved to improve efficiency and reduce costs.

However, the market faces challenges from regulatory requirements and potential safety concerns. Regional markets for ethylene glycol exhibit varying consumption patterns, with Asia Pacific leading the way due to its large manufacturing base and growing demand from end-use industries. The use of ethylene glycol in pet bottles and other applications continues to expand, driving the need for a reliable and sustainable supply chain. The market for ethylene glycol is dynamic, with ongoing trends shaping its future, including the adoption of advanced manufacturing processes and the development of new applications for this essential chemical intermediate. The market is driven by the burgeoning demand for polyester fibers, with MEG serving as a fundamental raw material in their production. The shift towards renewable resources and growing emphasis on health and safety are key trends shaping the market landscape.

Dive into Technavio's robust research methodology, blending expert interviews, extensive data synthesis, and validated models for unparalleled Ethylene Glycol Market insights. See full methodology.

Market Scope

Report Coverage

Details

Page number

242

Base year

2024

Historic period

2019-2023

Forecast period

2025-2029

Growth momentum & CAGR

Accelerate at a CAGR of 8.9%

Market growth 2025-2029

USD 18.42 billion

Market structure

Fragmented

YoY growth 2024-2025(%)

8.4

Key countries

China, India, US, South Korea, Japan, Germany, Russia, Saudi Arabia, Iran, and Brazil

Competitive landscape

Leading Companies, Market Positioning of Companies, Competitive Strategies, and Industry Risks

Request Free Sample

What are the Key Data Covered in this Ethylene Glycol Market Research and Growth Report?

  • CAGR of the Ethylene Glycol industry during the forecast period
  • Detailed information on factors that will drive the growth and forecasting between 2025 and 2029
  • Precise estimation of the size of the market and its contribution of the industry in focus to the parent market
  • Accurate predictions about upcoming growth and trends and changes in consumer behaviour
  • Growth of the market across APAC, North America, Europe, Middle East and Africa, and South America
  • Thorough analysis of the market's competitive landscape and detailed information about companies
  • Comprehensive analysis of factors that will challenge the ethylene glycol market growth of industry companies

We can help! Our analysts can customize this ethylene glycol market research report to meet your requirements.

Get in touch

1 Executive Summary

  • 1.1 Market overview
    • Executive Summary - Chart on Market Overview
    • Executive Summary - Data Table on Market Overview
    • Executive Summary - Chart on Global Market Characteristics
    • Executive Summary - Chart on Market by Geography
    • Executive Summary - Chart on Market Segmentation by Type
    • Executive Summary - Chart on Market Segmentation by Application
    • Executive Summary - Chart on Market Segmentation by Industry Application
    • Executive Summary - Chart on Incremental Growth
    • Executive Summary - Data Table on Incremental Growth
    • Executive Summary - Chart on Company Market Positioning

2 Technavio Analysis

  • 2.1 Analysis of price sensitivity, lifecycle, customer purchase basket, adoption rates, and purchase criteria
    • Analysis of price sensitivity, lifecycle, customer purchase basket, adoption rates, and purchase criteria
  • 2.2 Criticality of inputs and Factors of differentiation
    • Overview on criticality of inputs and factors of differentiation
  • 2.3 Factors of disruption
    • Overview on factors of disruption
  • 2.4 Impact of drivers and challenges
    • Impact of drivers and challenges in 2024 and 2029

3 Market Landscape

  • 3.1 Market ecosystem
    • Parent Market
    • Data Table on - Parent Market
  • 3.2 Market characteristics
    • Market characteristics analysis
  • 3.3 Value chain analysis
    • Value chain analysis

4 Market Sizing

  • 4.1 Market definition
    • Offerings of companies included in the market definition
  • 4.2 Market segment analysis
    • Market segments
  • 4.3 Market size 2024
    • 4.4 Market outlook: Forecast for 2024-2029
      • Chart on Global - Market size and forecast 2024-2029 ($ million)
      • Data Table on Global - Market size and forecast 2024-2029 ($ million)
      • Chart on Global Market: Year-over-year growth 2024-2029 (%)
      • Data Table on Global Market: Year-over-year growth 2024-2029 (%)

    5 Historic Market Size

    • 5.1 Global Ethylene Glycol Market 2019 - 2023
      • Historic Market Size - Data Table on Global Ethylene Glycol Market 2019 - 2023 ($ million)
    • 5.2 Type segment analysis 2019 - 2023
      • Historic Market Size - Type Segment 2019 - 2023 ($ million)
    • 5.3 Application segment analysis 2019 - 2023
      • Historic Market Size - Application Segment 2019 - 2023 ($ million)
    • 5.4 Industry Application segment analysis 2019 - 2023
      • Historic Market Size - Industry Application Segment 2019 - 2023 ($ million)
    • 5.5 Geography segment analysis 2019 - 2023
      • Historic Market Size - Geography Segment 2019 - 2023 ($ million)
    • 5.6 Country segment analysis 2019 - 2023
      • Historic Market Size - Country Segment 2019 - 2023 ($ million)

    6 Qualitative Analysis

    • 6.1 Impact Analysis of U.S. Tariffs on Global Ethylene Glycol Market

      7 Five Forces Analysis

      • 7.1 Five forces summary
        • Five forces analysis - Comparison between 2024 and 2029
      • 7.2 Bargaining power of buyers
        • Bargaining power of buyers - Impact of key factors 2024 and 2029
      • 7.3 Bargaining power of suppliers
        • Bargaining power of suppliers - Impact of key factors in 2024 and 2029
      • 7.4 Threat of new entrants
        • Threat of new entrants - Impact of key factors in 2024 and 2029
      • 7.5 Threat of substitutes
        • Threat of substitutes - Impact of key factors in 2024 and 2029
      • 7.6 Threat of rivalry
        • Threat of rivalry - Impact of key factors in 2024 and 2029
      • 7.7 Market condition
        • Chart on Market condition - Five forces 2024 and 2029

      8 Market Segmentation by Type

      • 8.1 Market segments
        • Chart on Type - Market share 2024-2029 (%)
        • Data Table on Type - Market share 2024-2029 (%)
      • 8.2 Comparison by Type
        • Chart on Comparison by Type
        • Data Table on Comparison by Type
      • 8.3 MEG - Market size and forecast 2024-2029
        • Chart on MEG - Market size and forecast 2024-2029 ($ million)
        • Data Table on MEG - Market size and forecast 2024-2029 ($ million)
        • Chart on MEG - Year-over-year growth 2024-2029 (%)
        • Data Table on MEG - Year-over-year growth 2024-2029 (%)
      • 8.4 DEG - Market size and forecast 2024-2029
        • Chart on DEG - Market size and forecast 2024-2029 ($ million)
        • Data Table on DEG - Market size and forecast 2024-2029 ($ million)
        • Chart on DEG - Year-over-year growth 2024-2029 (%)
        • Data Table on DEG - Year-over-year growth 2024-2029 (%)
      • 8.5 TEG - Market size and forecast 2024-2029
        • Chart on TEG - Market size and forecast 2024-2029 ($ million)
        • Data Table on TEG - Market size and forecast 2024-2029 ($ million)
        • Chart on TEG - Year-over-year growth 2024-2029 (%)
        • Data Table on TEG - Year-over-year growth 2024-2029 (%)
      • 8.6 Market opportunity by Type
        • Market opportunity by Type ($ million)
        • Data Table on Market opportunity by Type ($ million)

      9 Market Segmentation by Application

      • 9.1 Market segments
        • Chart on Application - Market share 2024-2029 (%)
        • Data Table on Application - Market share 2024-2029 (%)
      • 9.2 Comparison by Application
        • Chart on Comparison by Application
        • Data Table on Comparison by Application
      • 9.3 Polyester fiber and films - Market size and forecast 2024-2029
        • Chart on Polyester fiber and films - Market size and forecast 2024-2029 ($ million)
        • Data Table on Polyester fiber and films - Market size and forecast 2024-2029 ($ million)
        • Chart on Polyester fiber and films - Year-over-year growth 2024-2029 (%)
        • Data Table on Polyester fiber and films - Year-over-year growth 2024-2029 (%)
      • 9.4 PET - Market size and forecast 2024-2029
        • Chart on PET - Market size and forecast 2024-2029 ($ million)
        • Data Table on PET - Market size and forecast 2024-2029 ($ million)
        • Chart on PET - Year-over-year growth 2024-2029 (%)
        • Data Table on PET - Year-over-year growth 2024-2029 (%)
      • 9.5 Antifreeze and coolant - Market size and forecast 2024-2029
        • Chart on Antifreeze and coolant - Market size and forecast 2024-2029 ($ million)
        • Data Table on Antifreeze and coolant - Market size and forecast 2024-2029 ($ million)
        • Chart on Antifreeze and coolant - Year-over-year growth 2024-2029 (%)
        • Data Table on Antifreeze and coolant - Year-over-year growth 2024-2029 (%)
      • 9.6 Others - Market size and forecast 2024-2029
        • Chart on Others - Market size and forecast 2024-2029 ($ million)
        • Data Table on Others - Market size and forecast 2024-2029 ($ million)
        • Chart on Others - Year-over-year growth 2024-2029 (%)
        • Data Table on Others - Year-over-year growth 2024-2029 (%)
      • 9.7 Market opportunity by Application
        • Market opportunity by Application ($ million)
        • Data Table on Market opportunity by Application ($ million)

      10 Market Segmentation by Industry Application

      • 10.1 Market segments
        • Chart on Industry Application - Market share 2024-2029 (%)
        • Data Table on Industry Application - Market share 2024-2029 (%)
      • 10.2 Comparison by Industry Application
        • Chart on Comparison by Industry Application
        • Data Table on Comparison by Industry Application
      • 10.3 Textile - Market size and forecast 2024-2029
        • Chart on Textile - Market size and forecast 2024-2029 ($ million)
        • Data Table on Textile - Market size and forecast 2024-2029 ($ million)
        • Chart on Textile - Year-over-year growth 2024-2029 (%)
        • Data Table on Textile - Year-over-year growth 2024-2029 (%)
      • 10.4 Packaging - Market size and forecast 2024-2029
        • Chart on Packaging - Market size and forecast 2024-2029 ($ million)
        • Data Table on Packaging - Market size and forecast 2024-2029 ($ million)
        • Chart on Packaging - Year-over-year growth 2024-2029 (%)
        • Data Table on Packaging - Year-over-year growth 2024-2029 (%)
      • 10.5 Automotive - Market size and forecast 2024-2029
        • Chart on Automotive - Market size and forecast 2024-2029 ($ million)
        • Data Table on Automotive - Market size and forecast 2024-2029 ($ million)
        • Chart on Automotive - Year-over-year growth 2024-2029 (%)
        • Data Table on Automotive - Year-over-year growth 2024-2029 (%)
      • 10.6 Market opportunity by Industry Application
        • Market opportunity by Industry Application ($ million)
        • Data Table on Market opportunity by Industry Application ($ million)

      11 Customer Landscape

      • 11.1 Customer landscape overview
        • Analysis of price sensitivity, lifecycle, customer purchase basket, adoption rates, and purchase criteria

      12 Geographic Landscape

      • 12.1 Geographic segmentation
        • Chart on Market share by geography 2024-2029 (%)
        • Data Table on Market share by geography 2024-2029 (%)
      • 12.2 Geographic comparison
        • Chart on Geographic comparison
        • Data Table on Geographic comparison
      • 12.3 APAC - Market size and forecast 2024-2029
        • Chart on APAC - Market size and forecast 2024-2029 ($ million)
        • Data Table on APAC - Market size and forecast 2024-2029 ($ million)
        • Chart on APAC - Year-over-year growth 2024-2029 (%)
        • Data Table on APAC - Year-over-year growth 2024-2029 (%)
      • 12.4 North America - Market size and forecast 2024-2029
        • Chart on North America - Market size and forecast 2024-2029 ($ million)
        • Data Table on North America - Market size and forecast 2024-2029 ($ million)
        • Chart on North America - Year-over-year growth 2024-2029 (%)
        • Data Table on North America - Year-over-year growth 2024-2029 (%)
      • 12.5 Europe - Market size and forecast 2024-2029
        • Chart on Europe - Market size and forecast 2024-2029 ($ million)
        • Data Table on Europe - Market size and forecast 2024-2029 ($ million)
        • Chart on Europe - Year-over-year growth 2024-2029 (%)
        • Data Table on Europe - Year-over-year growth 2024-2029 (%)
      • 12.6 Middle East and Africa - Market size and forecast 2024-2029
        • Chart on Middle East and Africa - Market size and forecast 2024-2029 ($ million)
        • Data Table on Middle East and Africa - Market size and forecast 2024-2029 ($ million)
        • Chart on Middle East and Africa - Year-over-year growth 2024-2029 (%)
        • Data Table on Middle East and Africa - Year-over-year growth 2024-2029 (%)
      • 12.7 South America - Market size and forecast 2024-2029
        • Chart on South America - Market size and forecast 2024-2029 ($ million)
        • Data Table on South America - Market size and forecast 2024-2029 ($ million)
        • Chart on South America - Year-over-year growth 2024-2029 (%)
        • Data Table on South America - Year-over-year growth 2024-2029 (%)
      • 12.8 China - Market size and forecast 2024-2029
        • Chart on China - Market size and forecast 2024-2029 ($ million)
        • Data Table on China - Market size and forecast 2024-2029 ($ million)
        • Chart on China - Year-over-year growth 2024-2029 (%)
        • Data Table on China - Year-over-year growth 2024-2029 (%)
      • 12.9 India - Market size and forecast 2024-2029
        • Chart on India - Market size and forecast 2024-2029 ($ million)
        • Data Table on India - Market size and forecast 2024-2029 ($ million)
        • Chart on India - Year-over-year growth 2024-2029 (%)
        • Data Table on India - Year-over-year growth 2024-2029 (%)
      • 12.10 US - Market size and forecast 2024-2029
        • Chart on US - Market size and forecast 2024-2029 ($ million)
        • Data Table on US - Market size and forecast 2024-2029 ($ million)
        • Chart on US - Year-over-year growth 2024-2029 (%)
        • Data Table on US - Year-over-year growth 2024-2029 (%)
      • 12.11 South Korea - Market size and forecast 2024-2029
        • Chart on South Korea - Market size and forecast 2024-2029 ($ million)
        • Data Table on South Korea - Market size and forecast 2024-2029 ($ million)
        • Chart on South Korea - Year-over-year growth 2024-2029 (%)
        • Data Table on South Korea - Year-over-year growth 2024-2029 (%)
      • 12.12 Japan - Market size and forecast 2024-2029
        • Chart on Japan - Market size and forecast 2024-2029 ($ million)
        • Data Table on Japan - Market size and forecast 2024-2029 ($ million)
        • Chart on Japan - Year-over-year growth 2024-2029 (%)
        • Data Table on Japan - Year-over-year growth 2024-2029 (%)
      • 12.13 Germany - Market size and forecast 2024-2029
        • Chart on Germany - Market size and forecast 2024-2029 ($ million)
        • Data Table on Germany - Market size and forecast 2024-2029 ($ million)
        • Chart on Germany - Year-over-year growth 2024-2029 (%)
        • Data Table on Germany - Year-over-year growth 2024-2029 (%)
      • 12.14 Russia - Market size and forecast 2024-2029
        • Chart on Russia - Market size and forecast 2024-2029 ($ million)
        • Data Table on Russia - Market size and forecast 2024-2029 ($ million)
        • Chart on Russia - Year-over-year growth 2024-2029 (%)
        • Data Table on Russia - Year-over-year growth 2024-2029 (%)
      • 12.15 Saudi Arabia - Market size and forecast 2024-2029
        • Chart on Saudi Arabia - Market size and forecast 2024-2029 ($ million)
        • Data Table on Saudi Arabia - Market size and forecast 2024-2029 ($ million)
        • Chart on Saudi Arabia - Year-over-year growth 2024-2029 (%)
        • Data Table on Saudi Arabia - Year-over-year growth 2024-2029 (%)
      • 12.16 Iran - Market size and forecast 2024-2029
        • Chart on Iran - Market size and forecast 2024-2029 ($ million)
        • Data Table on Iran - Market size and forecast 2024-2029 ($ million)
        • Chart on Iran - Year-over-year growth 2024-2029 (%)
        • Data Table on Iran - Year-over-year growth 2024-2029 (%)
      • 12.17 Brazil - Market size and forecast 2024-2029
        • Chart on Brazil - Market size and forecast 2024-2029 ($ million)
        • Data Table on Brazil - Market size and forecast 2024-2029 ($ million)
        • Chart on Brazil - Year-over-year growth 2024-2029 (%)
        • Data Table on Brazil - Year-over-year growth 2024-2029 (%)
      • 12.18 Market opportunity by geography
        • Market opportunity by geography ($ million)
        • Data Tables on Market opportunity by geography ($ million)

      13 Drivers, Challenges, and Opportunity/Restraints

      • 13.1 Market drivers
        • 13.2 Market challenges
          • 13.3 Impact of drivers and challenges
            • Impact of drivers and challenges in 2024 and 2029
          • 13.4 Market opportunities/restraints

            14 Competitive Landscape

            • 14.1 Overview
              • 14.2 Competitive Landscape
                • Overview on criticality of inputs and factors of differentiation
              • 14.3 Landscape disruption
                • Overview on factors of disruption
              • 14.4 Industry risks
                • Impact of key risks on business

              15 Competitive Analysis

              • 15.1 Companies profiled
                • Companies covered
              • 15.2 Company ranking index
                • Company ranking index
              • 15.3 Market positioning of companies
                • Matrix on companies position and classification
              • 15.4 BASF SE
                • BASF SE - Overview
                • BASF SE - Business segments
                • BASF SE - Key news
                • BASF SE - Key offerings
                • BASF SE - Segment focus
                • SWOT
              • 15.5 China Petrochemical Corp.
                • China Petrochemical Corp. - Overview
                • China Petrochemical Corp. - Business segments
                • China Petrochemical Corp. - Key offerings
                • China Petrochemical Corp. - Segment focus
                • SWOT
              • 15.6 Exxon Mobil Corp.
                • Exxon Mobil Corp. - Overview
                • Exxon Mobil Corp. - Business segments
                • Exxon Mobil Corp. - Key news
                • Exxon Mobil Corp. - Key offerings
                • Exxon Mobil Corp. - Segment focus
                • SWOT
              • 15.7 India Glycols Ltd.
                • India Glycols Ltd. - Overview
                • India Glycols Ltd. - Business segments
                • India Glycols Ltd. - Key offerings
                • India Glycols Ltd. - Segment focus
                • SWOT
              • 15.8 INEOS Group Holdings S.A.
                • INEOS Group Holdings S.A. - Overview
                • INEOS Group Holdings S.A. - Product / Service
                • INEOS Group Holdings S.A. - Key news
                • INEOS Group Holdings S.A. - Key offerings
                • SWOT
              • 15.9 Lotte Chemical Corp.
                • Lotte Chemical Corp. - Overview
                • Lotte Chemical Corp. - Business segments
                • Lotte Chemical Corp. - Key news
                • Lotte Chemical Corp. - Key offerings
                • Lotte Chemical Corp. - Segment focus
                • SWOT
              • 15.10 LyondellBasell Industries NV
                • LyondellBasell Industries NV - Overview
                • LyondellBasell Industries NV - Business segments
                • LyondellBasell Industries NV - Key news
                • LyondellBasell Industries NV - Key offerings
                • LyondellBasell Industries NV - Segment focus
                • SWOT
              • 15.11 Mitsubishi Chemical Group Corp.
                • Mitsubishi Chemical Group Corp. - Overview
                • Mitsubishi Chemical Group Corp. - Business segments
                • Mitsubishi Chemical Group Corp. - Key news
                • Mitsubishi Chemical Group Corp. - Key offerings
                • Mitsubishi Chemical Group Corp. - Segment focus
                • SWOT
              • 15.12 Nan Ya Plastic Corp.
                • Nan Ya Plastic Corp. - Overview
                • Nan Ya Plastic Corp. - Business segments
                • Nan Ya Plastic Corp. - Key offerings
                • Nan Ya Plastic Corp. - Segment focus
                • SWOT
              • 15.13 NIPPON SHOKUBAI CO. LTD.
                • NIPPON SHOKUBAI CO. LTD. - Overview
                • NIPPON SHOKUBAI CO. LTD. - Business segments
                • NIPPON SHOKUBAI CO. LTD. - Key offerings
                • NIPPON SHOKUBAI CO. LTD. - Segment focus
                • SWOT
              • 15.14 PTT Global Chemical Public Co. Ltd.
                • PTT Global Chemical Public Co. Ltd. - Overview
                • PTT Global Chemical Public Co. Ltd. - Business segments
                • PTT Global Chemical Public Co. Ltd. - Key offerings
                • PTT Global Chemical Public Co. Ltd. - Segment focus
                • SWOT
              • 15.15 Reliance Industries Ltd.
                • Reliance Industries Ltd. - Overview
                • Reliance Industries Ltd. - Business segments
                • Reliance Industries Ltd. - Key news
                • Reliance Industries Ltd. - Key offerings
                • Reliance Industries Ltd. - Segment focus
                • SWOT
              • 15.16 Saudi Basic Industries Corp.
                • Saudi Basic Industries Corp. - Overview
                • Saudi Basic Industries Corp. - Business segments
                • Saudi Basic Industries Corp. - Key offerings
                • Saudi Basic Industries Corp. - Segment focus
                • SWOT
              • 15.17 Shell plc
                • Shell plc - Overview
                • Shell plc - Business segments
                • Shell plc - Key news
                • Shell plc - Key offerings
                • Shell plc - Segment focus
                • SWOT
              • 15.18 The Dow Chemical Co.
                • The Dow Chemical Co. - Overview
                • The Dow Chemical Co. - Business segments
                • The Dow Chemical Co. - Key news
                • The Dow Chemical Co. - Key offerings
                • The Dow Chemical Co. - Segment focus
                • SWOT

              16 Appendix

              • 16.1 Scope of the report
                • 16.2 Inclusions and exclusions checklist
                  • Inclusions checklist
                  • Exclusions checklist
                • 16.3 Currency conversion rates for US$
                  • Currency conversion rates for US$
                • 16.4 Research methodology
                  • Research methodology
                • 16.5 Data procurement
                  • Information sources
                • 16.6 Data validation
                  • Data validation
                • 16.7 Validation techniques employed for market sizing
                  • Validation techniques employed for market sizing
                • 16.8 Data synthesis
                  • Data synthesis
                • 16.9 360 degree market analysis
                  • 360 degree market analysis
                • 16.10 List of abbreviations
                  • List of abbreviations

                Research Methodology

                Technavio presents a detailed picture of the market by way of study, synthesis, and summation of data from multiple sources. The analysts have presented the various facets of the market with a particular focus on identifying the key industry influencers. The data thus presented is comprehensive, reliable, and the result of extensive research, both primary and secondary.

                INFORMATION SOURCES

                Primary sources

                • Manufacturers and suppliers
                • Channel partners
                • Industry experts
                • Strategic decision makers

                Secondary sources

                • Industry journals and periodicals
                • Government data
                • Financial reports of key industry players
                • Historical data
                • Press releases

                DATA ANALYSIS

                Data Synthesis

                • Collation of data
                • Estimation of key figures
                • Analysis of derived insights

                Data Validation

                • Triangulation with data models
                • Reference against proprietary databases
                • Corroboration with industry experts

                REPORT WRITING

                Qualitative

                • Market drivers
                • Market challenges
                • Market trends
                • Five forces analysis

                Quantitative

                • Market size and forecast
                • Market segmentation
                • Geographical insights
                • Competitive landscape

                Interested in this report?

                Get your sample now to see our research methodology and insights!

                Download Now

                Frequently Asked Questions

                Ethylene Glycol market growth will increase by $ 18421.6 mn during 2025-2029.

                The Ethylene Glycol market is expected to grow at a CAGR of 8.9% during 2025-2029.

                Ethylene Glycol market is segmented by Type( MEG, DEG, TEG, Others) Application( Polyester fiber and films, PET, Antifreeze and coolant, Others, South America) Industry Application( Textile, Packaging, Automotive, Middle East and Africa, South America)

                BASF SE, China Petrochemical Corp., Eastman Chemical Co., Equate Petrochemical Co, Exxon Mobil Corp., Huntsman Corp., India Glycols Ltd., Indorama Ventures Public Co. Ltd., INEOS Group Holdings S.A., Lotte Chemical Corp., LyondellBasell Industries NV, Mitsubishi Chemical Group Corp., Nan Ya Plastic Corp., NIPPON SHOKUBAI CO. LTD., PETRONAS Chemicals Group Berhad, PTT Global Chemical Public Co. Ltd., Reliance Industries Ltd., Saudi Basic Industries Corp., Shell plc, The Dow Chemical Co. are a few of the key vendors in the Ethylene Glycol market.

                APAC will register the highest growth rate of 65% among the other regions. Therefore, the Ethylene Glycol market in APAC is expected to garner significant business opportunities for the vendors during the forecast period.

                China, India, US, South Korea, Japan, Germany, Russia, Saudi Arabia, Iran, Brazil

                • Rising demand for polyester fibersOne of the primary drivers of the global ethylene glycol market is the increasing demand for polyester fibers is the driving factor this market.
                • which are extensively used in the textile and apparel industries. Monoethylene Glycol (MEG) is the driving factor this market.
                • a key derivative of ethylene glycol is the driving factor this market.
                • serves as a fundamental raw material in the production of polyethylene terephthalate (PET) is the driving factor this market.
                • the base polymer for polyester fibers. As global consumer preferences shift toward lightweight is the driving factor this market.
                • durable is the driving factor this market.
                • and easy-care fabrics is the driving factor this market.
                • polyester has emerged as the fiber of choice across both developed and emerging economies. The demand for polyester fibers is particularly strong in countries with large-scale textile manufacturing capabilities is the driving factor this market.
                • including China is the driving factor this market.
                • India is the driving factor this market.
                • Vietnam is the driving factor this market.
                • and Bangladesh. These nations are experiencing rapid industrialization is the driving factor this market.
                • urbanization is the driving factor this market.
                • and population growth is the driving factor this market.
                • all of which are contributing to increased consumption of clothing is the driving factor this market.
                • home furnishings is the driving factor this market.
                • and industrial fabrics. The global expansion of fast fashion characterized by short production cycles and cost-efficient mass manufacturing has further accelerated the use of synthetic fibers such as polyester. The cost-effectiveness is the driving factor this market.
                • versatility is the driving factor this market.
                • and performance advantages of polyester over natural fibers have made it suitable for a wide range of applications. These include sportswear is the driving factor this market.
                • casual apparel is the driving factor this market.
                • upholstery is the driving factor this market.
                • and technical textiles used in automotive is the driving factor this market.
                • medical is the driving factor this market.
                • and construction sectors. The resistance of fiber to wrinkles is the driving factor this market.
                • moisture is the driving factor this market.
                • and wear enhances its appeal in both consumer and industrial markets. As the global textile and apparel industry continues to evolve is the driving factor this market.
                • the demand for polyester fibers is expected to remain a key factor influencing MEG consumption. This trend reinforces the strategic importance of ethylene glycol in supporting the growth of synthetic fiber production and sustaining the supply chain for polyester-based products. is the driving factor this market.

                The Ethylene Glycol market vendors should focus on grabbing business opportunities from the MEG segment as it accounted for the largest market share in the base year.