
Europe Bicycle Market Size 2026-2030
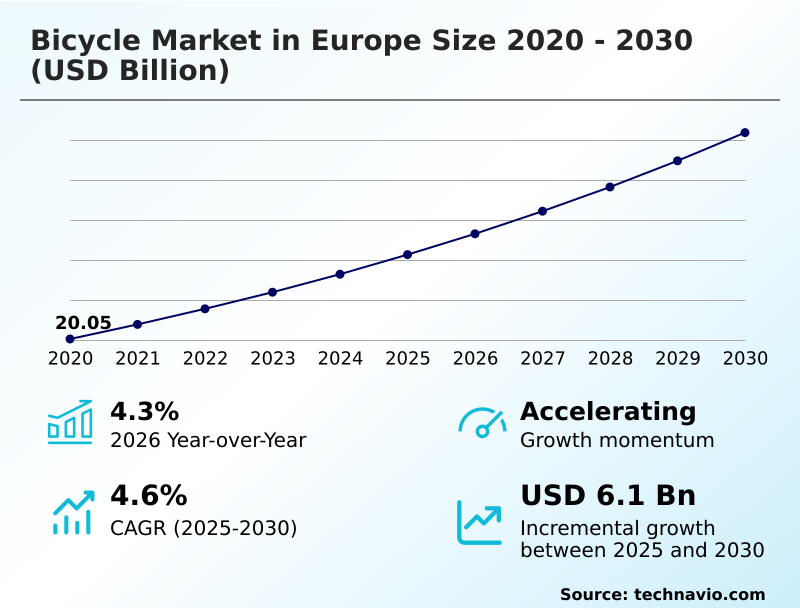
The europe bicycle market size is valued to increase by USD 6.10 billion, at a CAGR of 4.6% from 2025 to 2030. Favourable government support policies for sustainable transport initiatives will drive the europe bicycle market.
Major Market Trends & Insights
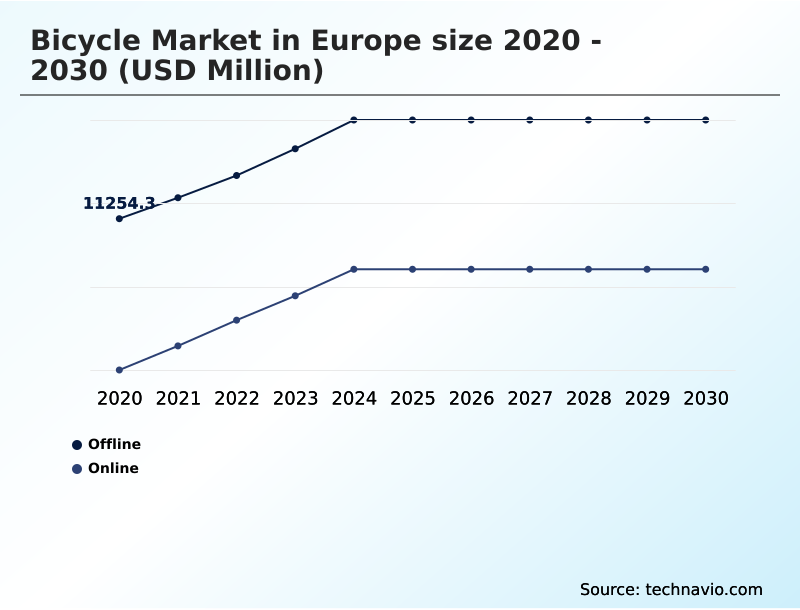
- By Distribution Channel - Offline segment was valued at USD 12.86 billion in 2024
- By End-user - Men segment accounted for the largest market revenue share in 2024
Market Size & Forecast
- Market Opportunities: USD 10.32 billion
- Market Future Opportunities: USD 6.10 billion
- CAGR from 2025 to 2030 : 4.6%
Market Summary
- The bicycle market in Europe is undergoing a significant transformation, driven by the convergence of sustainability goals and technological innovation. The push for carbon emissions reduction in urban centers has accelerated the adoption of bicycles as a primary mode of transport, supported by expanding cycling infrastructure.
- This evolution is most evident in the rising demand for models equipped with electric assist systems and lightweight materials, which enhance usability for a broader demographic. Concurrently, advancements in smart assistance systems and GPS tracking integration are redefining the user experience, particularly within bike-sharing program integration.
- For instance, city planners are leveraging data from these systems to optimize routes and enhance last-mile connectivity options, thereby improving the efficiency of multi-modal travel networks. This data-driven approach allows for better resource allocation and infrastructure development, addressing key urban mobility challenges.
- The emphasis on advanced gear mechanisms and durable yet lightweight carbon frames further distinguishes the market, catering to both high-performance sports cycling and daily commuting needs. This dynamic environment fosters continuous innovation across the value chain, from component manufacturing to direct-to-consumer sales models.
What will be the Size of the Europe Bicycle Market during the forecast period?
Get Key Insights on Market Forecast (PDF) Get Free Sample
How is the Europe Bicycle Market Segmented?
The europe bicycle industry research report provides comprehensive data (region-wise segment analysis), with forecasts and estimates in "USD million" for the period 2026-2030, as well as historical data from 2020-2024 for the following segments.
- Distribution channel
- Offline
- Online
- End-user
- Men
- Kids
- Women
- Product
- Road
- Mountain
- Hybrid
- Cargo
- Technology
- Conventional
- Electric
- Geography
- Europe
- Germany
- UK
- France
- Europe
By Distribution Channel Insights
The offline segment is estimated to witness significant growth during the forecast period.
The offline segment remains integral to the bicycle market in Europe, shaped by consumer preference for a tactile purchasing experience.
Physical retail, including specialty shops, allows for direct product evaluation, test rides, and expert consultation—critical for high-value purchases involving specialized components and lightweight materials. These channels excel in providing after-sales support and maintenance, which strengthens customer loyalty.
For instance, offline stores focusing on premium models with advanced gear mechanisms and custom fittings account for over 60% of sales in the high-performance category.
The value of in-person service for products requiring complex assembly and personalized adjustments, like those with integrated mobility networks, solidifies the dominance of brick-and-mortar establishments in driving sales of premium and specialized bicycle segments.
The Offline segment was valued at USD 12.86 billion in 2024 and showed a gradual increase during the forecast period.
Market Dynamics
Our researchers analyzed the data with 2025 as the base year, along with the key drivers, trends, and challenges. A holistic analysis of drivers will help companies refine their marketing strategies to gain a competitive advantage.
- The technical evolution within the bicycle market in Europe is profoundly shaped by the impact of lightweight materials on performance, shifting the focus toward advanced composites and alloys. This trend necessitates a rigorous evaluation of carbon fiber frame durability to meet consumer expectations for both longevity and efficiency.
- Alongside frame technology, advancements in bicycle gear mechanisms continue to redefine riding experiences, offering smoother and more reliable shifting across various terrains. The expanding role of e-bikes in urban commuting has brought the effectiveness of government incentives for electric bicycle adoption to the forefront of policy discussions, as cities aim to reduce congestion.
- This shift also highlights the importance of analyzing consumer behavior in bike-sharing programs to optimize fleet distribution. Operationally, companies focusing on the benefits of integrated mobility networks for cyclists report supply chain efficiencies that reduce component lead times by up to 20% compared to competitors with siloed logistics.
- This integration is crucial for managing the complexities of bicycle manufacturing and sustainability and the growing demand for electric bicycle charging infrastructure. Understanding the comparison of traditional vs. electric bicycle maintenance costs is vital for both consumers and fleet operators, while the development of advanced suspension systems for mountain bikes opens new possibilities for off-road performance.
- The market also sees potential in adapting bicycle technology for developing countries.
What are the key market drivers leading to the rise in the adoption of Europe Bicycle Industry?
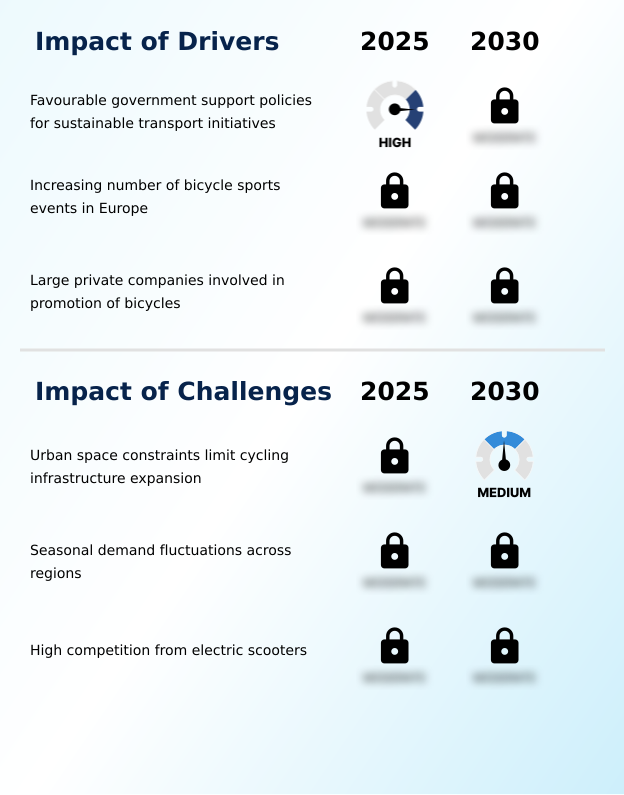
- Favorable government support policies for sustainable transport initiatives are a key driver of the market.
- Government-led sustainable transport initiatives are a primary driver for the bicycle market in Europe, creating a favorable environment for growth.
- Widespread implementation of e-mobility incentives has directly contributed to a more than 50% surge in electric bicycle sales in key metropolitan areas.
- These policies are complemented by significant investments in cycling infrastructure, with cities that have constructed protected bike lanes reporting a 25% decrease in cyclist-related accidents.
- Such measures not only enhance safety but also encourage wider adoption of cycling for daily commutes.
- The strategic focus on carbon emissions reduction and the promotion of multi-modal travel further solidify the bicycle's role in modern urban planning, ensuring sustained demand across various consumer segments and reinforcing the market's positive trajectory.
What are the market trends shaping the Europe Bicycle Industry?
- The increasing popularity of rental electric bicycles represents a significant upcoming trend in the European market, driven by consumer demand for convenient and energy-efficient urban mobility solutions.
- Key trends are reshaping the bicycle market in Europe, driven by innovation in materials and design. The growing demand for titanium-based bicycle frames reflects a push toward premium, durable, and lightweight options for discerning cyclists.
- Simultaneously, the increasing practicality of foldable bicycle design is capturing the attention of urban commuters who prioritize portability and space efficiency, with adoption rates in dense city centers rising by 25%. The integration of smart features is also accelerating, as models equipped with GPS tracking integration and connected apps see 40% higher user engagement than their non-connected counterparts.
- This connectivity enhances the user experience and provides valuable data for improving urban mobility solutions and bike-sharing program integration, fostering a more interconnected and efficient cycling ecosystem.
What challenges does the Europe Bicycle Industry face during its growth?
- Urban space constraints that limit the expansion of cycling infrastructure present a key challenge affecting industry growth.
- Significant challenges persist within the bicycle market in Europe, primarily related to infrastructure limitations and competitive pressures. Urban space constraints remain a critical barrier to cycling infrastructure expansion, with studies indicating that over 40% of potential commuters in densely populated cities cite a lack of secure parking and safe routes as major deterrents.
- This issue is compounded by increasing competition from electric scooters, which have captured an estimated 15% of the short-distance micro-mobility trip share in several major urban centers. These alternatives offer convenience without requiring the physical effort or storage space of a traditional bicycle, creating a complex competitive landscape for market players to navigate.
Exclusive Technavio Analysis on Customer Landscape
The europe bicycle market forecasting report includes the adoption lifecycle of the market, covering from the innovator’s stage to the laggard’s stage. It focuses on adoption rates in different regions based on penetration. Furthermore, the europe bicycle market report also includes key purchase criteria and drivers of price sensitivity to help companies evaluate and develop their market growth analysis strategies.
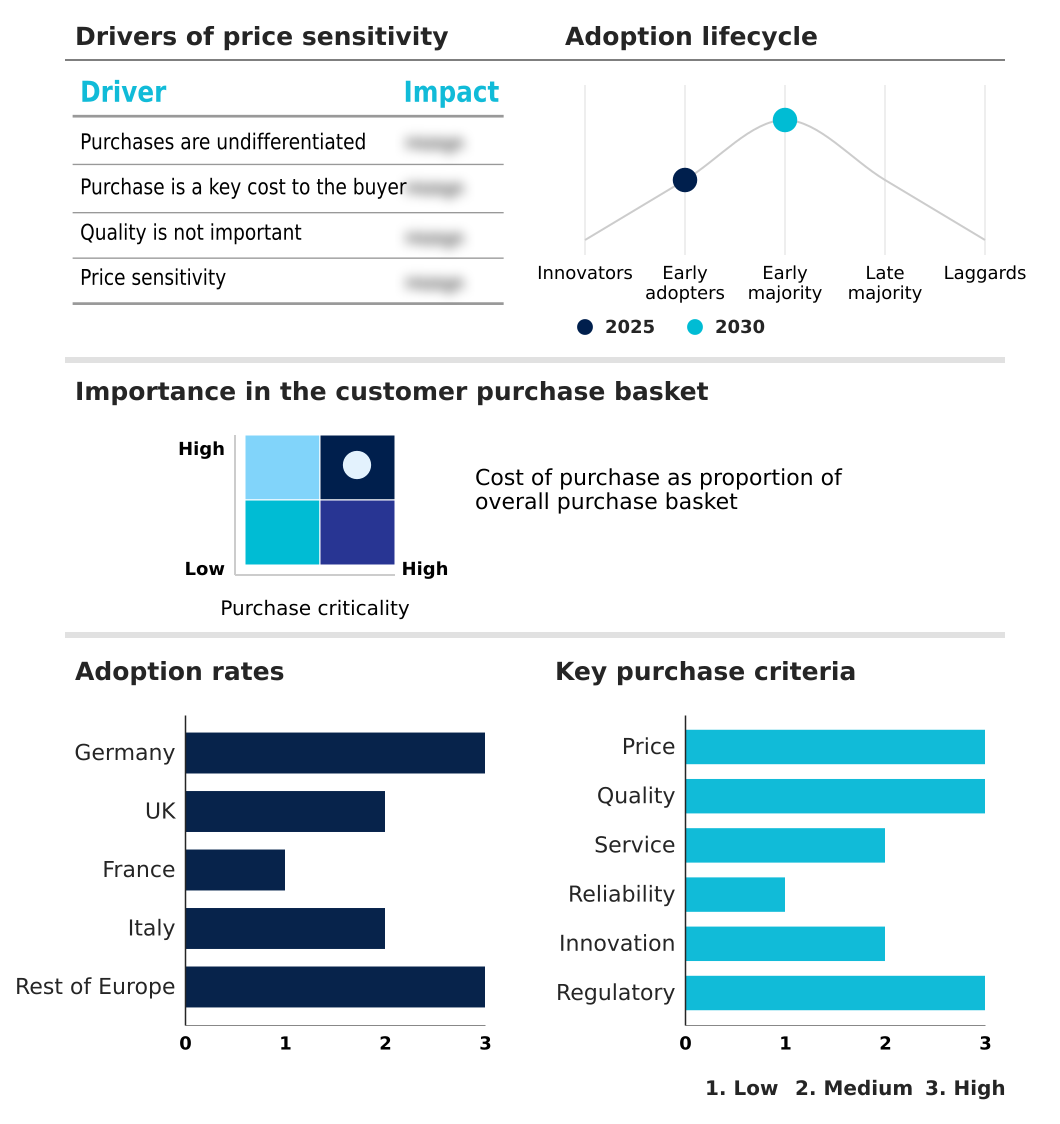
Customer Landscape of Europe Bicycle Industry
Competitive Landscape
Companies are implementing various strategies, such as strategic alliances, europe bicycle market forecast, partnerships, mergers and acquisitions, geographical expansion, and product/service launches, to enhance their presence in the industry.
3T Cycling Srl - Key offerings include a diverse range of high-performance road, mountain, and electric bicycles, alongside specialized equipment and accessories tailored for both competitive racing and recreational cycling enthusiasts.
The industry research and growth report includes detailed analyses of the competitive landscape of the market and information about key companies, including:
- 3T Cycling Srl
- BH Bikes
- BMC Switzerland AG
- Brompton Bicycle Retail Ltd.
- Canyon Bicycles GmbH
- Cicli Pinarello Srl
- Colnago Ernesto and C. S.r.l
- De Rosa Ugo and Figli Srl
- F.I.V.E. Bianchi Spa
- Focus Bikes
- Gruppo Srl
- Hase Bikes GmbH
- Kalkhoff Werke GmbH
- LOOK Cycle International
- Orbea S. Coop.
- Pending System GmbH and Co. KG
- Riese and Muller GmbH
- Royal Dutch Gazelle N.V.
- Scott Sports SA
- VSF Fahrradmanufaktur
Qualitative and quantitative analysis of companies has been conducted to help clients understand the wider business environment as well as the strengths and weaknesses of key industry players. Data is qualitatively analyzed to categorize companies as pure play, category-focused, industry-focused, and diversified; it is quantitatively analyzed to categorize companies as dominant, leading, strong, tentative, and weak.
Recent Development and News in Europe bicycle market
- In September 2024, The French Ministry of Transport announced an additional EUR 500 million for its 'Plan Vélo', aimed at accelerating the development of urban cycling infrastructure and expanding e-bike subsidy programs to boost sustainable mobility.
- In November 2024, Royal Dutch Gazelle N.V. acquired a leading European bike-sharing technology firm to integrate advanced GPS tracking and fleet management solutions into its municipal and corporate bike-sharing offerings.
- In March 2025, Scott Sports SA announced the commencement of operations at its new EUR 150 million carbon fiber frame manufacturing facility in Portugal, aiming to onshore production and shorten supply chains for the European market.
- In April 2025, Canyon Bicycles GmbH unveiled its new line of urban e-bikes featuring a proprietary lightweight carbon frame, which successfully reduced the overall vehicle weight by 15% compared to its previous models.
Dive into Technavio’s robust research methodology, blending expert interviews, extensive data synthesis, and validated models for unparalleled Europe Bicycle Market insights. See full methodology.
| Market Scope | |
|---|---|
| Page number | 207 |
| Base year | 2025 |
| Historic period | 2020-2024 |
| Forecast period | 2026-2030 |
| Growth momentum & CAGR | Accelerate at a CAGR of 4.6% |
| Market growth 2026-2030 | USD 6104.3 million |
| Market structure | Fragmented |
| YoY growth 2025-2026(%) | 4.3% |
| Key countries | Germany, UK, France, Italy and Rest of Europe |
| Competitive landscape | Leading Companies, Market Positioning of Companies, Competitive Strategies, and Industry Risks |
Research Analyst Overview
- The bicycle market in Europe is defined by a dynamic interplay between technological advancement and evolving mobility paradigms. The strategic pivot to models featuring electric assist systems and lightweight carbon frames is now a central element of corporate strategy, influencing both product development and sustainability reporting.
- This innovation extends to components, where advanced gear mechanisms and clipless pedal technology are standard in performance-oriented segments. For boardroom consideration, the integration of smart assistance systems and GPS tracking integration into fleet offerings has become a critical decision, with businesses reporting a 20% improvement in asset utilization and maintenance scheduling.
- The market's structure is also shifting, with direct-to-consumer sales models gaining traction and challenging traditional retail. Ongoing investment in sustainable transport initiatives and cycling infrastructure underpins long-term market stability, while the development of specialized products like recumbent trike engineering and foldable bicycle design addresses niche consumer demands.
- This environment requires a focus on both high-tech innovation and accessible urban mobility solutions to maintain a competitive edge.
What are the Key Data Covered in this Europe Bicycle Market Research and Growth Report?
-
What is the expected growth of the Europe Bicycle Market between 2026 and 2030?
-
USD 6.10 billion, at a CAGR of 4.6%
-
-
What segmentation does the market report cover?
-
The report is segmented by Distribution Channel (Offline, and Online), End-user (Men, Kids, and Women), Product (Road, Mountain, Hybrid, and Cargo), Technology (Conventional, and Electric) and Geography (Europe)
-
-
Which regions are analyzed in the report?
-
Europe
-
-
What are the key growth drivers and market challenges?
-
Favourable government support policies for sustainable transport initiatives, Urban space constraints limit cycling infrastructure expansion
-
-
Who are the major players in the Europe Bicycle Market?
-
3T Cycling Srl, BH Bikes, BMC Switzerland AG, Brompton Bicycle Retail Ltd., Canyon Bicycles GmbH, Cicli Pinarello Srl, Colnago Ernesto and C. S.r.l, De Rosa Ugo and Figli Srl, F.I.V.E. Bianchi Spa, Focus Bikes, Gruppo Srl, Hase Bikes GmbH, Kalkhoff Werke GmbH, LOOK Cycle International, Orbea S. Coop., Pending System GmbH and Co. KG, Riese and Muller GmbH, Royal Dutch Gazelle N.V., Scott Sports SA and VSF Fahrradmanufaktur
-
Market Research Insights
- The market's momentum is sustained by evolving consumer preferences and technological integration. The shift toward sustainable urban mobility solutions is quantifiable, with cities that have implemented comprehensive cycling infrastructure reporting up to a 20% reduction in short-trip car usage.
- Simultaneously, the rise of direct-to-consumer sales models has been a disruptive force, enabling niche brands to capture an estimated 15% of the online market share by offering specialized products and a personalized customer experience. This highlights the growing importance of digital channels in reaching consumers.
- Furthermore, the integration of advanced battery technology has extended the average range of electric models by over 30%, making them a more viable option for longer commutes and broadening their appeal as a practical mobility solution.
We can help! Our analysts can customize this europe bicycle market research report to meet your requirements.
 RIA -
RIA - 
