Europe Non-Residential Air Handling Units Market Size 2024-2028
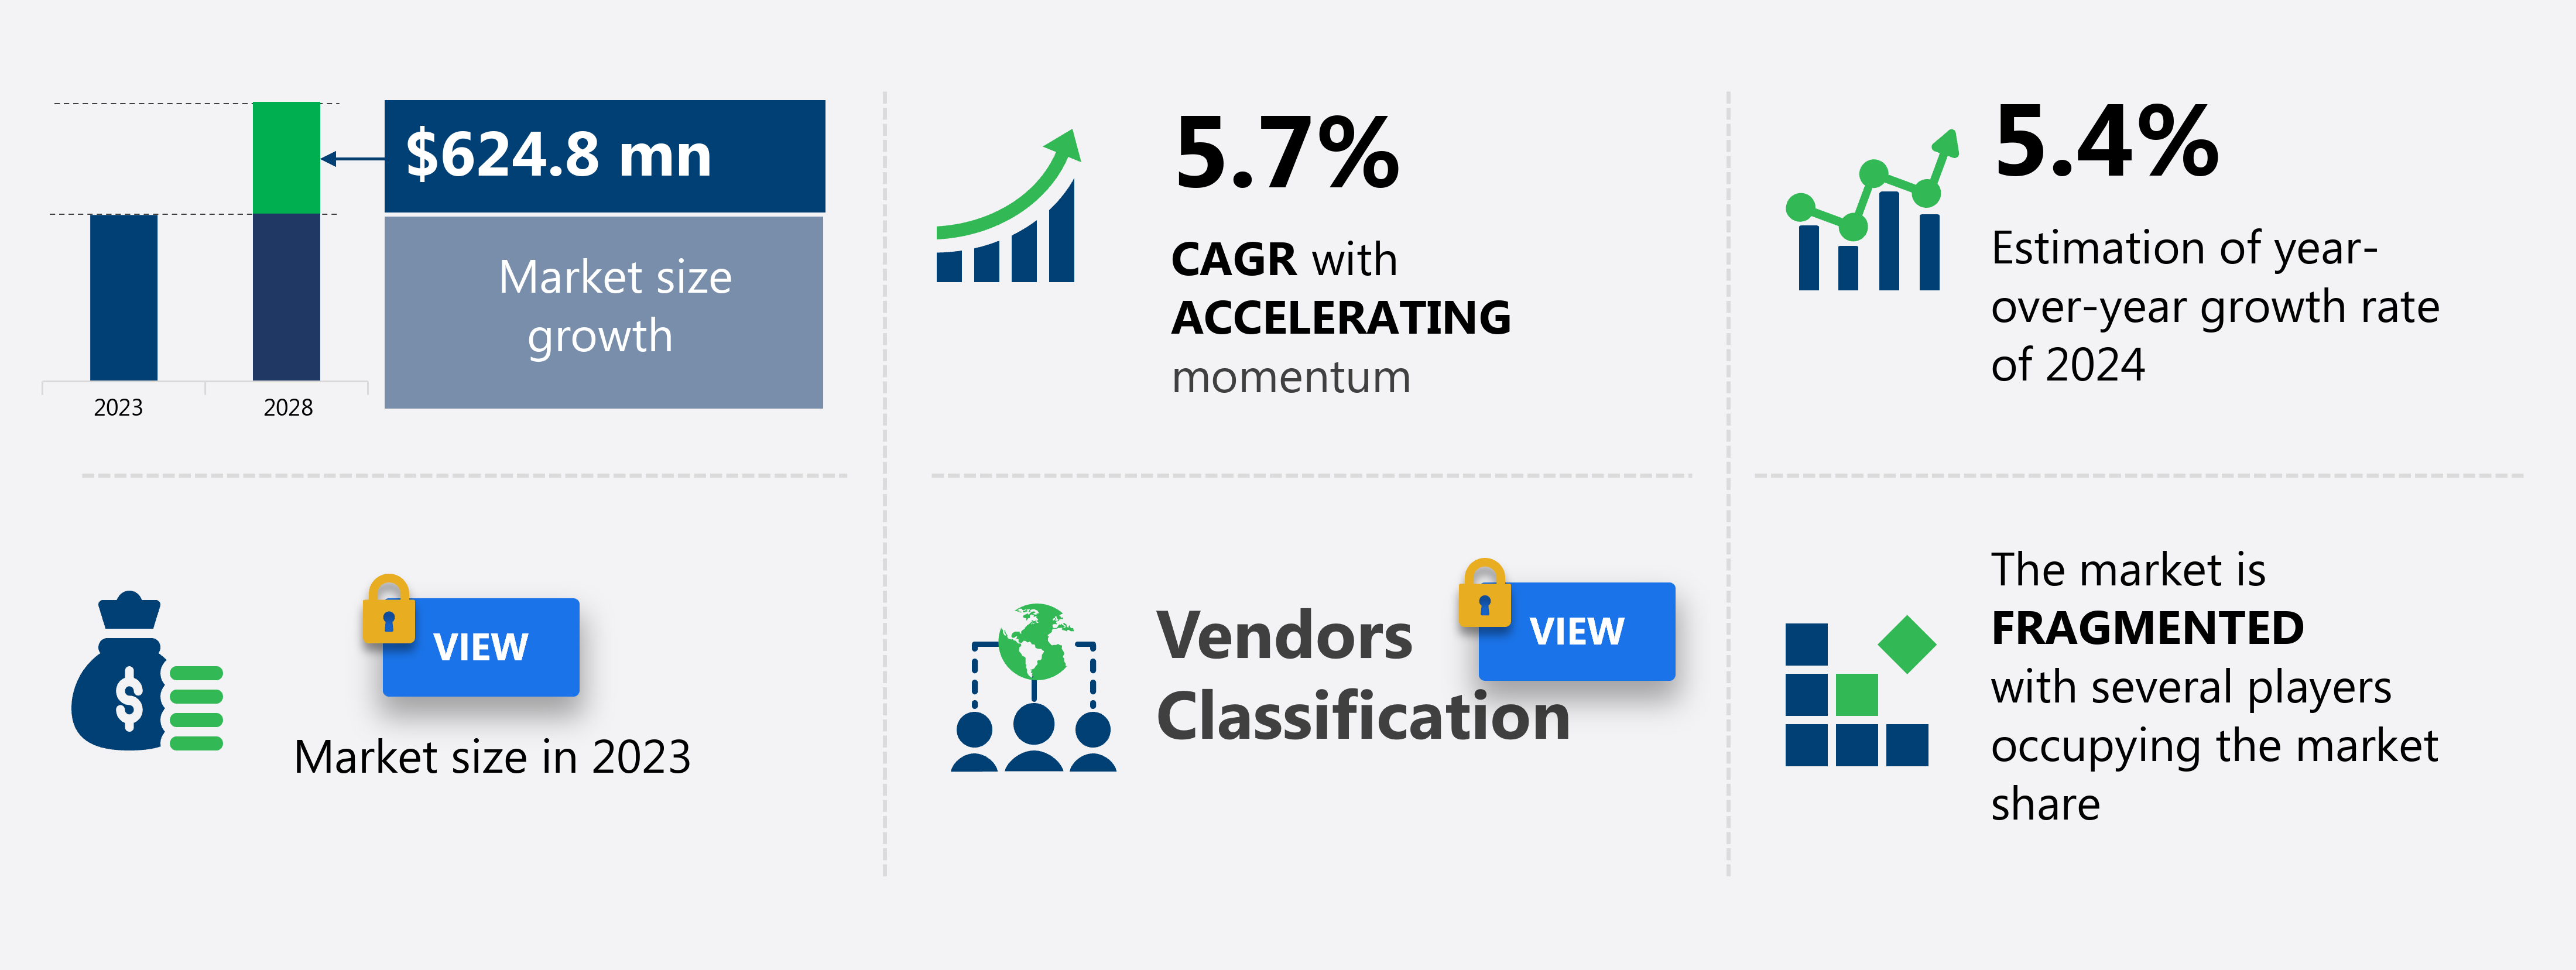
The Europe non-residential air handling units market size is forecast to increase by USD 624.8 million at a CAGR of 5.7% between 2023 and 2028. The European Non-Residential Air Handling Units (AHUs) market is experiencing significant growth, driven by increasing demand for energy efficiency and indoor air quality solutions in commercial and public buildings. companies in this market are focusing on inorganic growth strategies such as mergers and acquisitions to expand their footprint and enhance their product offerings.
Major Market Trends & Insights
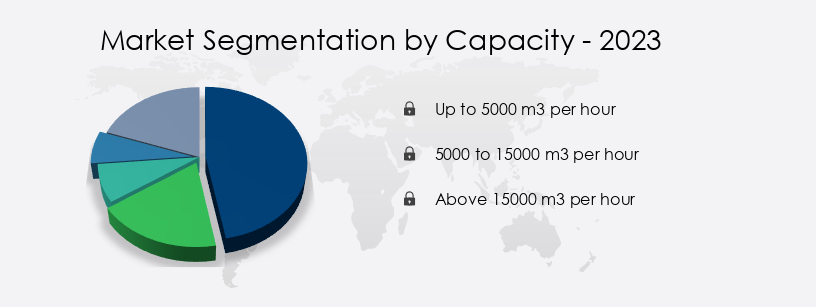
- Based on the Capacity, the up to 5000 m3 per hour segment led the market and was valued at USD 799.90 million of the global revenue in 2022.
- Based on the End-user, the commercial segment accounted for the largest market revenue share in 2022.
Market Size & Forecast
- 2024 Market Size: USD 2.07 Billion
- Future Opportunities: USD 624.8 Million
- CAGR (2023-2028): 5.7%
The European non-residential air handling units market is experiencing significant growth driven by various factors. Humidity control and energy savings optimization are key priorities for businesses, leading to increased adoption of predictive analytics and building performance modeling. Energy recovery systems, ventilation efficiency, and fluid dynamics are essential components in designing energy-efficient buildings. Green building design, noise control technologies, and industrial ventilation are also gaining traction. Advanced technologies such as building information modeling, off-site construction, and smart building technology are revolutionizing the industry. Sustainability certifications, data center cooling, and air purification are becoming increasingly important in ensuring thermal comfort and air quality.
What will be the size of the Europe Non-Residential Air Handling Units Market during the forecast period?
- Hepa filters, prefabricated modules, and building automation integration are crucial for enhancing energy efficiency and reducing operational costs. Fire suppression systems, acoustic insulation, fan motor efficiency, and adaptive control systems are essential for ensuring safety and maintaining optimal building performance. Airflow modeling, temperature control, and smoke detection are critical for maintaining a healthy and productive indoor environment. High-efficiency filters and energy efficiency standards are driving innovation in air conditioning systems and air quality monitoring technologies. The market is also witnessing the integration of ultraviolet germicidal irradiation and virtual commissioning in air handling units to improve indoor air quality and reduce maintenance costs. The 5000 to 15000 m3 per hour segment is the second largest segment of the capacity and was valued at USD 622.10 million in 2022.
- Cleanroom technology and energy modeling are essential for industries requiring stringent air quality standards. Overall, the European non-residential air handling units market is evolving to meet the demands of energy efficiency, safety, and sustainability.
-
Innovation is also a key trend, with companies investing in advanced technologies like IoT and automation to improve system performance and reduce energy consumption. However, the market is not without challenges. Stringent regulations, particularly those related to energy efficiency and indoor air quality, are driving up costs for manufacturers and installers.
- Additionally, the high initial investment required for AHUs can be a barrier to entry for some customers. Companies seeking to capitalize on market opportunities and navigate these challenges effectively should focus on offering energy-efficient, easy-to-install solutions that meet regulatory requirements and provide superior indoor air quality. By staying abreast of regulatory developments and investing in research and development, companies can differentiate themselves and maintain a competitive edge in the European Non-Residential AHUs market.
How is this market segmented?
The market research report provides comprehensive data (region-wise segment analysis), with forecasts and estimates in "USD million" for the period 2024-2028, as well as historical data from 2018-2022 for the following segments.
- Capacity
- Up to 5000 m3 per hour
- 5000 to 15000 m3 per hour
- Above 15000 m3 per hour
- End-user
- Commercial
- Industrial
- Healthcare
- Education
- Hospitality
- Type
- Packaged AHUs
- Modular AHUs
- Custom AHUs
- Geography
- Europe
- France
- Germany
- Italy
- UK
- Europe
By Capacity Insights
The up to 5000 m3 per hour segment is estimated to witness significant growth during the forecast period. The segment was valued at USD 799.90 million in 2022. It continued to the largest segment at a CAGR of 4.50%.
Air handling units, with a capacity of up to 5,000 m3 per hour, are essential for environments that require efficient ventilation and air conditioning without the need for high capacities typically found in industrial applications. These units prioritize space utilization and noise reduction, making them ideal for applications in various sectors, such as office buildings and smart buildings. For instance, at Dream Island amusement park in Moscow, Russia, VTS Group supplied over 250 air handling units and 50 heating units in October 2021. These units collectively handle an air volume of over 4,000,000 m3 per hour, showcasing the significant capacity and efficiency required to maintain a comfortable environment in large, heavily trafficked venues.
Energy management systems, including variable speed drives, fan systems, and heat exchangers, play a crucial role in optimizing energy efficiency in these air handling units. Additionally, advanced controls, such as machine learning and data analytics, enable performance optimization and remote monitoring, enhancing overall system efficiency. Furthermore, the integration of Internet of Things (IoT) technology and data centers allows for real-time data collection and analysis, enabling predictive maintenance and proactive system adjustments. Safety systems, including fire safety and indoor air quality, ensure the safety and well-being of occupants. Modular design and customized systems cater to unique project requirements, while noise reduction technologies minimize disruption.
Green building standards, such as Energy Star and LEED, promote energy efficiency and sustainability, aligning with the growing trend towards high-performance buildings. In the realm of renewable energy, solar energy and heat recovery systems provide additional energy sources, while cooling towers and heat pumps maintain optimal temperature levels. Building automation and management systems, including cloud computing and demand-controlled ventilation, ensure seamless operation and compliance with codes and standards.
Get a glance at the market report of share of various segments Request Free Sample
The Up to 5000 m3 per hour segment was valued at USD 735.20 million in 2018 and showed a gradual increase during the forecast period.
Market Dynamics
The Europe Non-Residential Air Handling Units Market is experiencing dynamic growth, largely driven by a strong focus on sustainability and efficiency. Key Europe non-residential AHU market trends include the increasing adoption of energy-efficient AHUs Europe and modular air handling units Europe, which offer flexibility and improved performance. A critical aspect is maintaining superior indoor air quality AHUs Europe across various applications. The demand for AHU for commercial buildings Europe, particularly in office building HVAC Europe, remains significant. The integration of heat recovery units Europe is vital for energy savings, alongside the rise of smart AHUs Europe leveraging IoT in air handling units Europe for enhanced control and monitoring. The market also sees strong demand for custom air handling units Europe to meet specific project needs. Specialized applications, such as hospital AHUs Europe and AHU for data centers Europe, highlight unique requirements. Adherence to regulatory compliance AHUs Europe is paramount. Furthermore, industrial air handling units Europe and the shift towards predictive maintenance for AHUs Europe are shaping the industry. The pursuit of high-efficiency heat recovery Europe remains a core innovation among AHU manufacturers Europe, aligning with stringent green building standards Europe AHU. Understanding the Europe non-residential AHU market size is crucial for strategic planning.
Our researchers analyzed the data with 2023 as the base year, along with the key drivers, trends, and challenges. A holistic analysis of drivers will help companies refine their marketing strategies to gain a competitive advantage.
What are the key market drivers leading to the rise in adoption of Europe Non-Residential Air Handling Units Market?
- Inorganic growth by companies is the key driver of the market.
- The European non-residential air handling units market is experiencing notable growth due to strategic acquisitions by key companies. For instance, Lindab AB's acquisition of ATIB in September 2024 expanded its sales and distribution network in Western France and enhanced its presence in the technical ventilation products sector. ATIB, a prominent distributor of ventilation and indoor climate products in France, offers a comprehensive product range, including air handling units, silencers, air diffusers, fire protection products, and filters.
- This acquisition enables Lindab AB to leverage ATIB's technical sales expertise and long-standing relationships with commercial property sector clients. The European market's growth is fueled by these strategic moves, which strengthen companies' market positions and broaden their offerings.
What are the market trends shaping the Europe Non-Residential Air Handling Units Market?
- Innovation by market companies is the upcoming trend in the market.
- The European non-residential air handling units market is witnessing innovation driven by the demand for energy efficiency, space optimization, and superior indoor air quality (IAQ). Market participants are focusing on developing advanced solutions tailored to various sectors, such as commercial, educational, and hospitality. A notable trend is the emergence of compact and decentralized ventilation solutions. Recent innovations have led to the launch of new air handling unit ranges designed for smaller spaces.
- These units offer flexible installation options, including integration into false ceilings, which minimizes noise and conserves floor space. This approach caters to the growing need for customized solutions in diverse applications.
What challenges does Europe Non-Residential Air Handling Units Market face during the growth?
- Stringent regulations associated with non-residential air handling units is a key challenge affecting the market growth.
- The European non-residential air handling units market is subject to stringent regulatory requirements, primarily from the EU Ecodesign regulations. These regulations set standards for air handling units' design, performance, and installation processes. One significant aspect influenced by these regulations is the necessity for thermal treatment of air due to varying outdoor temperatures. To ensure compliance and minimize energy consumption, energy recovery systems (ERS), also known as heat recovery systems (HRS), are crucial.
- These systems recover and reuse energy from exhaust air to pre-condition incoming fresh air, thereby reducing overall energy demand for heating and cooling. Adherence to these regulations drives the market's growth and innovation in energy-efficient solutions.
Exclusive Europe Non-Residential Air Handling Units Market Customer Landscape
The market forecasting report includes the adoption lifecycle of the market, covering from the innovator's stage to the laggard's stage. It focuses on adoption rates in different regions based on penetration. Furthermore, the report also includes key purchase criteria and drivers of price sensitivity to help companies evaluate and develop their market growth analysis strategies.
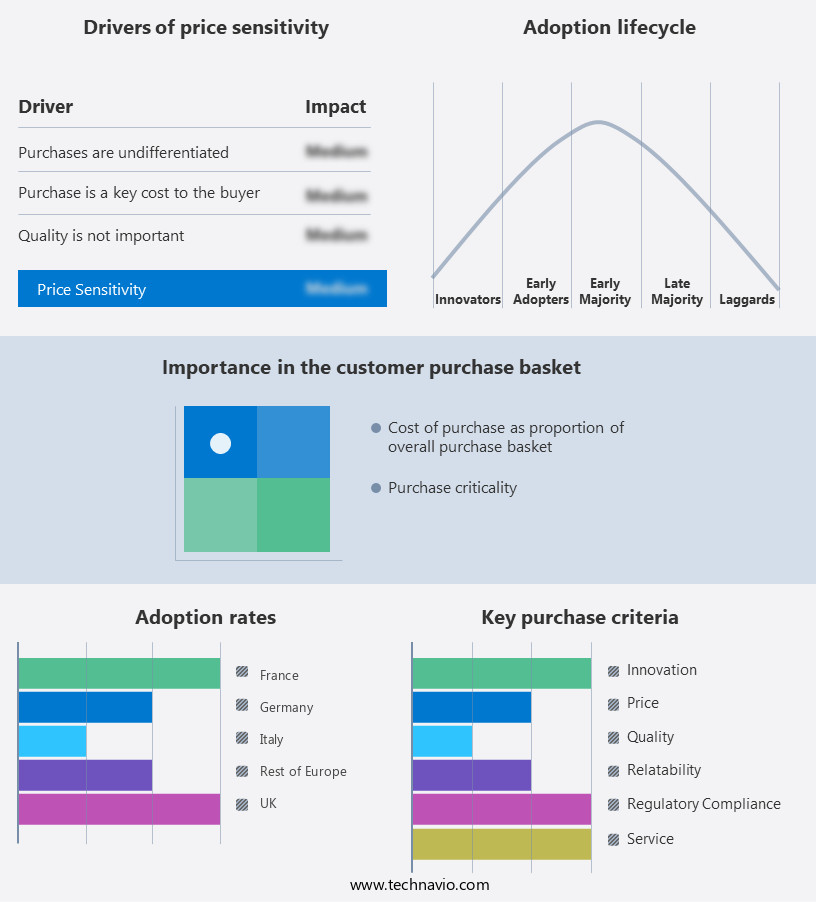
Customer Landscape
Key Companies & Market Insights
Companies are implementing various strategies, such as strategic alliances, market forecast partnerships, mergers and acquisitions, geographical expansion, and product/service launches, to enhance their presence in the market.
The market research and growth report includes detailed analyses of the competitive landscape of the market and information about key companies, including:
- Aermec S.p.A.
- Bosch Thermotechnology GmbH
- Carrier Global Corp.
- CIAT Group
- Daikin Industries Ltd.
- Euroclima AG
- FläktGroup Holding GmbH
- GEA Group Aktiengesellschaft
- Johnson Controls International Plc.
- Lennox International Inc.
- Mitsubishi Electric Europe B.V.
- NIBE Group
- Salda UAB
- Swegon Group AB
- Systemair AB
- Trane Technologies Plc.
- TROX GmbH
- Viessmann Group
- VTS Group
- Wolf GmbH
Qualitative and quantitative analysis of companies has been conducted to help clients understand the wider business environment as well as the strengths and weaknesses of key market players. Data is qualitatively analyzed to categorize companies as pure play, category-focused, industry-focused, and diversified; it is quantitatively analyzed to categorize companies as dominant, leading, strong, tentative, and weak.
Recent Developments and News
-
In January, 2025, Eurovent, a European HVAC industry association, released a new case study focusing on the energy classification of air handling units (AHUs). This study provides detailed examples of energy consumption and cost differences based on AHU energy efficiency classes, offering crucial guidance for design and product selection in European projects. (Source: Eurovent Press Release, January 14, 2025)
-
In November, 2024, Swegon Group AB announced its acquisition of HOWATHERM Klimatechnik GmbH, a German manufacturer of modular air handling units. This strategic move aims to strengthen Swegon's position in the German HVAC market, which is Europe's largest for AHUs, by integrating HOWATHERM's technical expertise and modular product offerings. (Source: Swegon Group AB Cision News, November 22, 2024)
-
In October, 2024, Daikin Applied Europe introduced new "Compact L" ranges for its air handling units, aiming to upgrade its product portfolio with advanced ventilation solutions tailored for the compact market segment. This product launch reflects the ongoing trend towards more space-efficient and adaptable AHU designs in Europe. (Source: Daikin Applied Europe News Center, October 2, 2024)
-
In February, 2025, Trane Technologies reported strong fourth-quarter and full-year 2024 results, with commercial HVAC bookings up high single-digits. This performance indicates continued investment and demand for HVAC solutions, including AHUs, across Europe's non-residential sector, demonstrating the market's robust activity and growth drivers. (Source: Trane Technologies PR Newswire, February 6, 2025)
Research Analyst Overview
The European non-residential air handling units market is witnessing significant growth due to the increasing demand for energy efficiency and indoor air quality in commercial and industrial facilities. Air handling units (AHUs) play a crucial role in maintaining optimal environmental conditions in these buildings, ensuring occupant comfort and productivity. One of the key trends driving market growth is the integration of digital twins in AHU design and operation. Digital twins are virtual replicas of physical assets, allowing for real-time monitoring, analysis, and optimization of energy consumption and performance. This technology enables building managers to identify and address potential issues before they become major problems, reducing downtime and maintenance costs.
Another trend is the adoption of variable speed drives (VSDs) in fan systems. VSDs allow for precise control of fan speed, reducing energy consumption and improving efficiency. Additionally, they enable demand-controlled ventilation systems, which adjust airflow based on occupancy and environmental conditions, further enhancing energy savings. Air filtration and safety systems are also gaining popularity in the European non-residential AHU market. With the increasing focus on indoor air quality and health, advanced filtration technologies are being employed to remove pollutants and contaminants from the air. Safety systems, such as fire suppression and detection, are also crucial in ensuring occupant safety and compliance with regulations.
Energy management and building automation systems are also driving growth in the market. The integration of internet of things (IoT) and data analytics allows for real-time monitoring and optimization of energy usage, reducing costs and improving sustainability. Machine learning algorithms can be used to analyze data and identify patterns, enabling predictive maintenance and performance optimization. Modular design is another trend in the European non-residential AHU market. Pre-engineered and customized systems are being used to reduce installation time and costs, while ensuring high performance and energy efficiency. Noise reduction technologies are also being employed to minimize disruption and improve occupant comfort.
The European non-residential AHU market is also witnessing the integration of renewable energy sources, such as solar and wind, into building systems. Heat pumps and heat recovery systems are being used to maximize energy efficiency and reduce reliance on traditional energy sources. Building management systems and cloud computing are also being employed to facilitate remote monitoring and control of AHUs, enabling real-time optimization and maintenance. In conclusion, the European non-residential air handling units market is experiencing significant growth due to the increasing demand for energy efficiency, indoor air quality, and safety in commercial and industrial facilities. Trends such as digital twins, variable speed drives, air filtration, safety systems, energy management, and building automation are driving market growth, with a focus on modular design, noise reduction, and renewable energy integration.
|
Market Scope |
|
|
Report Coverage |
Details |
|
Page number |
188 |
|
Base year |
2023 |
|
Historic period |
2018-2022 |
|
Forecast period |
2024-2028 |
|
Growth momentum & CAGR |
Accelerate at a CAGR of 5.7% |
|
Market growth 2024-2028 |
USD 624.8 million |
|
Market structure |
Fragmented |
|
YoY growth 2023-2024(%) |
5.4 |
|
Competitive landscape |
Leading Companies, Market Positioning of Companies, Competitive Strategies, and Industry Risks |
What are the Key Data Covered in this Market Research Report?
- CAGR of the market during the forecast period
- Detailed information on factors that will drive the market growth and forecasting between 2024 and 2028
- Precise estimation of the size of the market and its contribution of the market in focus to the parent market
- Accurate predictions about upcoming market growth and trends and changes in consumer behaviour
- Growth of the market across Europe
- Thorough analysis of the market's competitive landscape and detailed information about companies
- Comprehensive analysis of factors that will challenge the growth of market companies
We can help! Our analysts can customize this market research report to meet your requirements Get in touch
 RIA -
RIA - 
