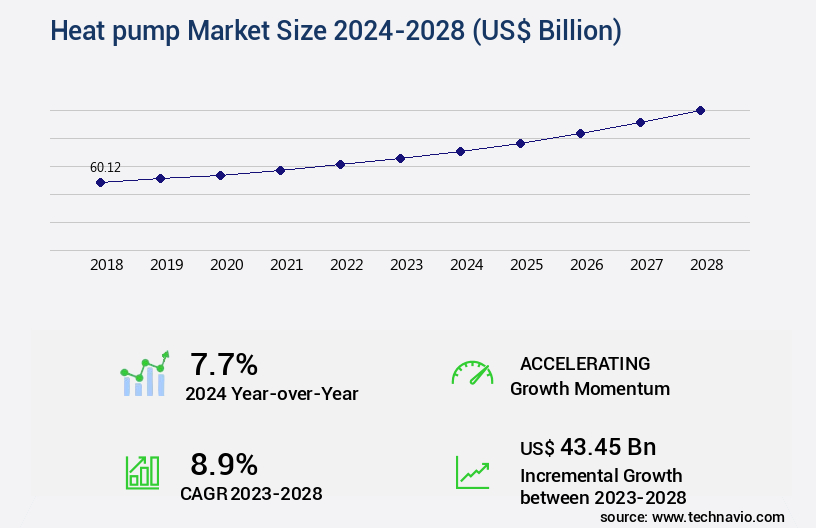
Heat pump Market Size 2024-2028
The heat pump market size is valued to increase USD 43.45 billion, at a CAGR of 8.9% from 2023 to 2028. Growing demand for heat pump from construction sector will drive the heat pump market.
Major Market Trends & Insights
- APAC dominated the market and accounted for a 43% growth during the forecast period.
- By Application - Residential segment was valued at USD 46.17 billion in 2022
- By Product - Air source heat pumps segment accounted for the largest market revenue share in 2022
Market Size & Forecast
- Market Opportunities: USD 108.30 billion
- Market Future Opportunities: USD 43.45 billion
- CAGR : 8.9%
- APAC: Largest market in 2022
Market Summary
- The market represents a dynamic and evolving industry, driven by advancements in core technologies and increasing applications across various sectors. With a growing focus on energy efficiency and sustainability, heat pumps have gained significant traction, particularly in the construction sector. According to recent reports, the construction industry accounts for over 40% of global energy consumption, making it a prime target for heat pump adoption. Another emerging trend is the increased adoption of solar-powered heat pumps, which offer a more eco-friendly alternative to traditional heating systems.
- However, challenges persist, including disposal challenges and adverse environmental impacts of refrigerants. Despite these hurdles, opportunities abound, with governments and organizations worldwide implementing regulations to phase out high-global-warming-potential refrigerants and incentivize the use of renewable energy sources in heating systems.
What will be the Size of the Heat pump Market during the forecast period?

Get Key Insights on Market Forecast (PDF) Request Free Sample
How is the Heat pump Market Segmented and what are the key trends of market segmentation?
The heat pump industry research report provides comprehensive data (region-wise segment analysis), with forecasts and estimates in "USD billion" for the period 2024-2028, as well as historical data from 2018-2022 for the following segments.
- Application
- Residential
- Commercial
- Industrial
- Product
- Air source heat pumps
- Ground source heat pumps
- Exhaust air heat pumps
- Type
- Split Heat Pumps
- Monoblock Heat Pumps
- Integrated Heat Pumps
- Refrigerant Type
- HFC
- Natural Refrigerants (Propane, CO2, Ammonia)
- HFO
- Installation
- New Installations
- Retrofit Installations
- Geography
- North America
- Europe
- Middle East and Africa
- APAC
- South America
- Rest of World (ROW)
By Application Insights
The residential segment is estimated to witness significant growth during the forecast period.
In the dynamic and evolving the market, variable refrigerant flow (VRF) systems have gained significant traction, accounting for over 30% of the current market share. Energy efficiency ratings play a crucial role in the industry, with energy management systems and smart grid integration becoming increasingly important. Thermal storage systems, variable speed drives, and thermostatic expansion valves contribute to improved refrigerant cycle efficiency. Compressor performance metrics, such as compressor efficiency and refrigerant charge optimization, are essential for enhancing system performance. Looking ahead, the market anticipates continued growth, with demand response control, evaporator coil optimization, and heat exchanger design poised to drive future expansion.
The heating capacity of heat pumps is projected to increase by 25%, while cooling capacity is expected to grow by 28%. Dual-stage compressors, heat pump installation, and dc inverter technology are key trends shaping the market. Smart home integration and outdoor unit efficiency are also gaining popularity, with electronic expansion valves and heat pump maintenance solutions becoming increasingly important. The market's ongoing evolution is characterized by advancements in technology, including scroll compressor technology and smart grid integration. These innovations contribute to improved system efficiency, enhanced user experience, and reduced environmental impact. Heat pump maintenance, refrigerant leak detection, and air handling unit optimization are crucial aspects of ensuring system longevity and optimal performance.
With a focus on sustainability and energy efficiency, the market is poised for continued growth and innovation.

Request Free Sample
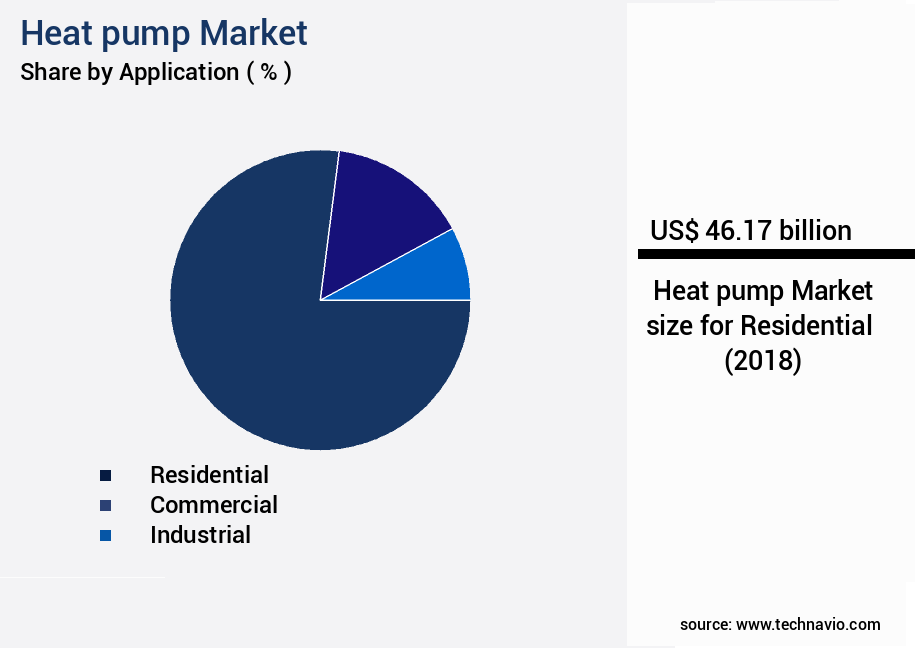
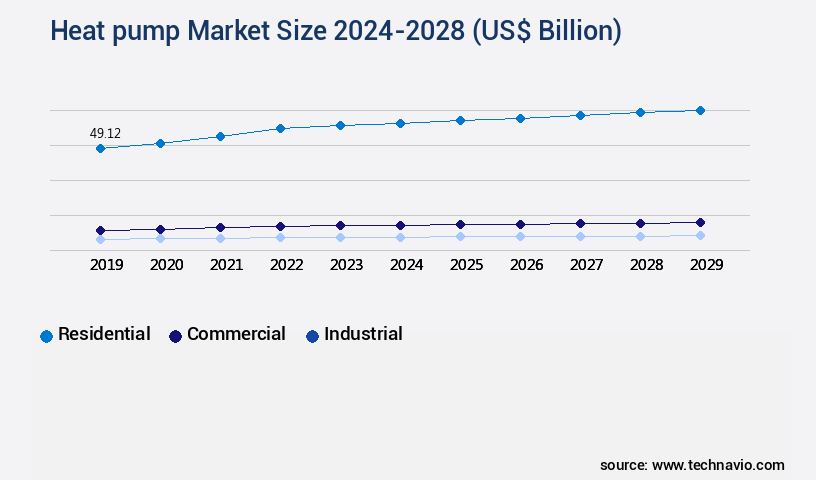
The Residential segment was valued at USD 46.17 billion in 2018 and showed a gradual increase during the forecast period.

Request Free Sample
Regional Analysis
APAC is estimated to contribute 43% to the growth of the global market during the forecast period.Technavio's analysts have elaborately explained the regional trends and drivers that shape the market during the forecast period.

See How Heat pump Market Demand is Rising in APAC Request Free Sample
The market in Asia Pacific (APAC) is experiencing significant growth, driven by the expanding construction sector. Countries such as China, Japan, India, Vietnam, South Korea, Malaysia, and Australia are key contributors to this trend. The construction industry in APAC is expected to continue growing due to urbanization, infrastructure development, and affordable housing projects. According to recent data, the construction industry in the region is projected to reach a value of USD1.7 trillion by 2022. Furthermore, the increasing adoption of energy-efficient solutions, including heat pumps, is a response to growing environmental concerns and energy regulations. For instance, in China, the government has set a target to reduce carbon emissions by 40-45% by 2025 compared to 2005 levels.
Heat pumps offer an efficient and cost-effective solution for both heating and cooling, making them an attractive option for commercial and residential buildings in APAC. Additionally, the market for heat pumps is expected to reach a value of USD112.3 billion by 2025, growing at a steady pace due to increasing demand and technological advancements.
Market Dynamics
Our researchers analyzed the data with 2023 as the base year, along with the key drivers, trends, and challenges. A holistic analysis of drivers will help companies refine their marketing strategies to gain a competitive advantage.
The market is witnessing significant growth due to the increasing emphasis on coefficient of performance optimization techniques and residential energy consumption reduction. Advanced control strategies, such as variable refrigerant flow system control and the implementation of sophisticated algorithms, are enhancing heat pump efficiency. These improvements are crucial as heat pumps account for a substantial portion of energy consumption in both residential and commercial applications. Heat pump system fault detection and diagnosis plays a vital role in maintaining optimal performance. Innovative solutions in this area enable early identification of issues, reducing downtime and minimizing energy waste.
Heat exchanger design for improved heat transfer and the adoption of refrigerants with favorable properties further boost heat pump performance. Smart grid integration strategies and energy consumption monitoring are essential for enhancing heat pump efficiency. These technologies facilitate seamless communication between the heat pump system and the power grid, enabling efficient energy usage and cost savings. Heat pump maintenance procedures extend the lifespan of these systems, ensuring continuous operation and minimizing repair costs. Retrofitting existing systems with energy-efficient components and implementing heat pump system sizing strategies for residential applications are popular trends in the market.
In commercial building design, heat pump systems are increasingly being adopted for their energy efficiency and versatility. Geothermal and water-source heat pump systems are popular choices due to their high efficiency and minimal environmental impact. Air-source heat pump system performance analysis and capacity modulation control techniques are essential for optimizing their operation in various applications. Variable speed compressor operation and electronic expansion valve control strategies are critical for improving heat pump efficiency. These technologies enable precise control over system performance, ensuring optimal energy usage and reducing overall operating costs. Comparatively, the industrial application segment accounts for a significantly larger share of the market compared to the academic sector.
This trend is driven by the increasing adoption of heat pumps in various industries for process heating and cooling applications.

What are the key market drivers leading to the rise in the adoption of Heat pump Industry?
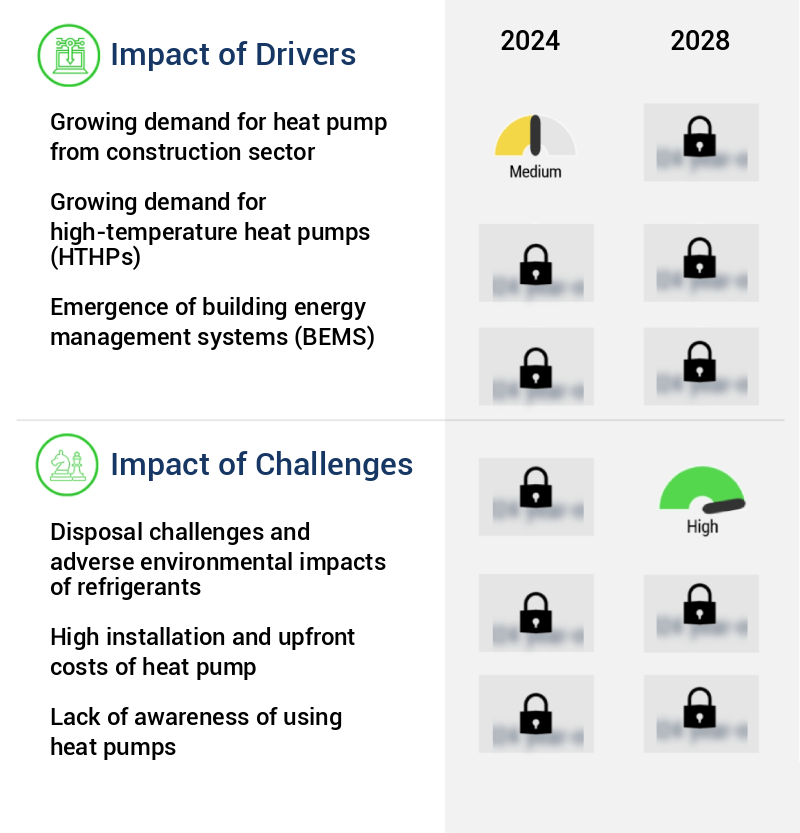
- The construction sector's increasing demand for heat pumps serves as the primary market driver.
- The construction industry's growth trajectory significantly influences the rising demand for heat pumps. With the continuous expansion of commercial and residential building projects, heat pumps have gained popularity due to their versatile applications. In various sectors, heat pumps serve essential functions such as air conditioning, refrigeration, and space heating. Moreover, they are increasingly utilized for hot water supply in commercial establishments, cold storage facilities, and industrial processes requiring heat and steam. Heat pumps have become a pivotal component in both the commercial and residential sectors across numerous countries. For example, Europe's 2020 energy objectives partially rely on this technology.
- The adaptability and efficiency of heat pumps make them an indispensable solution for modern building requirements. Their ability to provide heating, cooling, and hot water from a single system significantly reduces energy consumption and operational costs.
What are the market trends shaping the Heat pump Industry?
- The increasing use of solar-powered heat pumps represents a significant market trend. Heat pumps that harness solar energy for operation are gaining widespread adoption.
- With increasing environmental consciousness and the implementation of regulations to minimize greenhouse gas emissions, there's a notable shift in fuel preference across industries and commercial sectors. This trend is significantly influencing the heat pump industry. Solar-powered heat pumps have seen a marked increase in adoption, a trend that is predicted to persist throughout the forecast period. This surge in adoption is primarily driven by the financial advantages they provide.
- By installing a heat pump in conjunction with a solar photovoltaic (PV) system, businesses can enjoy substantial energy savings and reduced reliance on fossil fuels. The benefits of this combination are compelling, making solar-powered heat pumps a popular choice for businesses seeking energy efficiency and sustainability.
What challenges does the Heat pump Industry face during its growth?
- The growth of the refrigeration industry is significantly influenced by the complex disposal issues and the adverse environmental impacts associated with refrigerants.
- Heat pumps, an essential component of sustainable HVAC systems, employ various refrigerants to facilitate the transfer of heat. Among the commonly used refrigerants are R134a, R600 and R600a, R717, R407c, and R410a. Each refrigerant offers distinct advantages for diverse heat pump applications. For instance, R134a is widely used in medium- and large-sized heat pumps, while R600 and R600a are suitable for high-temperature applications. R717 is the preferred choice for industrial heat pumps, and R407c and R410a are utilized in medium-sized heat pumps with dual functionality.
- However, the utilization of these refrigerants poses challenges, primarily concerning their disposal. Regulations governing refrigerant usage and disposal have been established due to their environmental impact. As a professional, it is crucial to adhere to these guidelines to minimize the environmental footprint and ensure sustainable HVAC practices.
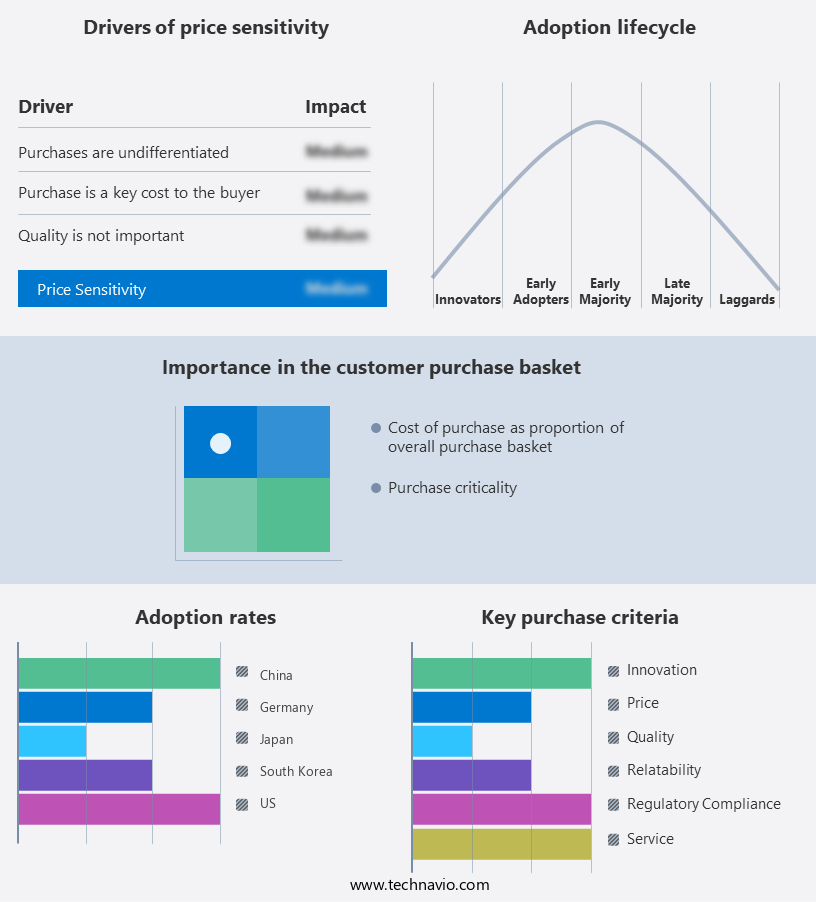
Exclusive Customer Landscape
The heat pump market forecasting report includes the adoption lifecycle of the market, covering from the innovator's stage to the laggard's stage. It focuses on adoption rates in different regions based on penetration. Furthermore, the heat pump market report also includes key purchase criteria and drivers of price sensitivity to help companies evaluate and develop their market growth analysis strategies.

Customer Landscape of Heat pump Industry
Competitive Landscape & Market Insights
Companies are implementing various strategies, such as strategic alliances, heat pump market forecast, partnerships, mergers and acquisitions, geographical expansion, and product/service launches, to enhance their presence in the industry.
Bard HVAC - This company specializes in providing high-quality hiking gear, including the Eastrail 2.0 hiking shoes, Terrex Multiwind jacket, and Terrex Free Hiker 2.0. Their product range caters to the needs of avid hikers, ensuring comfort, durability, and protection in various weather conditions. The company's commitment to innovation and functionality sets it apart in the market.
The industry research and growth report includes detailed analyses of the competitive landscape of the market and information about key companies, including:
- Bard HVAC
- Daikin Industries Ltd.
- Danfoss AS
- Dantherm Group AS
- DENSO Corp.
- Emerson Electric Co.
- Fujitsu Ltd.
- Glen Dimplex Europe Holdings Ltd.
- Guangdong Aoxin Heat Pump Air Conditioning Co. Ltd.
- Hayward Holdings Inc.
- Ingersoll Rand Inc.
- Johnson Controls International Plc
- Kensa Group
- Lennox International Inc.
- Mitsubishi Electric Corp.
- NIBE Industrier AB
- Nortek
- Rheem Manufacturing Co.
- Robert Bosch GmbH
- STIEBEL ELTRON GmbH and Co. KG
Qualitative and quantitative analysis of companies has been conducted to help clients understand the wider business environment as well as the strengths and weaknesses of key industry players. Data is qualitatively analyzed to categorize companies as pure play, category-focused, industry-focused, and diversified; it is quantitatively analyzed to categorize companies as dominant, leading, strong, tentative, and weak.
Recent Development and News in Heat Pump Market
- In January 2024, Carrier Global Corporation, a leading HVAC (Heating, Ventilation, and Air Conditioning) manufacturer, announced the launch of its new line of residential heat pumps, the Infinity® Flex™ Electric, which offers up to 50% more heating capacity compared to previous models (Carrier Global Corporation Press Release).
- In March 2024, Danfoss, a Danish engineering company, and Schneider Electric, a French energy management and automation company, entered into a strategic partnership to develop integrated heating and cooling solutions, combining Danfoss' heat pump expertise with Schneider Electric's energy management systems (Danfoss Press Release).
- In May 2024, LG Electronics, a South Korean technology company, secured a USD100 million investment from South Korea's National Pension Service to expand its production capacity for heat pumps and air conditioners, aiming to capture a larger share of the global market (Bloomberg).
- In April 2025, the European Union (EU) passed the revised Energy Performance of Buildings Directive (EPBD), which mandates the installation of energy-efficient heating and cooling systems, including heat pumps, in all new and renovated buildings by 2030 (European Parliament Press Release).
Dive into Technavio's robust research methodology, blending expert interviews, extensive data synthesis, and validated models for unparalleled Heat pump Market insights. See full methodology.
|
Market Scope
|
|
Report Coverage
|
Details
|
|
Page number
|
176
|
|
Base year
|
2023
|
|
Historic period
|
2018-2022 |
|
Forecast period
|
2024-2028
|
|
Growth momentum & CAGR
|
Accelerate at a CAGR of 8.9%
|
|
Market growth 2024-2028
|
USD 43.45 billion
|
|
Market structure
|
Fragmented
|
|
YoY growth 2023-2024(%)
|
7.7
|
|
Key countries
|
US, Canada, Germany, UK, Italy, France, China, India, Japan, Brazil, Egypt, UAE, Oman, Argentina, KSA, UAE, Brazil, and Rest of World (ROW)
|
|
Competitive landscape
|
Leading Companies, Market Positioning of Companies, Competitive Strategies, and Industry Risks
|
Request Free Sample
Research Analyst Overview
- The market is a dynamic and evolving landscape, characterized by continuous innovation and advancements in technology. One of the key trends shaping this market is the increasing emphasis on energy efficiency, with variable refrigerant flow (VRF) systems gaining popularity due to their ability to provide customized heating and cooling solutions. These systems offer improved energy efficiency ratings, making them a preferred choice for businesses and homeowners seeking to reduce their carbon footprint. Another significant development in the market is the integration of thermal storage systems, variable speed drives, and energy management systems. These technologies enable better control over heating and cooling demands, optimizing refrigerant cycle efficiency and compressor performance.
- Moreover, smart grid integration and demand response control further enhance the market's flexibility and responsiveness to energy supply and demand patterns. Evaporator coil optimization and heat exchanger design are other critical areas of focus, with innovations leading to increased indoor unit efficiency and cooling capacity. Dual-stage compressors and dc inverter technology are among the advancements driving these improvements, offering better temperature control and energy savings. Heat pump maintenance and refrigerant leak detection have also emerged as crucial aspects of the market, with smart home integration and advanced diagnostic tools facilitating more efficient and cost-effective maintenance practices.
- The market's ongoing evolution is further reflected in the development of scroll compressor technology and electronic expansion valves, which contribute to improved heating capacity and overall system performance. In summary, the market is characterized by a continuous unfolding of new technologies and trends, with energy efficiency, smart grid integration, and advanced compressor technologies driving market growth and innovation.
What are the Key Data Covered in this Heat pump Market Research and Growth Report?
-
What is the expected growth of the Heat pump Market between 2024 and 2028?
-
What segmentation does the market report cover?
-
The report is segmented by Application (Residential, Commercial, and Industrial), Product (Air source heat pumps, Ground source heat pumps, and Exhaust air heat pumps), Geography (APAC, North America, Europe, South America, and Middle East and Africa), Type (Split Heat Pumps, Monoblock Heat Pumps, and Integrated Heat Pumps), Refrigerant Type (HFC, Natural Refrigerants (Propane, CO2, Ammonia), and HFO), and Installation (New Installations and Retrofit Installations)
-
Which regions are analyzed in the report?
-
APAC, North America, Europe, South America, and Middle East and Africa
-
What are the key growth drivers and market challenges?
-
Who are the major players in the Heat pump Market?
-
Bard HVAC, Daikin Industries Ltd., Danfoss AS, Dantherm Group AS, DENSO Corp., Emerson Electric Co., Fujitsu Ltd., Glen Dimplex Europe Holdings Ltd., Guangdong Aoxin Heat Pump Air Conditioning Co. Ltd., Hayward Holdings Inc., Ingersoll Rand Inc., Johnson Controls International Plc, Kensa Group, Lennox International Inc., Mitsubishi Electric Corp., NIBE Industrier AB, Nortek, Rheem Manufacturing Co., Robert Bosch GmbH, and STIEBEL ELTRON GmbH and Co. KG
Market Research Insights
- The market encompasses a diverse range of technologies, including zoning control systems and air-to-water and water-to-water systems. This growth is driven by the increasing demand for energy-efficient heating and cooling solutions, as well as the integration of renewable energy sources. One key factor differentiating heat pump systems is their compressor capacity, which can range from small residential units to large commercial applications. For instance, a typical residential air-source heat pump has a compressor capacity of around 2-5 tons, while a commercial water-source heat pump can have a capacity of up to 2,000 tons.
- Another significant factor is the refrigerant properties, which influence system efficiency and environmental impact. For example, R410A, a commonly used refrigerant, has a higher global warming potential than R134A but offers greater efficiency improvements. Heat pumps also offer various features such as load balancing, home automation, building automation, thermal energy storage, system diagnostics, capacity modulation, fault detection, maintenance schedule, and service life. These advanced capabilities contribute to the systems' long-term performance and cost-effectiveness. Additionally, geothermal systems and hybrid systems are gaining popularity due to their enhanced energy efficiency and lower carbon footprint. Overall, the market continues to evolve, with ongoing research and development focusing on component lifespan, efficiency improvements, energy consumption monitoring, and renewable energy integration.
We can help! Our analysts can customize this heat pump market research report to meet your requirements.
Get in touch
1 Executive Summary
- 1.1 Market overview
- Exhibit 01: Executive Summary – Chart on Market Overview
- Exhibit 02: Executive Summary – Data Table on Market Overview
- Exhibit 03: Executive Summary – Chart on Global Market Characteristics
- Exhibit 04: Executive Summary – Chart on Market by Geography
- Exhibit 05: Executive Summary – Chart on Market Segmentation by Application
- Exhibit 06: Executive Summary – Chart on Market Segmentation by Product
- Exhibit 07: Executive Summary – Chart on Incremental Growth
- Exhibit 08: Executive Summary – Data Table on Incremental Growth
- Exhibit 09: Executive Summary – Chart on Vendor Market Positioning
2 Market Landscape
- 2.1 Market ecosystem
- Exhibit 10: Parent market
- Exhibit 11: Market Characteristics
3 Market Sizing
- 3.1 Market definition
- Exhibit 12: Offerings of vendors included in the market definition
- 3.2 Market segment analysis
- Exhibit 13: Market segments
- 3.4 Market outlook: Forecast for 2023-2028
- Exhibit 14: Chart on Global - Market size and forecast 2023-2028 ($ million)
- Exhibit 15: Data Table on Global - Market size and forecast 2023-2028 ($ million)
- Exhibit 16: Chart on Global Market: Year-over-year growth 2023-2028 (%)
- Exhibit 17: Data Table on Global Market: Year-over-year growth 2023-2028 (%)
4 Historic Market Size
- 4.1 Global heat pump market 2018 - 2022
- Exhibit 18: Historic Market Size – Data Table on global heat pump market 2018 - 2022 ($ million)
- 4.2 Application Segment Analysis 2018 - 2022
- Exhibit 19: Historic Market Size – Application Segment 2018 - 2022 ($ million)
- 4.3 Product Segment Analysis 2018 - 2022
- Exhibit 20: Historic Market Size – Product Segment 2018 - 2022 ($ million)
- 4.4 Geography Segment Analysis 2018 - 2022
- Exhibit 21: Historic Market Size – Geography Segment 2018 - 2022 ($ million)
- 4.5 Country Segment Analysis 2018 - 2022
- Exhibit 22: Historic Market Size – Country Segment 2018 - 2022 ($ million)
5 Five Forces Analysis
- 5.1 Five forces summary
- Exhibit 23: Five forces analysis - Comparison between 2023 and 2028
- 5.2 Bargaining power of buyers
- Exhibit 24: Chart on Bargaining power of buyers – Impact of key factors 2023 and 2028
- 5.3 Bargaining power of suppliers
- Exhibit 25: Bargaining power of suppliers – Impact of key factors in 2023 and 2028
- 5.4 Threat of new entrants
- Exhibit 26: Threat of new entrants – Impact of key factors in 2023 and 2028
- 5.5 Threat of substitutes
- Exhibit 27: Threat of substitutes – Impact of key factors in 2023 and 2028
- 5.6 Threat of rivalry
- Exhibit 28: Threat of rivalry – Impact of key factors in 2023 and 2028
- 5.7 Market condition
- Exhibit 29: Chart on Market condition - Five forces 2023 and 2028
6 Market Segmentation by Application
- 6.1 Market segments
- Chart on Application - Market share (2023-2028) (%)
- Data Table on Application - Market share (2023-2028) (%)
- 6.2 Comparison by Application
- Chart on Comparison by Application
- Data Table on Comparison by Application
- 6.3 Residential - Market size and forecast (2023-2028)
- Chart on Residential - Market size and forecast (2023-2028) ($ million)
- Data Table on Residential - Market size and forecast (2023-2028) ($ million)
- Chart on Residential - Year-over-year growth (2023-2028) (%)
- Data Table on Residential - Year-over-year growth (2023-2028) (%)
- 6.4 Commercial - Market size and forecast (2023-2028)
- Chart on Commercial - Market size and forecast (2023-2028) ($ million)
- Data Table on Commercial - Market size and forecast (2023-2028) ($ million)
- Chart on Commercial - Year-over-year growth (2023-2028) (%)
- Data Table on Commercial - Year-over-year growth (2023-2028) (%)
- 6.5 Industrial - Market size and forecast (2023-2028)
- Chart on Industrial - Market size and forecast (2023-2028) ($ million)
- Data Table on Industrial - Market size and forecast (2023-2028) ($ million)
- Chart on Industrial - Year-over-year growth (2023-2028) (%)
- Data Table on Industrial - Year-over-year growth (2023-2028) (%)
- 6.6 Market opportunity by Application
- Market opportunity by Application ($ million)
- Data Table on Market opportunity by Application ($ million)
7 Market Segmentation by Product
- 7.1 Market segments
- Chart on Product - Market share (2023-2028) (%)
- Data Table on Product - Market share (2023-2028) (%)
- 7.2 Comparison by Product
- Chart on Comparison by Product
- Data Table on Comparison by Product
- 7.3 Air source heat pumps - Market size and forecast (2023-2028)
- Chart on Air source heat pumps - Market size and forecast (2023-2028) ($ million)
- Data Table on Air source heat pumps - Market size and forecast (2023-2028) ($ million)
- Chart on Air source heat pumps - Year-over-year growth (2023-2028) (%)
- Data Table on Air source heat pumps - Year-over-year growth (2023-2028) (%)
- 7.4 Ground source heat pumps - Market size and forecast (2023-2028)
- Chart on Ground source heat pumps - Market size and forecast (2023-2028) ($ million)
- Data Table on Ground source heat pumps - Market size and forecast (2023-2028) ($ million)
- Chart on Ground source heat pumps - Year-over-year growth (2023-2028) (%)
- Data Table on Ground source heat pumps - Year-over-year growth (2023-2028) (%)
- 7.5 Exhaust air heat pumps - Market size and forecast (2023-2028)
- Chart on Exhaust air heat pumps - Market size and forecast (2023-2028) ($ million)
- Data Table on Exhaust air heat pumps - Market size and forecast (2023-2028) ($ million)
- Chart on Exhaust air heat pumps - Year-over-year growth (2023-2028) (%)
- Data Table on Exhaust air heat pumps - Year-over-year growth (2023-2028) (%)
- 7.6 Market opportunity by Product
- Market opportunity by Product ($ million)
- Data Table on Market opportunity by Product ($ million)
8 Market Segmentation by Type
- 8.1 Market segments
- Chart on Type - Market share (2023-2028) (%)
- Data Table on Type - Market share (2023-2028) (%)
- 8.2 Comparison by Type
- Chart on Comparison by Type
- Data Table on Comparison by Type
- 8.3 Split Heat Pumps - Market size and forecast (2023-2028)
- Chart on Split Heat Pumps - Market size and forecast (2023-2028) ($ million)
- Data Table on Split Heat Pumps - Market size and forecast (2023-2028) ($ million)
- Chart on Split Heat Pumps - Year-over-year growth (2023-2028) (%)
- Data Table on Split Heat Pumps - Year-over-year growth (2023-2028) (%)
- 8.4 Monoblock Heat Pumps - Market size and forecast (2023-2028)
- Chart on Monoblock Heat Pumps - Market size and forecast (2023-2028) ($ million)
- Data Table on Monoblock Heat Pumps - Market size and forecast (2023-2028) ($ million)
- Chart on Monoblock Heat Pumps - Year-over-year growth (2023-2028) (%)
- Data Table on Monoblock Heat Pumps - Year-over-year growth (2023-2028) (%)
- 8.5 Integrated Heat Pumps - Market size and forecast (2023-2028)
- Chart on Integrated Heat Pumps - Market size and forecast (2023-2028) ($ million)
- Data Table on Integrated Heat Pumps - Market size and forecast (2023-2028) ($ million)
- Chart on Integrated Heat Pumps - Year-over-year growth (2023-2028) (%)
- Data Table on Integrated Heat Pumps - Year-over-year growth (2023-2028) (%)
- 8.6 Market opportunity by Type
- Market opportunity by Type ($ million)
- Data Table on Market opportunity by Type ($ million)
9 Market Segmentation by Refrigerant Type
- 9.1 Market segments
- Chart on Refrigerant Type - Market share (2023-2028) (%)
- Data Table on Refrigerant Type - Market share (2023-2028) (%)
- 9.2 Comparison by Refrigerant Type
- Chart on Comparison by Refrigerant Type
- Data Table on Comparison by Refrigerant Type
- 9.3 HFC - Market size and forecast (2023-2028)
- Chart on HFC - Market size and forecast (2023-2028) ($ million)
- Data Table on HFC - Market size and forecast (2023-2028) ($ million)
- Chart on HFC - Year-over-year growth (2023-2028) (%)
- Data Table on HFC - Year-over-year growth (2023-2028) (%)
- 9.4 Natural Refrigerants (Propane, CO2, Ammonia) - Market size and forecast (2023-2028)
- Chart on Natural Refrigerants (Propane, CO2, Ammonia) - Market size and forecast (2023-2028) ($ million)
- Data Table on Natural Refrigerants (Propane, CO2, Ammonia) - Market size and forecast (2023-2028) ($ million)
- Chart on Natural Refrigerants (Propane, CO2, Ammonia) - Year-over-year growth (2023-2028) (%)
- Data Table on Natural Refrigerants (Propane, CO2, Ammonia) - Year-over-year growth (2023-2028) (%)
- 9.5 HFO - Market size and forecast (2023-2028)
- Chart on HFO - Market size and forecast (2023-2028) ($ million)
- Data Table on HFO - Market size and forecast (2023-2028) ($ million)
- Chart on HFO - Year-over-year growth (2023-2028) (%)
- Data Table on HFO - Year-over-year growth (2023-2028) (%)
- 9.6 Market opportunity by Refrigerant Type
- Market opportunity by Refrigerant Type ($ million)
- Data Table on Market opportunity by Refrigerant Type ($ million)
10 Market Segmentation by Installation
- 10.1 Market segments
- Chart on Installation - Market share (2023-2028) (%)
- Data Table on Installation - Market share (2023-2028) (%)
- 10.2 Comparison by Installation
- Chart on Comparison by Installation
- Data Table on Comparison by Installation
- 10.3 New Installations - Market size and forecast (2023-2028)
- Chart on New Installations - Market size and forecast (2023-2028) ($ million)
- Data Table on New Installations - Market size and forecast (2023-2028) ($ million)
- Chart on New Installations - Year-over-year growth (2023-2028) (%)
- Data Table on New Installations - Year-over-year growth (2023-2028) (%)
- 10.4 Retrofit Installations - Market size and forecast (2023-2028)
- Chart on Retrofit Installations - Market size and forecast (2023-2028) ($ million)
- Data Table on Retrofit Installations - Market size and forecast (2023-2028) ($ million)
- Chart on Retrofit Installations - Year-over-year growth (2023-2028) (%)
- Data Table on Retrofit Installations - Year-over-year growth (2023-2028) (%)
- 10.5 Market opportunity by Installation
- Market opportunity by Installation ($ million)
- Data Table on Market opportunity by Installation ($ million)
8 Customer Landscape
- 8.1 Customer landscape overview
- Exhibit 66: Analysis of price sensitivity, lifecycle, customer purchase basket, adoption rates, and purchase criteria
9 Geographic Landscape
- 9.1 Geographic segmentation
- Exhibit 67: Chart on Market share by geography 2023-2028 (%)
- Exhibit 68: Data Table on Market share by geography 2023-2028 (%)
- 9.2 Geographic comparison
- Exhibit 69: Chart on Geographic comparison
- Exhibit 70: Data Table on Geographic comparison
- 9.3 APAC - Market size and forecast 2023-2028
- Exhibit 71: Chart on APAC - Market size and forecast 2023-2028 ($ million)
- Exhibit 72: Data Table on APAC - Market size and forecast 2023-2028 ($ million)
- Exhibit 73: Chart on APAC - Year-over-year growth 2023-2028 (%)
- Exhibit 74: Data Table on APAC - Year-over-year growth 2023-2028 (%)
- 9.4 North America - Market size and forecast 2023-2028
- Exhibit 75: Chart on North America - Market size and forecast 2023-2028 ($ million)
- Exhibit 76: Data Table on North America - Market size and forecast 2023-2028 ($ million)
- Exhibit 77: Chart on North America - Year-over-year growth 2023-2028 (%)
- Exhibit 78: Data Table on North America - Year-over-year growth 2023-2028 (%)
- 9.5 Europe - Market size and forecast 2023-2028
- Exhibit 79: Chart on Europe - Market size and forecast 2023-2028 ($ million)
- Exhibit 80: Data Table on Europe - Market size and forecast 2023-2028 ($ million)
- Exhibit 81: Chart on Europe - Year-over-year growth 2023-2028 (%)
- Exhibit 82: Data Table on Europe - Year-over-year growth 2023-2028 (%)
- 9.6 South America - Market size and forecast 2023-2028
- Exhibit 83: Chart on South America - Market size and forecast 2023-2028 ($ million)
- Exhibit 84: Data Table on South America - Market size and forecast 2023-2028 ($ million)
- Exhibit 85: Chart on South America - Year-over-year growth 2023-2028 (%)
- Exhibit 86: Data Table on South America - Year-over-year growth 2023-2028 (%)
- 9.7 Middle East and Africa - Market size and forecast 2023-2028
- Exhibit 87: Chart on Middle East and Africa - Market size and forecast 2023-2028 ($ million)
- Exhibit 88: Data Table on Middle East and Africa - Market size and forecast 2023-2028 ($ million)
- Exhibit 89: Chart on Middle East and Africa - Year-over-year growth 2023-2028 (%)
- Exhibit 90: Data Table on Middle East and Africa - Year-over-year growth 2023-2028 (%)
- 9.8 US - Market size and forecast 2023-2028
- Exhibit 91: Chart on US - Market size and forecast 2023-2028 ($ million)
- Exhibit 92: Data Table on US - Market size and forecast 2023-2028 ($ million)
- Exhibit 93: Chart on US - Year-over-year growth 2023-2028 (%)
- Exhibit 94: Data Table on US - Year-over-year growth 2023-2028 (%)
- 9.9 China - Market size and forecast 2023-2028
- Exhibit 95: Chart on China - Market size and forecast 2023-2028 ($ million)
- Exhibit 96: Data Table on China - Market size and forecast 2023-2028 ($ million)
- Exhibit 97: Chart on China - Year-over-year growth 2023-2028 (%)
- Exhibit 98: Data Table on China - Year-over-year growth 2023-2028 (%)
- 9.10 Germany - Market size and forecast 2023-2028
- Exhibit 99: Chart on Germany - Market size and forecast 2023-2028 ($ million)
- Exhibit 100: Data Table on Germany - Market size and forecast 2023-2028 ($ million)
- Exhibit 101: Chart on Germany - Year-over-year growth 2023-2028 (%)
- Exhibit 102: Data Table on Germany - Year-over-year growth 2023-2028 (%)
- 9.11 Japan - Market size and forecast 2023-2028
- Exhibit 103: Chart on Japan - Market size and forecast 2023-2028 ($ million)
- Exhibit 104: Data Table on Japan - Market size and forecast 2023-2028 ($ million)
- Exhibit 105: Chart on Japan - Year-over-year growth 2023-2028 (%)
- Exhibit 106: Data Table on Japan - Year-over-year growth 2023-2028 (%)
- 9.12 South Korea - Market size and forecast 2023-2028
- Exhibit 107: Chart on South Korea - Market size and forecast 2023-2028 ($ million)
- Exhibit 108: Data Table on South Korea - Market size and forecast 2023-2028 ($ million)
- Exhibit 109: Chart on South Korea - Year-over-year growth 2023-2028 (%)
- Exhibit 110: Data Table on South Korea - Year-over-year growth 2023-2028 (%)
- 9.13 Market opportunity by geography
- Exhibit 111: Market opportunity by geography ($ million)
- Exhibit 112: Data Tables on Market opportunity by geography ($ million)
- 12.14 Canada - Market size and forecast (2023-2028)
- Chart on Canada - Market size and forecast (2023-2028) ($ million)
- Data Table on Canada - Market size and forecast (2023-2028) ($ million)
- Chart on Canada - Year-over-year growth (2023-2028) (%)
- Data Table on Canada - Year-over-year growth (2023-2028) (%)
- 12.15 UK - Market size and forecast (2023-2028)
- Chart on UK - Market size and forecast (2023-2028) ($ million)
- Data Table on UK - Market size and forecast (2023-2028) ($ million)
- Chart on UK - Year-over-year growth (2023-2028) (%)
- Data Table on UK - Year-over-year growth (2023-2028) (%)
- 12.16 Italy - Market size and forecast (2023-2028)
- Chart on Italy - Market size and forecast (2023-2028) ($ million)
- Data Table on Italy - Market size and forecast (2023-2028) ($ million)
- Chart on Italy - Year-over-year growth (2023-2028) (%)
- Data Table on Italy - Year-over-year growth (2023-2028) (%)
- 12.17 France - Market size and forecast (2023-2028)
- Chart on France - Market size and forecast (2023-2028) ($ million)
- Data Table on France - Market size and forecast (2023-2028) ($ million)
- Chart on France - Year-over-year growth (2023-2028) (%)
- Data Table on France - Year-over-year growth (2023-2028) (%)
- 12.18 India - Market size and forecast (2023-2028)
- Chart on India - Market size and forecast (2023-2028) ($ million)
- Data Table on India - Market size and forecast (2023-2028) ($ million)
- Chart on India - Year-over-year growth (2023-2028) (%)
- Data Table on India - Year-over-year growth (2023-2028) (%)
- 12.19 Brazil - Market size and forecast (2023-2028)
- Chart on Brazil - Market size and forecast (2023-2028) ($ million)
- Data Table on Brazil - Market size and forecast (2023-2028) ($ million)
- Chart on Brazil - Year-over-year growth (2023-2028) (%)
- Data Table on Brazil - Year-over-year growth (2023-2028) (%)
- 12.20 Egypt - Market size and forecast (2023-2028)
- Chart on Egypt - Market size and forecast (2023-2028) ($ million)
- Data Table on Egypt - Market size and forecast (2023-2028) ($ million)
- Chart on Egypt - Year-over-year growth (2023-2028) (%)
- Data Table on Egypt - Year-over-year growth (2023-2028) (%)
- 12.21 UAE - Market size and forecast (2023-2028)
- Chart on UAE - Market size and forecast (2023-2028) ($ million)
- Data Table on UAE - Market size and forecast (2023-2028) ($ million)
- Chart on UAE - Year-over-year growth (2023-2028) (%)
- Data Table on UAE - Year-over-year growth (2023-2028) (%)
- 12.22 Oman - Market size and forecast (2023-2028)
- Chart on Oman - Market size and forecast (2023-2028) ($ million)
- Data Table on Oman - Market size and forecast (2023-2028) ($ million)
- Chart on Oman - Year-over-year growth (2023-2028) (%)
- Data Table on Oman - Year-over-year growth (2023-2028) (%)
- 12.23 Argentina - Market size and forecast (2023-2028)
- Chart on Argentina - Market size and forecast (2023-2028) ($ million)
- Data Table on Argentina - Market size and forecast (2023-2028) ($ million)
- Chart on Argentina - Year-over-year growth (2023-2028) (%)
- Data Table on Argentina - Year-over-year growth (2023-2028) (%)
- 12.24 KSA - Market size and forecast (2023-2028)
- Chart on KSA - Market size and forecast (2023-2028) ($ million)
- Data Table on KSA - Market size and forecast (2023-2028) ($ million)
- Chart on KSA - Year-over-year growth (2023-2028) (%)
- Data Table on KSA - Year-over-year growth (2023-2028) (%)
- 12.25 Rest of World (ROW) - Market size and forecast (2023-2028)
- Chart on Rest of World (ROW) - Market size and forecast (2023-2028) ($ million)
- Data Table on Rest of World (ROW) - Market size and forecast (2023-2028) ($ million)
- Chart on Rest of World (ROW) - Year-over-year growth (2023-2028) (%)
- Data Table on Rest of World (ROW) - Year-over-year growth (2023-2028) (%)
10 Drivers, Challenges, and Trends
- 10.3 Impact of drivers and challenges
- Exhibit 113: Impact of drivers and challenges in 2023 and 2028
11 Vendor Landscape
- 11.2 Vendor landscape
- Exhibit 114: Overview on Criticality of inputs and Factors of differentiation
- 11.3 Landscape disruption
- Exhibit 115: Overview on factors of disruption
- 11.4 Industry risks
- Exhibit 116: Impact of key risks on business
12 Vendor Analysis
- 12.1 Vendors covered
- Exhibit 117: Vendors covered
- 12.2 Market positioning of vendors
- Exhibit 118: Matrix on vendor position and classification
- 12.3 Bard HVAC
- Exhibit 119: Bard HVAC - Overview
- Exhibit 120: Bard HVAC - Product / Service
- Exhibit 121: Bard HVAC - Key offerings
- 12.4 Daikin Industries Ltd.
- Exhibit 122: Daikin Industries Ltd. - Overview
- Exhibit 123: Daikin Industries Ltd. - Business segments
- Exhibit 124: Daikin Industries Ltd. - Key news
- Exhibit 125: Daikin Industries Ltd. - Key offerings
- Exhibit 126: Daikin Industries Ltd. - Segment focus
- 12.5 Danfoss AS
- Exhibit 127: Danfoss AS - Overview
- Exhibit 128: Danfoss AS - Business segments
- Exhibit 129: Danfoss AS - Key news
- Exhibit 130: Danfoss AS - Key offerings
- Exhibit 131: Danfoss AS - Segment focus
- 12.6 Dantherm Group AS
- Exhibit 132: Dantherm Group AS - Overview
- Exhibit 133: Dantherm Group AS - Product / Service
- Exhibit 134: Dantherm Group AS - Key offerings
- 12.7 DENSO Corp.
- Exhibit 135: DENSO Corp. - Overview
- Exhibit 136: DENSO Corp. - Business segments
- Exhibit 137: DENSO Corp. - Key news
- Exhibit 138: DENSO Corp. - Key offerings
- Exhibit 139: DENSO Corp. - Segment focus
- 12.8 Emerson Electric Co.
- Exhibit 140: Emerson Electric Co. - Overview
- Exhibit 141: Emerson Electric Co. - Business segments
- Exhibit 142: Emerson Electric Co. - Key news
- Exhibit 143: Emerson Electric Co. - Key offerings
- Exhibit 144: Emerson Electric Co. - Segment focus
- 12.9 Fujitsu Ltd.
- Exhibit 145: Fujitsu Ltd. - Overview
- Exhibit 146: Fujitsu Ltd. - Business segments
- Exhibit 147: Fujitsu Ltd. - Key news
- Exhibit 148: Fujitsu Ltd. - Key offerings
- Exhibit 149: Fujitsu Ltd. - Segment focus
- 12.10 Ingersoll Rand Inc.
- Exhibit 150: Ingersoll Rand Inc. - Overview
- Exhibit 151: Ingersoll Rand Inc. - Business segments
- Exhibit 152: Ingersoll Rand Inc. - Key offerings
- Exhibit 153: Ingersoll Rand Inc. - Segment focus
- 12.11 Johnson Controls International Plc
- Exhibit 154: Johnson Controls International Plc - Overview
- Exhibit 155: Johnson Controls International Plc - Business segments
- Exhibit 156: Johnson Controls International Plc - Key news
- Exhibit 157: Johnson Controls International Plc - Key offerings
- Exhibit 158: Johnson Controls International Plc - Segment focus
- 12.12 Lennox International Inc.
- Exhibit 159: Lennox International Inc. - Overview
- Exhibit 160: Lennox International Inc. - Business segments
- Exhibit 161: Lennox International Inc. - Key offerings
- Exhibit 162: Lennox International Inc. - Segment focus
- 12.13 Mitsubishi Electric Corp.
- Exhibit 163: Mitsubishi Electric Corp. - Overview
- Exhibit 164: Mitsubishi Electric Corp. - Business segments
- Exhibit 165: Mitsubishi Electric Corp. - Key news
- Exhibit 166: Mitsubishi Electric Corp. - Key offerings
- Exhibit 167: Mitsubishi Electric Corp. - Segment focus
- 12.14 NIBE Industrier AB
- Exhibit 168: NIBE Industrier AB - Overview
- Exhibit 169: NIBE Industrier AB - Business segments
- Exhibit 170: NIBE Industrier AB - Key news
- Exhibit 171: NIBE Industrier AB - Key offerings
- Exhibit 172: NIBE Industrier AB - Segment focus
- 12.15 Rheem Manufacturing Co.
- Exhibit 173: Rheem Manufacturing Co. - Overview
- Exhibit 174: Rheem Manufacturing Co. - Product / Service
- Exhibit 175: Rheem Manufacturing Co. - Key offerings
- 12.16 Robert Bosch GmbH
- Exhibit 176: Robert Bosch GmbH - Overview
- Exhibit 177: Robert Bosch GmbH - Business segments
- Exhibit 178: Robert Bosch GmbH - Key news
- Exhibit 179: Robert Bosch GmbH - Key offerings
- Exhibit 180: Robert Bosch GmbH - Segment focus
- 12.17 STIEBEL ELTRON GmbH and Co. KG
- Exhibit 181: STIEBEL ELTRON GmbH and Co. KG - Overview
- Exhibit 182: STIEBEL ELTRON GmbH and Co. KG - Product / Service
- Exhibit 183: STIEBEL ELTRON GmbH and Co. KG - Key offerings
13 Appendix
- 13.2 Inclusions and exclusions checklist
- Exhibit 184: Inclusions checklist
- Exhibit 185: Exclusions checklist
- 13.3 Currency conversion rates for US$
- Exhibit 186: Currency conversion rates for US$
- 13.4 Research methodology
- Exhibit 187: Research methodology
- Exhibit 188: Validation techniques employed for market sizing
- Exhibit 189: Information sources
- 13.5 List of abbreviations
- Exhibit 190: List of abbreviations