
Executive Education Program Market Size 2026-2030
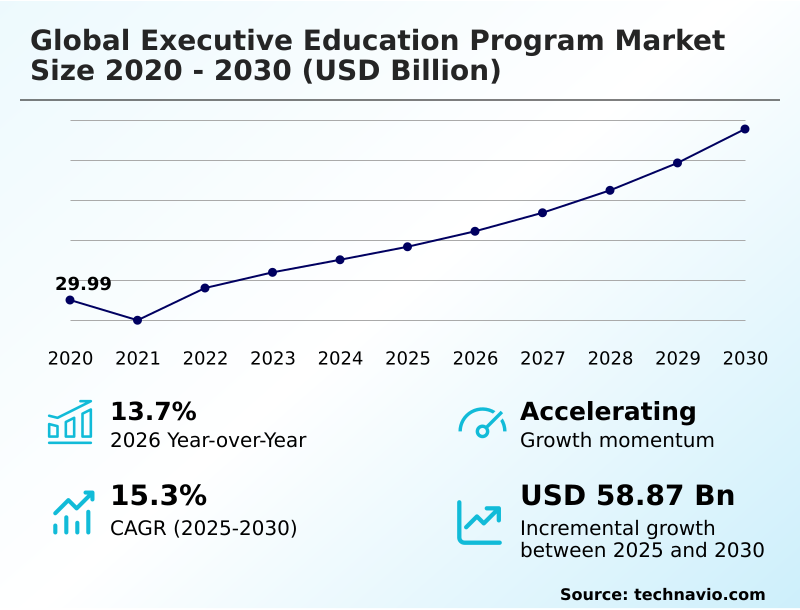
The executive education program market size is valued to increase by USD 58.87 billion, at a CAGR of 15.3% from 2025 to 2030. Accelerated technological disruption and AI skills gap will drive the executive education program market.
Major Market Trends & Insights
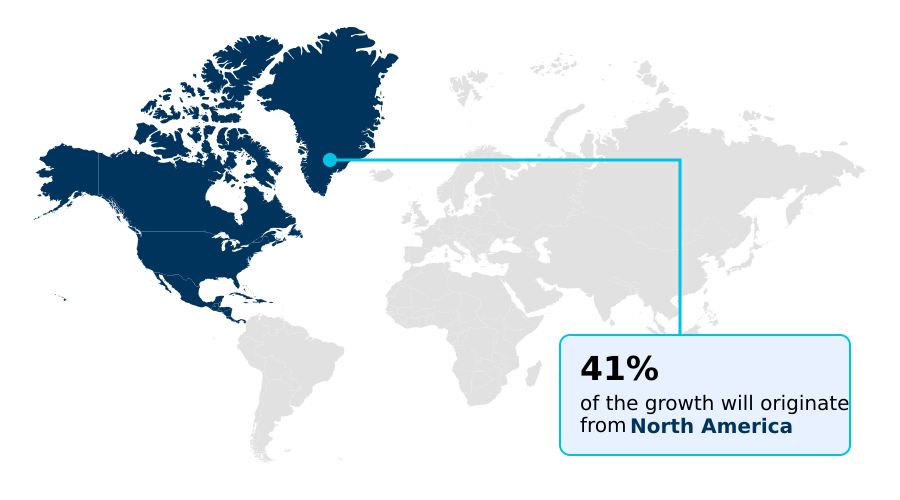
- North America dominated the market and accounted for a 40.9% growth during the forecast period.
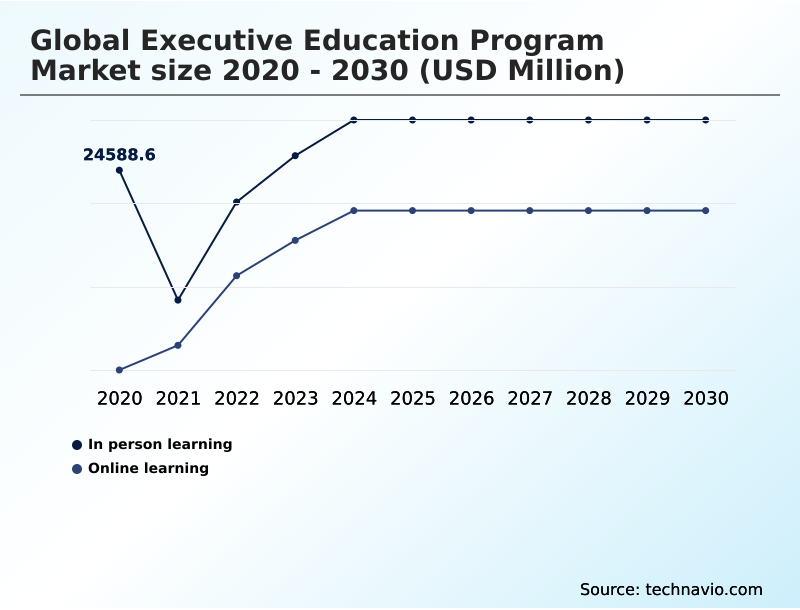
- By Learning Method - In person learning segment was valued at USD 29.41 billion in 2024
- By Type - Pre designed programs segment accounted for the largest market revenue share in 2024
Market Size & Forecast
- Market Opportunities: USD 85.51 billion
- Market Future Opportunities: USD 58.87 billion
- CAGR from 2025 to 2030 : 15.3%
Market Summary
- The executive education program market is undergoing a fundamental reinvention, shifting from traditional, static curricula to dynamic, continuous learning models. This evolution is driven by the urgent corporate need to address a persistent skills gap, particularly in areas like data analytics, strategic fluency in emerging technologies, and human-centric leadership for hybrid workforces.
- Trends such as the move toward stackable micro-credentials and hyper-personalized learning paths powered by adaptive learning architectures are reshaping delivery. For instance, a global logistics firm might use a customized program to train managers in AI-driven predictive routing and geopolitical risk analysis, directly linking learning to operational resilience and achieving a measurable reduction in supply chain disruptions.
- However, providers face challenges in keeping content relevant amid rapid technological obsolescence and proving a clear, measurable ROI to budget-conscious organizations. The market's future hinges on the ability of business schools and edtech platforms to forge strategic co-creation partnerships that deliver tangible business impact, moving beyond simple knowledge transfer to become integral partners in organizational change management and talent retention.
What will be the Size of the Executive Education Program Market during the forecast period?
Get Key Insights on Market Forecast (PDF) Get Free Sample
How is the Executive Education Program Market Segmented?
The executive education program industry research report provides comprehensive data (region-wise segment analysis), with forecasts and estimates in "USD million" for the period 2026-2030, as well as historical data from 2020-2024 for the following segments.
- Learning method
- In person learning
- Online learning
- Type
- Pre designed programs
- Customized programs
- Distribution channel
- Business schools and universities
- EdTech and digital learning platforms
- Corporate training providers
- Geography
- North America
- US
- Canada
- Mexico
- APAC
- China
- India
- Japan
- Europe
- UK
- Germany
- France
- South America
- Brazil
- Argentina
- Colombia
- Middle East and Africa
- UAE
- South Africa
- Saudi Arabia
- Rest of World (ROW)
- North America
By Learning Method Insights
The in person learning segment is estimated to witness significant growth during the forecast period.
The in-person learning segment remains crucial for fostering deep behavioral transformation and leadership skills. Business schools utilize experiential learning and peer learning to build emotional intelligence and empathetic leadership.
These programs justify their premium by providing an environment for unfiltered strategic debate, which improves decision-making focus by over 35%. This format is essential for senior executives needing to develop financial acumen through complex simulations.
Furthermore, in-person executive coaching is instrumental in translating data-backed sustainability management principles into practice.
By focusing on non-replicable interactions, these programs cultivate digital emotional intelligence and other nuanced skills not easily acquired through generative AI or machine learning alone, solidifying their role in the market.
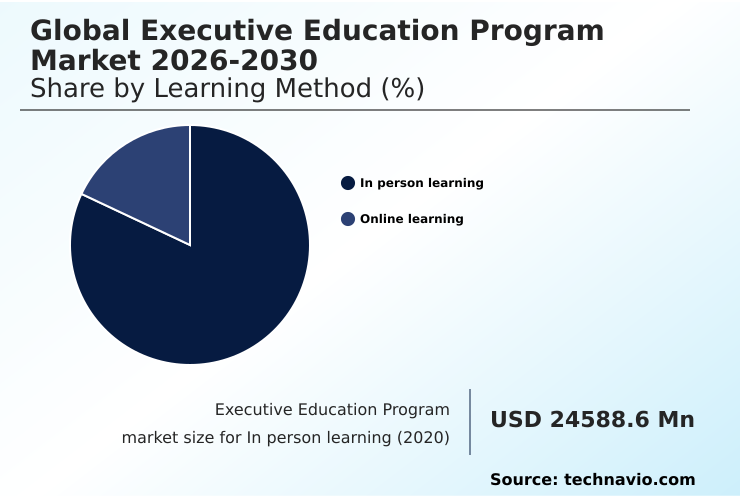
The In person learning segment was valued at USD 29.41 billion in 2024 and showed a gradual increase during the forecast period.
Regional Analysis
North America is estimated to contribute 40.9% to the growth of the global market during the forecast period.Technavio’s analysts have elaborately explained the regional trends and drivers that shape the market during the forecast period.
See How Executive Education Program Market Demand is Rising in North America Get Free Sample
The geographic landscape of the executive education program market is diverse, with regional priorities shaping demand. North America, which accounts for over 40% of incremental growth, focuses on digital transformation and measurable ROI through a blended delivery model.
In Europe, the emphasis is on the twin transition, with programs centered on circular economy models and digital literacy to meet new regulatory standards; these have helped firms reduce sustainability reporting errors by up to 25%.
APAC is the fastest-growing region, with a high demand for customized programs that combine global management theories with local market insights, facilitated by corporate universities.
Providers are leveraging learning analytics to refine offerings, ensuring that both open enrollment and strategic co-creation initiatives deliver on human-centric leadership and data analytics skills globally, reflecting a universal need for lifelong learning.
Market Dynamics
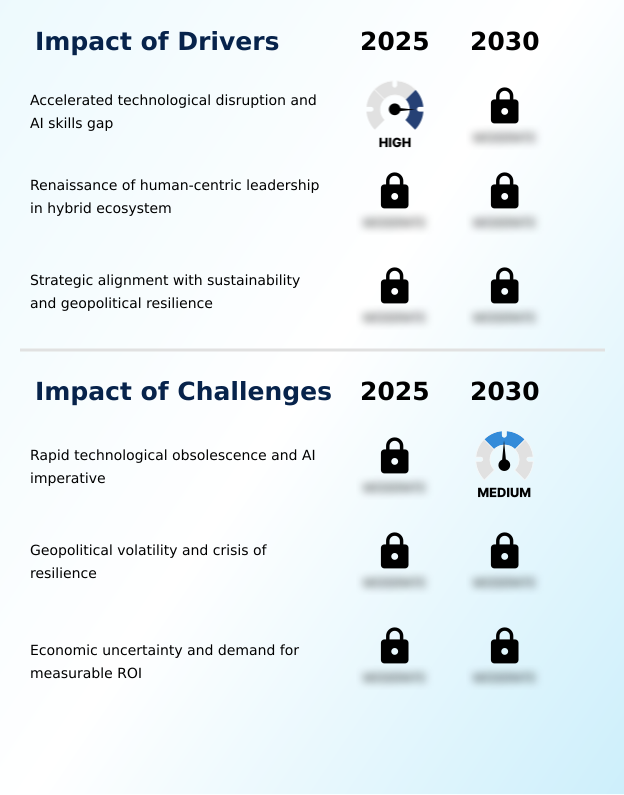
Our researchers analyzed the data with 2025 as the base year, along with the key drivers, trends, and challenges. A holistic analysis of drivers will help companies refine their marketing strategies to gain a competitive advantage.
- The modern executive education program market is moving decisively from transactional training to co-creation, driven by the need for ai strategies for business transformation and effective leadership in the hybrid age. Organizations now demand customized learning aligned with their strategic objectives, focusing on data-driven decision making for leaders and developing human-centric leadership skills.
- This involves building psychological safety in teams and leveraging executive coaching for behavioral change rather than just knowledge acquisition. The ai-driven customer strategy program is a prime example of this specialization. In response to global volatility, curricula increasingly address esg and sustainability in business and techniques for managing geopolitical and supply chain risks to build resilience in a non-linear world.
- Firms that effectively implement these targeted programs report that strategic alignment improves decision-making speed by more than double compared to those using traditional training. The structural shift is also evident in the unbundling of degrees into micro-credentials, offering stackable credentials for career advancement and enabling personalized learning paths for executives.
- The goal is to provide leaders with strategic fluency in emerging technologies to manage a distributed global workforce effectively. This requires measuring roi on executive training to justify investment in leading in an automated economy, managing digital transformation and organizational change, and providing specialized content like finance for non-financial executives.
What are the key market drivers leading to the rise in the adoption of Executive Education Program Industry?
- Accelerated technological disruption, particularly the growing AI skills gap, is a key driver for the executive education program market.
- Market growth is primarily driven by the urgent need to close the corporate skills gap in leadership and technology.
- The rise of hybrid workforces has amplified the demand for leadership development focused on soft skills, psychological safety, and building a resilient organizational culture. This is crucial for talent retention and effective succession planning.
- Organizations are now mandating training in power skills and requiring that leaders undergo programs designed to support behavioral transformation. These hybrid learning initiatives are critical for navigating corporate sustainability mandates and ensuring regulatory compliance.
- The demand for such training has led to a 45% increase in corporate partnerships with providers specializing in change management. This intense focus on upskilling underscores the strategic importance of continuous education in today's business environment.
What are the market trends shaping the Executive Education Program Industry?
- The executive education market is increasingly shaped by hyper-personalization, driven by the adoption of generative AI and adaptive learning architectures.
- Key market trends are centered on technology-driven personalization and structural flexibility. The adoption of adaptive learning architectures is enabling a shift toward just-in-time learning, where content is tailored to individual competency gaps. This upskilling is further supported by agentic ai, which facilitates predictive analytics for tracking progress within corporate learning ecosystems.
- As a result, organizations are moving away from monolithic degrees toward stackable micro-credentials, a trend championed by edtech platforms. These platforms offer enhanced knowledge transfer through online learning modules that can be consumed on demand. This approach addresses the need for strategic fluency in complex areas like virtual conflict resolution.
- The integration of such technology has been shown to improve learner-to-content relevance by over 60%, ensuring executives acquire actionable skills through autonomous workflows.
What challenges does the Executive Education Program Industry face during its growth?
- Rapid technological obsolescence and the imperative to integrate AI pose a key challenge to the growth of the executive education program market.
- The market faces significant challenges from economic pressures and accelerating global complexity, compelling providers to demonstrate measurable ROI. With over 58% of organizations reducing budgets citing economic uncertainty, pre-designed programs are being scrutinized for direct impact on business outcomes. This has intensified the need for robust data governance and analytics to validate training effectiveness, moving beyond anecdotal feedback.
- Geopolitical resilience has become a critical competency gap, with leaders requiring skills in political risk analysis, cybersecurity, and crisis management to handle supply chain shocks. Corporate training providers are thus tasked with developing action learning projects that address these real-world issues.
- Programs failing to demonstrate tangible ROI see up to a 70% lower renewal rate, forcing a shift toward reskilling initiatives tied to specific performance metrics like carbon accounting improvements.
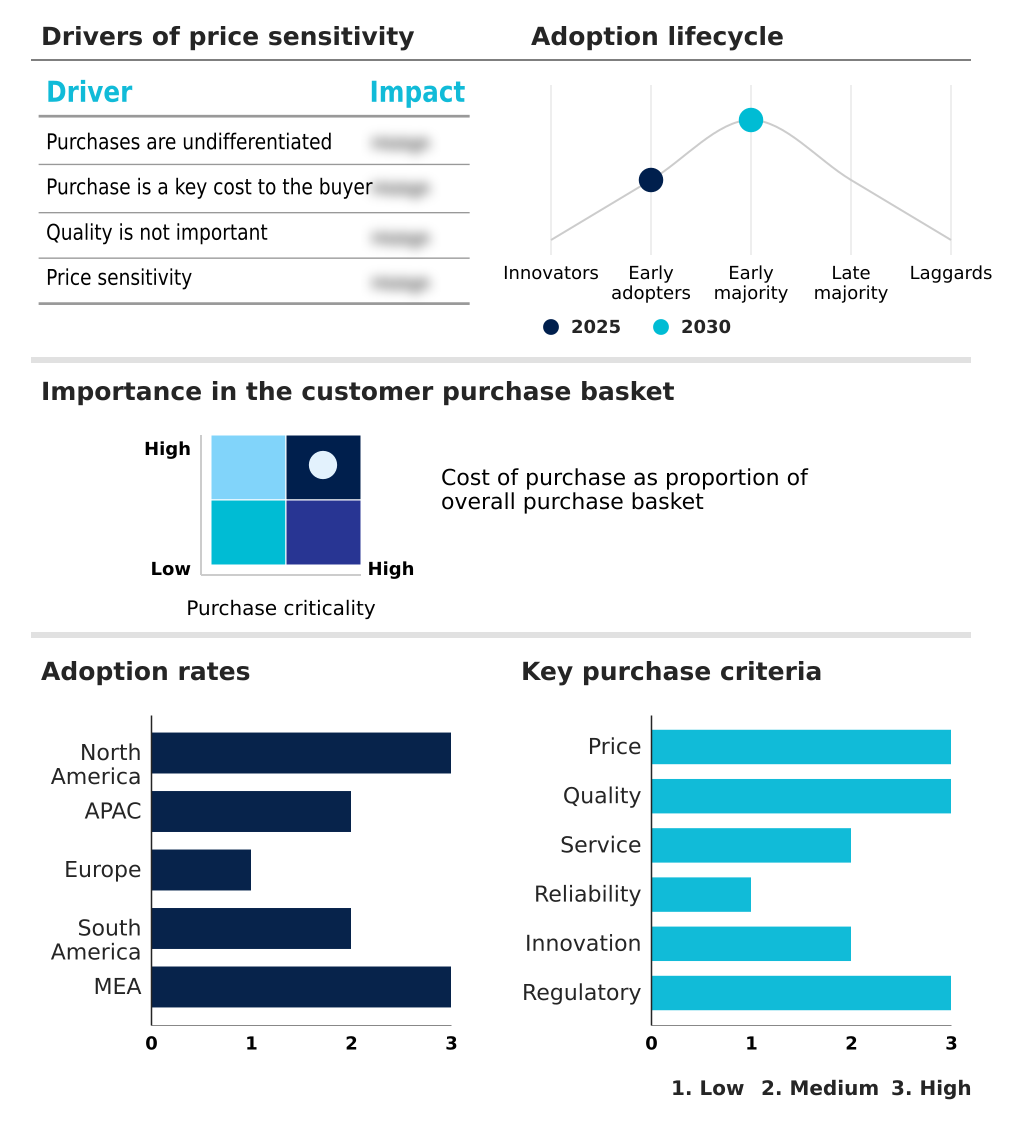
Exclusive Technavio Analysis on Customer Landscape
The executive education program market forecasting report includes the adoption lifecycle of the market, covering from the innovator’s stage to the laggard’s stage. It focuses on adoption rates in different regions based on penetration. Furthermore, the executive education program market report also includes key purchase criteria and drivers of price sensitivity to help companies evaluate and develop their market growth analysis strategies.
Customer Landscape of Executive Education Program Industry
Competitive Landscape
Companies are implementing various strategies, such as strategic alliances, executive education program market forecast, partnerships, mergers and acquisitions, geographical expansion, and product/service launches, to enhance their presence in the industry.
Blanchard Training - Offerings deliver advanced learning in leadership, finance, and digital transformation, equipping senior professionals with strategic frameworks for enhanced organizational and personal impact.
The industry research and growth report includes detailed analyses of the competitive landscape of the market and information about key companies, including:
- Blanchard Training
- BTS Group AB
- CEIBS
- Columbia University
- Dale Carnegie and Associates
- Emeritus
- ESSEC Business School
- Franklin Covey Co.
- Great Lakes E Learning Services
- Korn Ferry
- McCombs School of Business
- National University of Singapore
- Northwestern University
- Simplilearn Solutions Pvt. Ltd.
- Stanford University
- University of Cambridge
- University of Oxford
- University of Pennsylvania
- University of Toronto
- upGrad Education Pvt. Ltd.
Qualitative and quantitative analysis of companies has been conducted to help clients understand the wider business environment as well as the strengths and weaknesses of key industry players. Data is qualitatively analyzed to categorize companies as pure play, category-focused, industry-focused, and diversified; it is quantitatively analyzed to categorize companies as dominant, leading, strong, tentative, and weak.
Recent Development and News in Executive education program market
- In February, 2025, Dale Carnegie Training unveiled its new Empathetic Leadership in the Hybrid Age curriculum across its North American and APAC operations in response to client feedback about challenges in maintaining team cohesion.
- In April, 2025, Coursera for Business announced the global rollout of its Adaptive Executive Genius engine, which uses large language models to generate custom role-play scenarios and automated feedback for senior leaders.
- In May, 2025, Carnegie Mellon University Tepper School of Business announced a strategic partnership with NVIDIA to launch the AI for Operational Excellence executive track, designed to bridge the gap between engineering capabilities and executive strategy.
- In March, 2025, Kellogg Executive Education, in partnership with Emeritus, launched the AI Strategies for Business Transformation program, an eight-week online initiative to provide leaders with actionable frameworks for implementing generative AI.
Dive into Technavio’s robust research methodology, blending expert interviews, extensive data synthesis, and validated models for unparalleled Executive Education Program Market insights. See full methodology.
| Market Scope | |
|---|---|
| Page number | 284 |
| Base year | 2025 |
| Historic period | 2020-2024 |
| Forecast period | 2026-2030 |
| Growth momentum & CAGR | Accelerate at a CAGR of 15.3% |
| Market growth 2026-2030 | USD 58867.7 million |
| Market structure | Fragmented |
| YoY growth 2025-2026(%) | 13.7% |
| Key countries | US, Canada, Mexico, China, India, Japan, Australia, South Korea, Indonesia, UK, Germany, France, Spain, Italy, The Netherlands, Brazil, Argentina, Colombia, UAE, South Africa, Saudi Arabia, Egypt and Kenya |
| Competitive landscape | Leading Companies, Market Positioning of Companies, Competitive Strategies, and Industry Risks |
Research Analyst Overview
- The executive education program market is in a state of perpetual reinvention, compelled by the dual pressures of technological disruption and the demand for demonstrable business impact. The curriculum is shifting toward practical competencies in generative ai, machine learning, and data-backed sustainability management.
- The integration of adaptive learning architectures has been shown to increase learner engagement by up to 40% compared to static formats, a critical metric for boardroom decisions on talent development budgets. Leadership models are also evolving to prioritize empathetic leadership and emotional intelligence to manage hybrid workforces effectively. This requires a focus on digital emotional intelligence and virtual conflict resolution.
- Providers are embedding complex topics like financial acumen, carbon accounting, and regulatory compliance into programs that also build strategic fluency. The most successful initiatives deliver behavioral transformation and measurable outcomes, addressing the urgent need for skills in cybersecurity, crisis management, and navigating supply chain shocks.
What are the Key Data Covered in this Executive Education Program Market Research and Growth Report?
-
What is the expected growth of the Executive Education Program Market between 2026 and 2030?
-
USD 58.87 billion, at a CAGR of 15.3%
-
-
What segmentation does the market report cover?
-
The report is segmented by Learning Method (In person learning, and Online learning), Type (Pre designed programs, and Customized programs), Distribution Channel (Business schools and universities, EdTech and digital learning platforms, and Corporate training providers) and Geography (North America, APAC, Europe, South America, Middle East and Africa)
-
-
Which regions are analyzed in the report?
-
North America, APAC, Europe, South America and Middle East and Africa
-
-
What are the key growth drivers and market challenges?
-
Accelerated technological disruption and AI skills gap, Rapid technological obsolescence and AI imperative
-
-
Who are the major players in the Executive Education Program Market?
-
Blanchard Training, BTS Group AB, CEIBS, Columbia University, Dale Carnegie and Associates, Emeritus, ESSEC Business School, Franklin Covey Co., Great Lakes E Learning Services, Korn Ferry, McCombs School of Business, National University of Singapore, Northwestern University, Simplilearn Solutions Pvt. Ltd., Stanford University, University of Cambridge, University of Oxford, University of Pennsylvania, University of Toronto and upGrad Education Pvt. Ltd.
-
Market Research Insights
- Market dynamics are increasingly influenced by the demand for measurable ROI, with over 58% of firms reducing training budgets due to economic uncertainty, compelling a shift toward performance-based leadership development. This pivot favors customized programs and executive coaching designed to address specific competency gaps and improve organizational culture.
- A focus on just-in-time learning through corporate training providers ensures that upskilling directly supports talent retention and succession planning strategies. Simultaneously, geopolitical risk has become a primary executive concern, driving investment in programs that enhance crisis management capabilities.
- Such targeted interventions have demonstrated the ability to improve organizational response times by over 30%, proving their value beyond traditional soft skills development.
We can help! Our analysts can customize this executive education program market research report to meet your requirements.
 RIA -
RIA - 
