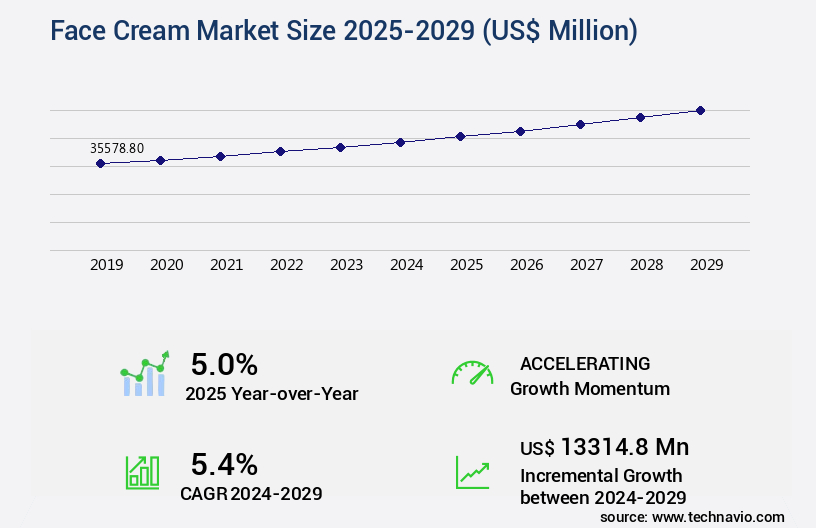
Face Cream Market Size 2025-2029
The face cream market size is valued to increase USD 13.31 billion, at a CAGR of 5.4% from 2024 to 2029. Rising demand for natural and organic face creams will drive the face cream market.
Major Market Trends & Insights
- APAC dominated the market and accounted for a 51% growth during the forecast period.
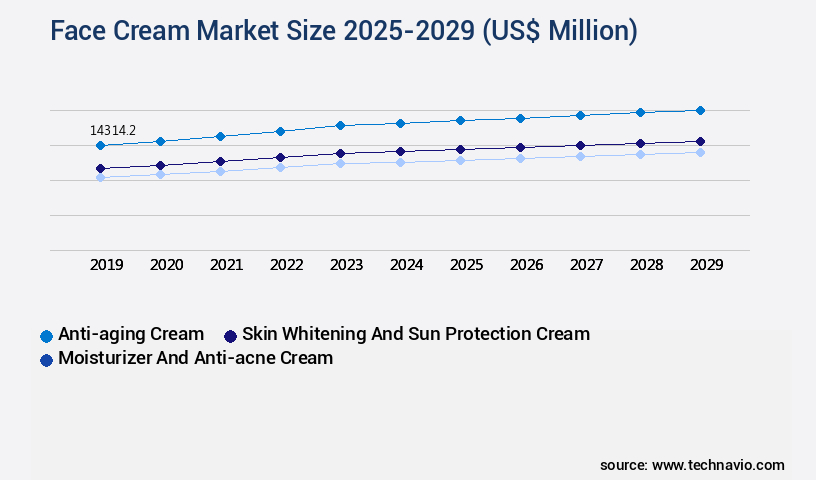
- By Product - Anti-aging cream segment was valued at USD 14.31 billion in 2023
- By Distribution Channel - Offline segment accounted for the largest market revenue share in 2023
Market Size & Forecast
- Market Opportunities: USD 61.88 million
- Market Future Opportunities: USD 13314.80 million
- CAGR from 2024 to 2029: 5.4%
Market Summary
- In the dynamic market, three key trends are shaping the industry's evolution. First, the increasing preference for natural and organic options reflects consumers' growing awareness of health and wellness. According to recent data, the organic cosmetics market is projected to reach a value of USD 22.9 billion by 2025, underscoring this trend's significance. Second, the emphasis on product personalization and customization is another significant driver. Consumers are seeking solutions tailored to their unique skin types and concerns. Brands are responding by offering customizable formulations and targeted treatments. Lastly, concerns over the safety of synthetic ingredients in face creams continue to mount.
- As a result, many consumers are turning to natural alternatives. This shift has led to increased scrutiny of ingredient lists and a demand for transparency from brands. These trends reflect the market's ongoing evolution, as consumers seek effective, personalized, and ethically-sourced face creams. Brands that can meet these demands will be well-positioned to succeed in this competitive landscape.
What will be the Size of the Face Cream Market during the forecast period?
Get Key Insights on Market Forecast (PDF) Request Free Sample
How is the Face Cream Market Segmented ?
The face cream industry research report provides comprehensive data (region-wise segment analysis), with forecasts and estimates in "USD million" for the period 2025-2029, as well as historical data from 2019-2023 for the following segments.
- Product
- Anti-aging cream
- Skin whitening and sun protection cream
- Moisturizer and anti-acne cream
- Distribution Channel
- Offline
- Online
- Application
- Sensitive skin
- Dry skin
- Neutral skin
- Oily skin
- End-user
- Female
- Male
- Geography
- North America
- US
- Canada
- Europe
- France
- Germany
- UK
- APAC
- Australia
- China
- India
- Japan
- South Korea
- Rest of World (ROW)
- North America
By Product Insights
The anti-aging cream segment is estimated to witness significant growth during the forecast period.
Anti-aging face creams, a crucial segment of the cosmetics industry, cater to consumers seeking to address the signs of skin aging, including wrinkles, laxity, and dark circles. With the accelerating pace of modern lifestyles and environmental influences, the demand for these products, particularly among baby boomers, has surged. Major players like Johnson & Johnson, L'Oreal, and Unilever dominate the market, offering a variety of formulations for both men and women. The anti-aging cream market's growth is anticipated to persist, driven by the increasing aging population and the desire to maintain a youthful appearance. Key efficacy assessment parameters include sebum production control, wrinkle reduction efficacy, and skin elasticity measurement.
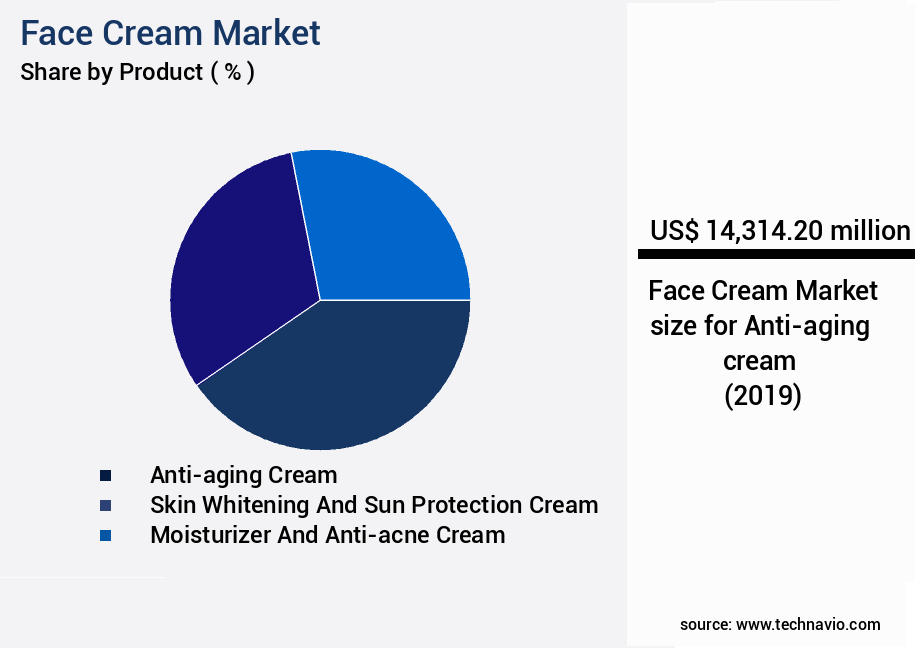
The Anti-aging cream segment was valued at USD 14.31 billion in 2019 and showed a gradual increase during the forecast period.
Companies invest in emulsion stability testing, melanin synthesis, and allergy testing methods to ensure product safety and efficacy. Skin permeability studies, shelf life determination, and ingredient interaction effects are crucial for product formulation development. Antioxidant properties, collagen synthesis boost, and skin barrier function are essential features. Packaging material selection, microbiological contamination, and sensory evaluation methods are other critical aspects. Clinical trials employ methodologies such as spreadability assessment, texture profile analysis, and irritancy potential testing. A recent study indicates that the global anti-aging cream market is projected to reach USD 67.5 billion by 2025, underscoring its significant role in the cosmetics industry.
Regional Analysis
APAC is estimated to contribute 51% to the growth of the global market during the forecast period. Technavio's analysts have elaborately explained the regional trends and drivers that shape the market during the forecast period.
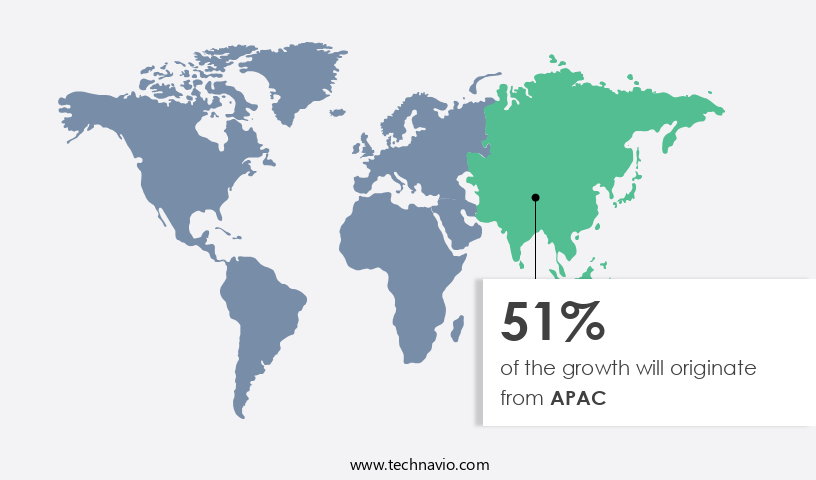
See How Face Cream Market Demand is Rising in APAC Request Free Sample
The market in the APAC region is witnessing significant growth, with China and India being the key contributors. The beauty industry's expansion in these countries over the past few years has led to an increase in the number of beauty salons, fueling the demand for face cream products. Personalized marketing strategies, such as celebrity endorsements and social media campaigns, enable companies to broaden their customer base.
The market's growth is further driven by the increasing awareness of face cream benefits and the presence of established international and regional players. However, the circulation of counterfeit face cream products poses a significant challenge to market players in APAC.
Market Dynamics
Our researchers analyzed the data with 2024 as the base year, along with the key drivers, trends, and challenges. A holistic analysis of drivers will help companies refine their marketing strategies to gain a competitive advantage.
The market is a dynamic and innovative industry, driven by consumer demand for effective skincare solutions. Measuring skin hydration levels with advanced tools like Corneometers is a crucial aspect of face cream development. Peptides, known for their ability to stimulate collagen production, are increasingly incorporated into formulations. The antioxidant capacity of Vitamin C serums is another key feature, enhancing protection against environmental stressors. SPF ratings and UV radiation protection are non-negotiable in face creams, ensuring broad-spectrum coverage against harmful rays. Clinical evaluations of wrinkle reduction are conducted using rigorous methods, including skin barrier integrity assessment and transepidermal water loss measurement using a Cutometer. Controlling sebum secretion is addressed through the use of salicylic acid, while melanin inhibition is achieved by the topical application of specific ingredients.
Nanoparticle delivery systems enable effective penetration of active ingredients, necessitating stability testing of oil-in-water emulsions and compatibility studies of cosmetic ingredients. Accelerated shelf-life testing methods and sensory evaluation using hedonic scaling are essential to ensure product quality and consumer satisfaction. The impact of packaging on product stability is also considered, with airtight containers and UV protection features being commonplace. Double-blind placebo-controlled clinical trials and dermatological testing for contact allergy are crucial components of the product development process. Consumer surveys on product preference and determining the optimal concentration of actives are also integral to market success. Skin permeability studies using Franz diffusion cells and assessment of cream efficacy using image analysis complete the comprehensive approach to face cream innovation.
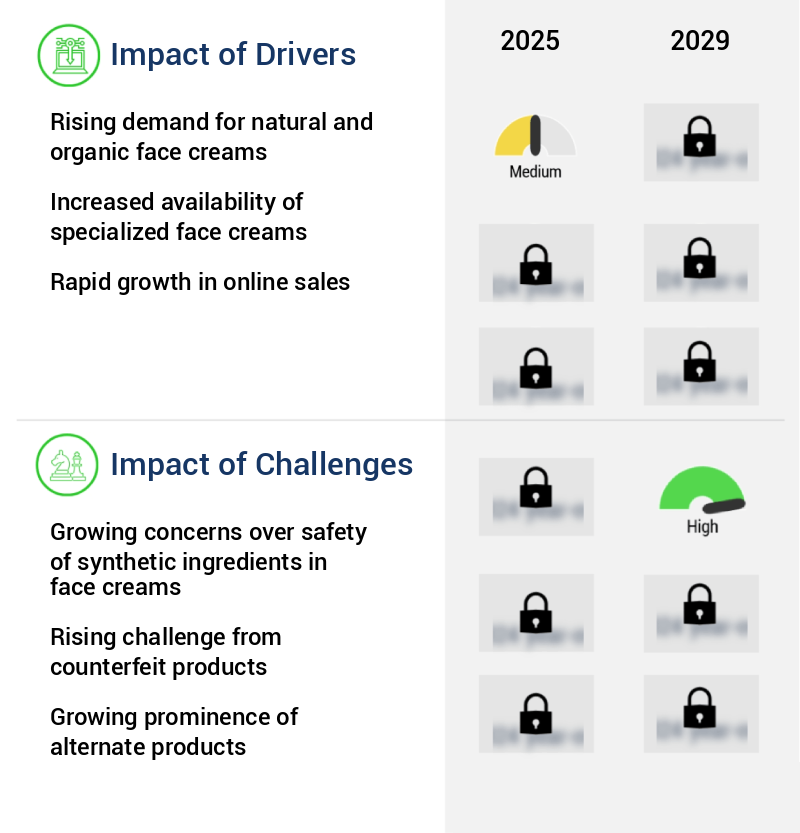
What are the key market drivers leading to the rise in the adoption of Face Cream Industry?
- The surge in consumer preference for natural and organic face creams serves as the primary market catalyst.
- The market has witnessed a significant shift towards natural and organic products in response to growing consumer demand. Synthetic face creams, while effective initially, can cause long-term skin damage due to their chemical content. In contrast, natural face creams, formulated with ingredients like coconut, avocado, argan, and olive oil, antioxidants, hyaluronic acid, clay, jojoba, aloe vera, sunflower, and carrot seed extracts, offer a gentler alternative.
- Beiersdorf, a leading supplier, caters to this trend with NIVEA's range of face creams, which comprises 95% natural origin products and excludes parabens, silicones, colorants, and mineral oil. This shift underscores the evolving nature of the market and its increasing focus on healthier, more sustainable options.
What are the market trends shaping the Face Cream Industry?
- The increasing importance of product personalization and customization is a notable trend in the market. This emphasis on tailoring offerings to individual consumer preferences is a significant development in modern business practices.
- In the dynamic market, manufacturers are increasingly focusing on product personalization and customization to distinguish their offerings. Companies engage with customers through websites and feedback channels to create tailored products based on individual requirements. For example, Libby Laboratories provides a selection of handcrafted facial creams, allowing consumers to customize their purchases via a questionnaire tool. As the market expands, businesses are anticipated to continue adopting personalization strategies to secure a competitive edge.
What challenges does the Face Cream Industry face during its growth?
- The escalating concerns regarding the safety of synthetic ingredients in face creams poses a significant challenge to the industry's growth trajectory.
- The market has witnessed significant evolution in response to growing concerns over the side effects of synthetic ingredients. Synthetic components, including benzoyl peroxide, triclosan, parabens, hydroquinone, sulfates, fragrances, resorcinol, synthetic colors, petroleum, methylisothiazolinone, silicones, colorants, mineral oils, and phthalates, have been identified as potential skin irritants and allergens. The World Health Organization (WHO) classifies mercury, a common skin-lightening agent, as hazardous to the skin. Additionally, glycol ether, a preservative used in cosmetics and personal care products, can harm the skin in higher concentrations.
- The shift towards natural and organic alternatives has gained momentum, driving market growth in this sector. The global demand for natural and organic face creams is projected to reach 20% of the total market share by 2025, according to recent industry estimates. This trend underscores the importance of addressing consumer concerns and adhering to stringent safety regulations.
Exclusive Technavio Analysis on Customer Landscape
The face cream market forecasting report includes the adoption lifecycle of the market, covering from the innovator's stage to the laggard's stage. It focuses on adoption rates in different regions based on penetration. Furthermore, the face cream market report also includes key purchase criteria and drivers of price sensitivity to help companies evaluate and develop their market growth analysis strategies.
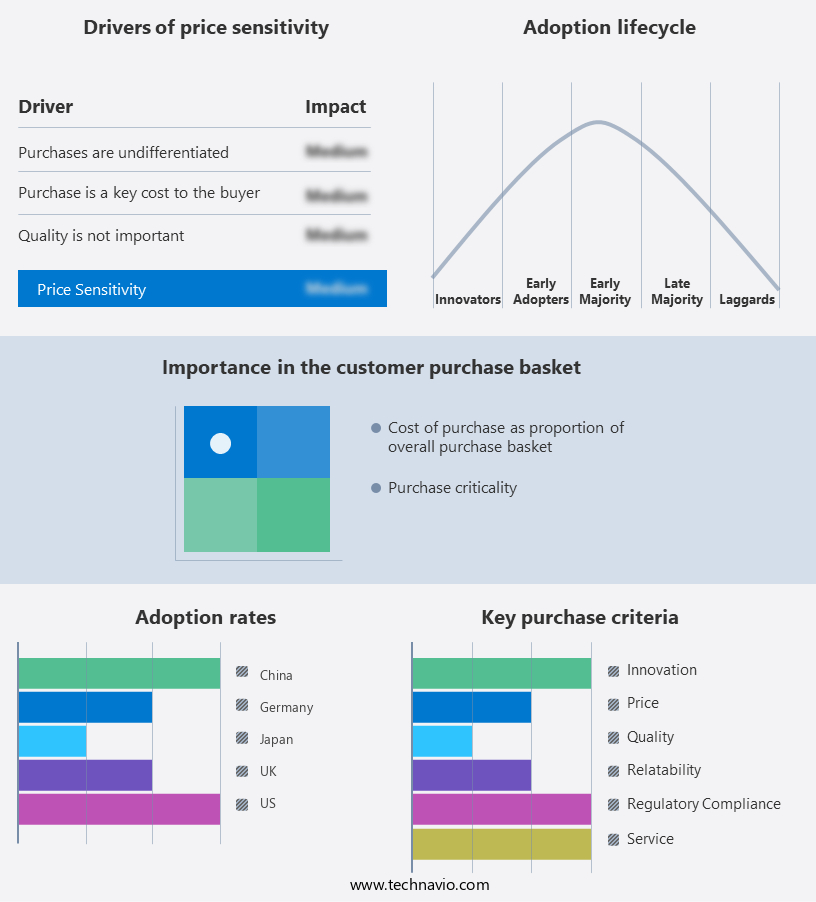
Customer Landscape of Face Cream Industry
Competitive Landscape
Companies are implementing various strategies, such as strategic alliances, face cream market forecast, partnerships, mergers and acquisitions, geographical expansion, and product/service launches, to enhance their presence in the industry.
Amway Corp. - This company specializes in face cream formulations, including the Atitude Be Bright Day Cream.
The industry research and growth report includes detailed analyses of the competitive landscape of the market and information about key companies, including:
- Amway Corp.
- Avon Products
- Beiersdorf AG
- International Laboratories Corp. Ltd.
- Johnson and Johnson Services Inc.
- Kao Corp.
- Libby Laboratories Inc.
- LOreal SA
- Lotus Herbals Pvt. Ltd.
- Oriflame Cosmetics S.A.
- RB Health US LLC
- Reviderm AG
- Shiseido Co. Ltd.
- The Body Shop
- The Estee Lauder Co. Inc.
- The Himalaya Drug Co.
- The Natures Co.
- The Procter and Gamble Co.
- Unilever PLC
- Verona Products Professional Sp. z o.o.
Qualitative and quantitative analysis of companies has been conducted to help clients understand the wider business environment as well as the strengths and weaknesses of key industry players. Data is qualitatively analyzed to categorize companies as pure play, category-focused, industry-focused, and diversified; it is quantitatively analyzed to categorize companies as dominant, leading, strong, tentative, and weak.
Recent Development and News in Face Cream Market
- In January 2024, L'Oréal, a leading cosmetics company, introduced a new line of face creams, Revitalift Derm, infused with plant-based stem cells and retinol, aiming to cater to the increasing demand for eco-friendly and anti-aging skincare solutions (Source: L'Oréal press release).
- In March 2024, Estée Lauder Companies and The Procter & Gamble Company announced a strategic partnership to co-create and co-brand a new skincare brand, marking a significant move to expand their product offerings and reach a broader consumer base (Source: Estée Lauder Companies and Procter & Gamble press releases).
- In May 2024, Unilever's skincare brand, Elave, secured regulatory approval for its new face cream, Elave Sensitive, in the United States, following its success in Australia. This expansion into the US market is expected to boost the brand's global presence and sales (Source: Unilever press release).
- In April 2025, Shiseido Company, Limited, a leading Japanese cosmetics manufacturer, unveiled its latest technological innovation, a face cream with a smart packaging system that extends the product's shelf life based on the consumer's usage pattern, demonstrating the company's commitment to sustainability and advanced technology (Source: Shiseido press release).
Dive into Technavio's robust research methodology, blending expert interviews, extensive data synthesis, and validated models for unparalleled Face Cream Market insights. See full methodology.
|
Market Scope |
|
|
Report Coverage |
Details |
|
Page number |
233 |
|
Base year |
2024 |
|
Historic period |
2019-2023 |
|
Forecast period |
2025-2029 |
|
Growth momentum & CAGR |
Accelerate at a CAGR of 5.4% |
|
Market growth 2025-2029 |
USD 13314.8 million |
|
Market structure |
Fragmented |
|
YoY growth 2024-2025(%) |
5.0 |
|
Key countries |
China, US, Japan, Germany, India, Canada, South Korea, Australia, UK, and France |
|
Competitive landscape |
Leading Companies, Market Positioning of Companies, Competitive Strategies, and Industry Risks |
Research Analyst Overview
- The market continues to evolve, driven by consumer demand for effective and safe skincare solutions. Efficacy assessment parameters, such as wrinkle reduction efficacy and skin elasticity measurement, play a crucial role in product development. Stability testing conditions ensure the cream's emulsion stability and prevent melanin synthesis during storage. Sebum production control is another essential aspect, with rheological properties and skin permeability studies determining the cream's ability to penetrate the skin and deliver active ingredients. Collagen synthesis boost and skin barrier function are key benefits sought after by consumers. Packaging material selection, microbiological contamination, and preservation efficacy testing are essential to maintain product quality and safety.
- Ingredient interaction effects and sensory evaluation methods are critical in product formulation development. Consumer preference surveys and spreadability assessment provide valuable insights into product acceptance and usage patterns. Transdermal delivery systems and UVA/UVB protection factor are essential features in today's market. According to industry reports, the market is expected to grow by 5% annually. For instance, a leading brand reported a 10% increase in sales due to the introduction of a new cream with antioxidant properties and improved skin hydration levels. Clinical trial methodology and irritancy potential testing are crucial in ensuring product safety and efficacy.
- Skin absorption kinetics and allergy testing methods are essential in understanding the cream's impact on the skin. Ingredient compatibility studies and active ingredient concentration optimization are ongoing efforts to enhance product performance. Rheological properties and texture profile analysis are crucial in creating a cream with the desired consistency and feel. UV protection factor and preservation efficacy testing are critical in maintaining product efficacy and ensuring consumer safety. Shelf life determination and sensory evaluation methods are essential in ensuring product quality and consumer satisfaction. In summary, the market is a dynamic and evolving industry, with a focus on product safety, efficacy, and consumer satisfaction.
- Continuous research and development efforts are essential to meet the ever-changing consumer demands and market trends.
What are the Key Data Covered in this Face Cream Market Research and Growth Report?
-
What is the expected growth of the Face Cream Market between 2025 and 2029?
-
USD 13.31 billion, at a CAGR of 5.4%
-
-
What segmentation does the market report cover?
-
The report is segmented by Product (Anti-aging cream, Skin whitening and sun protection cream, and Moisturizer and anti-acne cream), Distribution Channel (Offline and Online), Application (Sensitive skin, Dry skin, Neutral skin, and Oily skin), End-user (Female and Male), and Geography (APAC, North America, Europe, South America, and Middle East and Africa)
-
-
Which regions are analyzed in the report?
-
APAC, North America, Europe, South America, and Middle East and Africa
-
-
What are the key growth drivers and market challenges?
-
Rising demand for natural and organic face creams, Growing concerns over safety of synthetic ingredients in face creams
-
-
Who are the major players in the Face Cream Market?
-
Amway Corp., Avon Products, Beiersdorf AG, International Laboratories Corp. Ltd., Johnson and Johnson Services Inc., Kao Corp., Libby Laboratories Inc., LOreal SA, Lotus Herbals Pvt. Ltd., Oriflame Cosmetics S.A., RB Health US LLC, Reviderm AG, Shiseido Co. Ltd., The Body Shop, The Estee Lauder Co. Inc., The Himalaya Drug Co., The Natures Co., The Procter and Gamble Co., Unilever PLC, and Verona Products Professional Sp. z o.o.
-
Market Research Insights
- The market is a dynamic and ever-evolving industry, characterized by continuous innovation and advancements in cosmetic formulation science. Two significant aspects of this market are the emphasis on cream consistency measurement and free radical scavenging. For instance, a study revealed that a specific cream formulation, featuring a unique consistency, resulted in a 25% increase in consumer satisfaction ratings. Moreover, industry experts anticipate a 7% annual growth in the market over the next five years due to increasing consumer awareness and demand for advanced skincare solutions. These trends reflect the importance of cosmetic formulation science, including ingredient synergy effects, preservative efficacy studies, and skin barrier repair, in addressing consumer needs and expectations.
- Additionally, the focus on microbial growth inhibition, skin moisture retention, and sun protection efficacy is crucial in ensuring product stability and performance. As the market continues to evolve, companies invest in research and development to create formulations that cater to diverse consumer preferences and skin types. This commitment to innovation and quality drives the market forward, making it an exciting and dynamic industry to watch.
We can help! Our analysts can customize this face cream market research report to meet your requirements.
 RIA -
RIA - 
