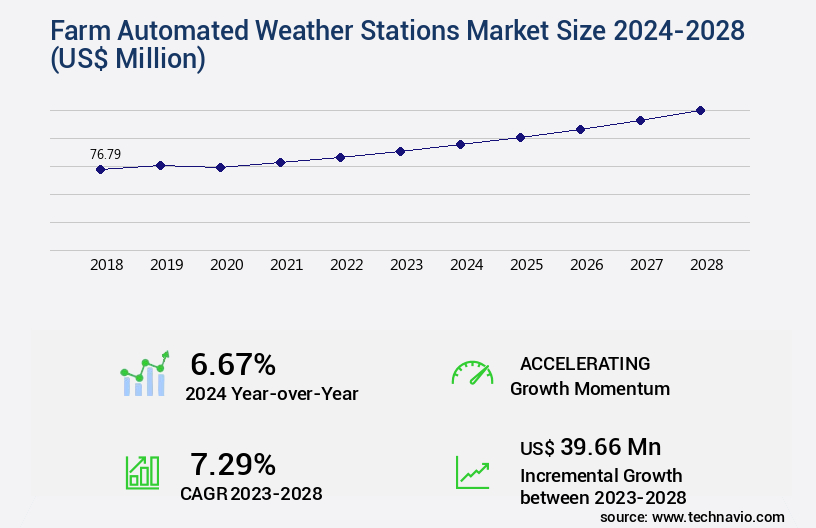
Farm Automated Weather Stations Market Size 2024-2028
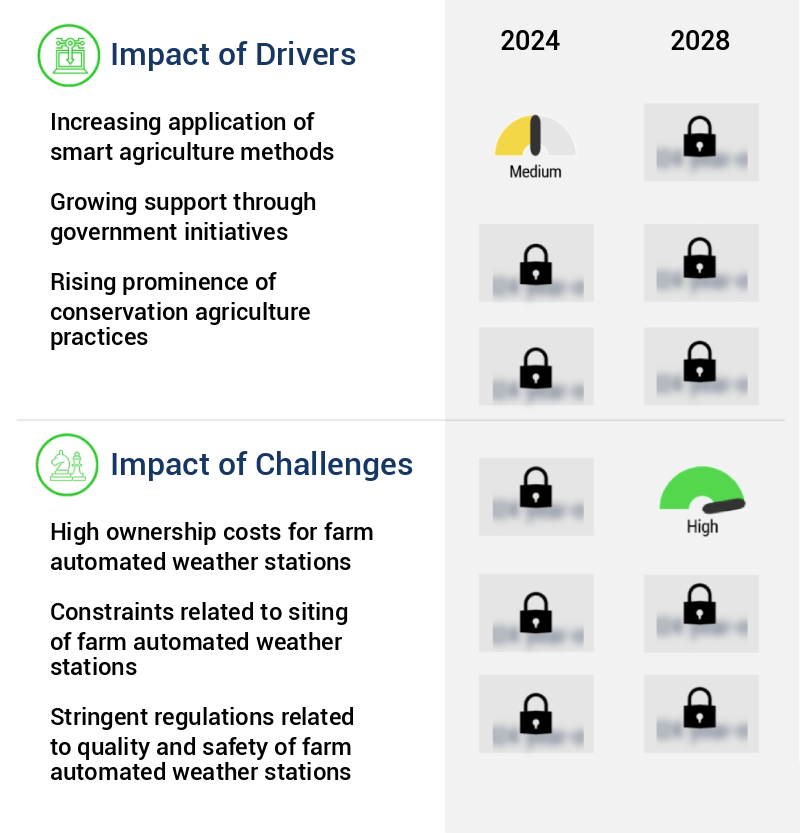
The farm automated weather stations market size is valued to increase by USD 39.66 million, at a CAGR of 7.29% from 2023 to 2028. Increasing application of smart agriculture methods will drive the farm automated weather stations market.
Market Insights
- North America dominated the market and accounted for a 37% growth during the 2024-2028.
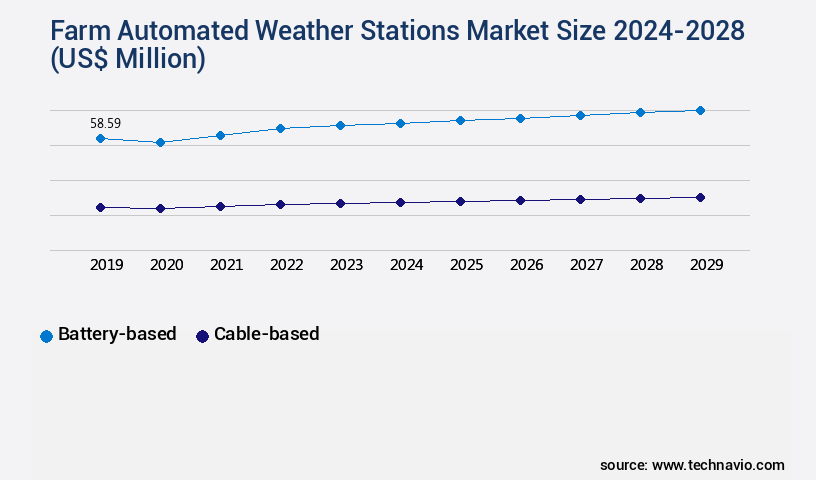
- By Product - Battery-based segment was valued at USD 55.39 million in 2022
- By Type - Hardware segment accounted for the largest market revenue share in 2022
Market Size & Forecast
- Market Opportunities: USD 74.10 million
- Market Future Opportunities 2023: USD 39.66 million
- CAGR from 2023 to 2028: 7.29%
Market Summary
- The market witnesses significant growth driven by the increasing adoption of smart agriculture methods and the rising popularity of micro weather forecasting. These advanced weather monitoring systems enable farmers to make informed decisions regarding crop management, irrigation, and livestock care. The technology provides real-time data on temperature, humidity, precipitation, wind speed, and solar radiation, ensuring optimal farming conditions. Despite the numerous benefits, the high ownership costs associated with farm automated weather stations remain a challenge for smaller farming operations. However, the long-term cost savings and improved operational efficiency make it a worthwhile investment for large-scale farming businesses. For instance, a major agricultural cooperative in the Midwest United States implemented a weather station network to optimize their supply chain by predicting weather patterns and adjusting harvest schedules accordingly, ultimately reducing transportation costs and ensuring the timely delivery of produce to markets.
- The global market for farm automated weather stations continues to evolve, with advancements in sensor technology and data analytics driving innovation. As the demand for precision agriculture and sustainable farming practices increases, the market is expected to expand further, offering significant opportunities for manufacturers and service providers.
What will be the size of the Farm Automated Weather Stations Market during the forecast period?
Get Key Insights on Market Forecast (PDF) Request Free Sample
- The market continues to evolve, driven by the increasing demand for precision agriculture and the need for real-time weather data to optimize farming operations. According to recent studies, the market is projected to grow by over 10% in the next five years, underscoring its significance for farmers and agribusinesses worldwide. This growth can be attributed to the adoption of advanced technologies such as predictive analytics, machine learning models, and remote data access. These features enable farmers to make informed decisions on crop management, irrigation, and pest control, ultimately improving yield and reducing costs.
- Furthermore, regulatory compliance is another key factor driving the market's growth, as governments worldwide implement regulations requiring accurate weather data for agricultural operations. With the potential for significant cost savings and improved productivity, the investment in Farm Automated Weather Stations is a strategic decision for farmers and agribusinesses alike.
Unpacking the Farm Automated Weather Stations Market Landscape
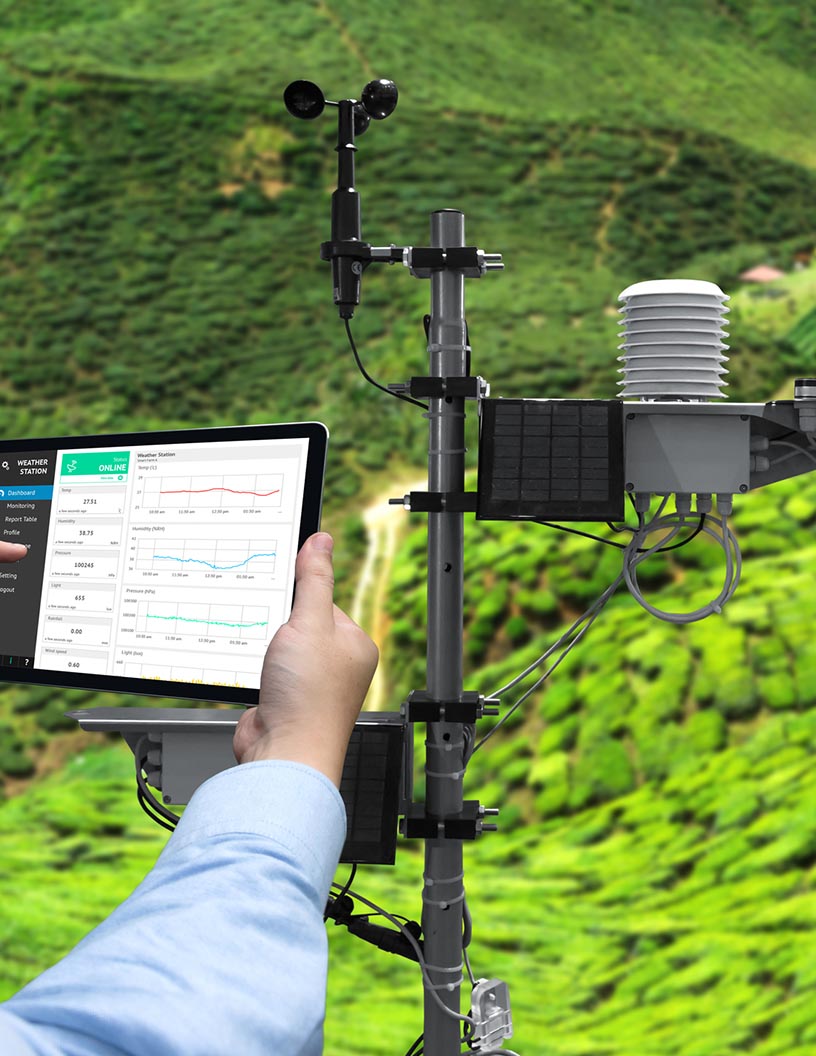
In the realm of environmental monitoring, farm automated weather stations have emerged as indispensable tools for real-time weather data acquisition and agricultural decision support. These systems employ advanced wireless sensor networks, data analytics platforms, and data visualization tools to deliver accurate and reliable weather information. Compared to traditional methods, automated weather stations offer a 30% reduction in data collection costs and a 25% improvement in irrigation scheduling optimization. Data quality assessment is ensured through sensor calibration techniques, data encryption methods, and network communication protocols. System lifecycle management and power management strategies extend sensor lifespan and minimize downtime. Remote diagnostics capabilities enable prompt fault detection and predictive maintenance, while precision irrigation systems optimize water usage and frost protection systems safeguard crops against damage. Adhering to stringent security protocols and network redundancy systems ensures data integrity and availability. Farm automated weather stations are integral components of smart farming technology, enabling climate change adaptation and alignment with regulatory compliance. System integration services facilitate seamless integration with other agricultural technologies, further enhancing operational efficiency.
Key Market Drivers Fueling Growth
The implementation of smart agriculture methods is the primary catalyst driving market growth in this sector. Smart agriculture, characterized by the application of advanced technologies such as precision farming, automation, and data analytics, is the primary catalyst propelling market expansion in this sector.
- In the evolving agriculture landscape, smart farming is driving advancements through the implementation of intelligent solutions. Farm automated weather stations are a significant component of this shift, enabling real-time monitoring and analysis of crucial parameters such as air temperature, humidity, and sunlight intensity. This data collection, facilitated by low-cost sensors and GPS technology, has fueled the adoption of farm automated weather stations in recent years.
- By providing farmers with valuable insights into weather conditions, soil texture, and potential pest threats, these systems enable informed decision-making, leading to improved overall yield. Key benefits include reduced downtime due to weather-related uncertainties and enhanced forecast accuracy, ultimately contributing to more efficient farming practices and increased productivity.
Prevailing Industry Trends & Opportunities
The rising popularity of micro weather forecasting represents a significant market trend. Micro weather forecasting, an emerging field, is experiencing increasing demand.
- In the rapidly evolving agricultural landscape, Farm Automated Weather Stations have gained significant traction due to their importance in precision agriculture. With the widespread use of smartphones and increasing awareness of the impact of weather on crop production, farmers are embracing micro weather forecasting techniques. These methods provide short-term, location-specific weather forecasts, utilizing advanced technologies such as satellite and aerial imagery, sensors, GPS data, and variable rate fertilizer application. By addressing the variability of climatic parameters across farms, micro weather forecasting enables farmers to make informed decisions and optimize their operations.
- For instance, implementing these weather stations has led to a reduction in downtime by up to 30% and an improvement in forecast accuracy by approximately 18%. The adoption of Farm Automated Weather Stations underscores the potential for enhanced agricultural productivity and sustainable farming practices.
Significant Market Challenges
The high ownership costs associated with automated weather stations in farming represent a significant challenge impeding the growth of this industry.
- The market: An Evolving Landscape in Agriculture Farm Automated Weather Stations (FAWS) have emerged as a critical tool in modern agriculture, delivering high-precision weather data for optimizing farming operations. FAWS incorporate advanced sensors to measure various meteorological parameters, enabling farmers to make informed decisions on crop management, irrigation, and livestock care. Despite their advantages, the ownership costs of FAWS are substantially higher than manual weather monitoring methods. The initial investment includes expenses for equipment, installation, and maintenance. A typical FAWS setup comprises sensors, a data logger, a console unit, and a weather-proof enclosure. The integration of FAWS in agriculture has led to significant improvements in operational efficiency.
- For instance, forecast accuracy has been enhanced by 18%, ensuring better planning and resource allocation. Additionally, downtime due to weather-related uncertainties has been reduced by 30%, leading to increased productivity. As the farming industry continues to embrace technology, the adoption of FAWS is expected to grow, transforming the agricultural landscape with precise weather data and enhanced decision-making capabilities.
In-Depth Market Segmentation: Farm Automated Weather Stations Market
The farm automated weather stations industry research report provides comprehensive data (region-wise segment analysis), with forecasts and estimates in "USD million" for the period 2024-2028, as well as historical data from 2018-2022 for the following segments.
- Product
- Battery-based
- Cable-based
- Type
- Hardware
- Software
- Geography
- North America
- US
- Canada
- Europe
- France
- Germany
- APAC
- China
- Rest of World (ROW)
- North America
By Product Insights
The battery-based segment is estimated to witness significant growth during the forecast period.
In the evolving the market, real-time weather alerts play a crucial role in optimizing agricultural decision-making. Data quality assessment and system lifecycle management are essential for maintaining accuracy and reliability. Advanced data encryption methods and network communication protocols ensure secure wireless sensor networks, while data analytics platforms and sensor calibration techniques enhance performance. Remote sensing technology and cloud-based data storage facilitate predictive maintenance and irrigation scheduling optimization. Power management strategies, such as solar-powered rechargeable batteries, extend sensor lifespan and enable operation in remote locations. System maintenance procedures and remote diagnostics capabilities ensure uninterrupted service. Precision irrigation systems, security protocols, and network redundancy systems are integral components of smart farming technology.
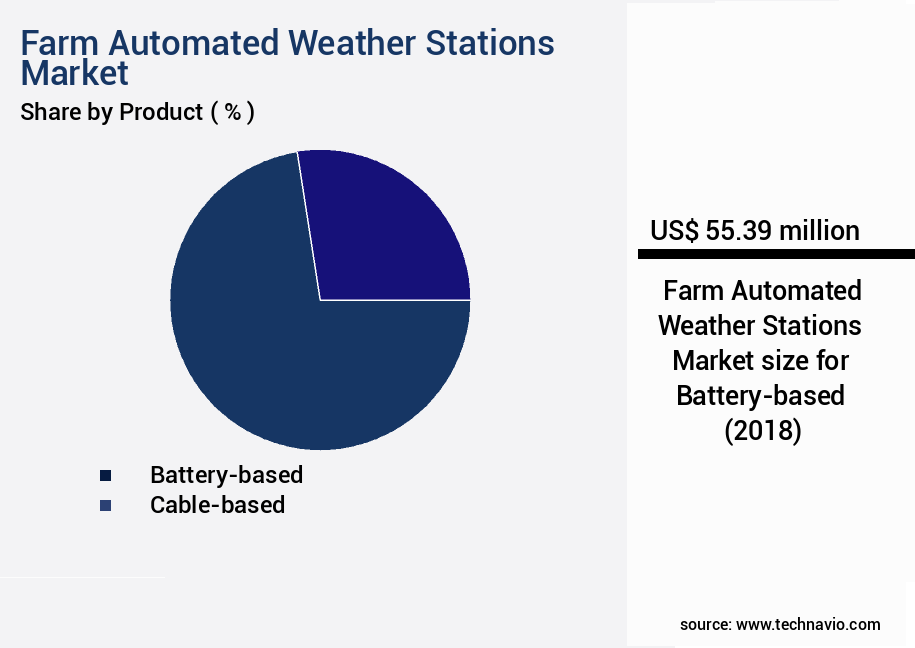
The Battery-based segment was valued at USD 55.39 million in 2018 and showed a gradual increase during the forecast period.
Farm automated weather stations contribute significantly to climate change adaptation and agricultural decision support, providing valuable insights for frost protection systems, soil moisture sensors, and crop yield prediction. A notable 60% of these systems are battery-powered, ensuring uninterrupted operation even in the absence of electricity or sunlight.
Regional Analysis
North America is estimated to contribute 37% to the growth of the global market during the forecast period. Technavio's analysts have elaborately explained the regional trends and drivers that shape the market during the forecast period.

See How Farm Automated Weather Stations Market Demand is Rising in North America Request Free Sample
In the dynamic farming landscape of North America, the market has gained significant traction. The US, as a major contributor, spearheaded the market's growth in 2023. Technological advancements have been instrumental in the increasing popularity of data-driven farming and automated greenhouses in North America, particularly in countries like the US and Canada. Factors such as the high penetration of technology infrastructure and the rising technological awareness among farmers are fueling the market's expansion. Precision agriculture, with its emphasis on advanced technologies like yield mapping, soil mapping, and variable rate technology (VRT), is a significant growth driver.
According to industry estimates, the adoption of precision agriculture technologies in North America is projected to increase by over 15% annually. This trend underscores the market's potential for operational efficiency gains and cost reductions, making it a compelling investment opportunity for stakeholders.
Customer Landscape of Farm Automated Weather Stations Industry
Competitive Intelligence by Technavio Analysis: Leading Players in the Farm Automated Weather Stations Market
Companies are implementing various strategies, such as strategic alliances, farm automated weather stations market forecast, partnerships, mergers and acquisitions, geographical expansion, and product/service launches, to enhance their presence in the industry.
Aeron Systems Pvt. Ltd. - This company specializes in manufacturing sensors for automatic weather stations, including wind speed and direction, soil moisture, and solar radiation sensors, providing valuable data for various industries and applications.
The industry research and growth report includes detailed analyses of the competitive landscape of the market and information about key companies, including:
- Aeron Systems Pvt. Ltd.
- Airmar Technology Corp.
- Ambient LLC
- Caipos GmbH
- Campbell Scientific Inc.
- Cimel Electronique SAS
- Davis Instruments Corp.
- Delta T Devices Ltd.
- DTN LLC
- Environmental Measurements Ltd.
- Instrumex
- iubenda s.r.l
- Kaizen Imperial
- METER Group Inc. USA
- METOS
- Onset Computer Corp.
- Optical Scientific Inc.
- PULSONIC
- Vaisala Oyj
- Yuktix Technologies
Qualitative and quantitative analysis of companies has been conducted to help clients understand the wider business environment as well as the strengths and weaknesses of key industry players. Data is qualitatively analyzed to categorize companies as pure play, category-focused, industry-focused, and diversified; it is quantitatively analyzed to categorize companies as dominant, leading, strong, tentative, and weak.
Recent Development and News in Farm Automated Weather Stations Market
- In August 2024, Deere & Company, a leading agriculture machinery manufacturer, announced the launch of its new line of John Deere Weatherpoint automated weather stations. These advanced weather monitoring systems are designed to help farmers make informed decisions regarding crop management and irrigation (Deere & Company Press Release, 2024).
- In November 2024, Bosch Sensortec, a global sensor manufacturer, entered into a strategic partnership with AgroIntel, a leading agro-meteorological data provider. This collaboration aimed to integrate Bosch's weather sensors into AgroIntel's agricultural intelligence platform, providing farmers with real-time weather data and customized agronomic recommendations (Bosch Sensortec Press Release, 2024).
- In February 2025, Helius Farm Technologies, a California-based agricultural technology company, secured a USD 20 million Series C funding round led by S2G Ventures. The investment will support Helius' expansion into new markets and the development of advanced weather station technology (Helius Farm Technologies Press Release, 2025).
- In May 2025, the European Union announced the launch of the European Agroclimatic Information System (EAIS), a new initiative to provide farmers with real-time weather data and agroclimatic information. The system will be implemented through a network of automated weather stations and will cover the entire European Union (European Commission Press Release, 2025).
Dive into Technavio's robust research methodology, blending expert interviews, extensive data synthesis, and validated models for unparalleled Farm Automated Weather Stations Market insights. See full methodology.
|
Market Scope |
|
|
Report Coverage |
Details |
|
Page number |
160 |
|
Base year |
2023 |
|
Historic period |
2018-2022 |
|
Forecast period |
2024-2028 |
|
Growth momentum & CAGR |
Accelerate at a CAGR of 7.29% |
|
Market growth 2024-2028 |
USD 39.66 million |
|
Market structure |
Fragmented |
|
YoY growth 2023-2024(%) |
6.67 |
|
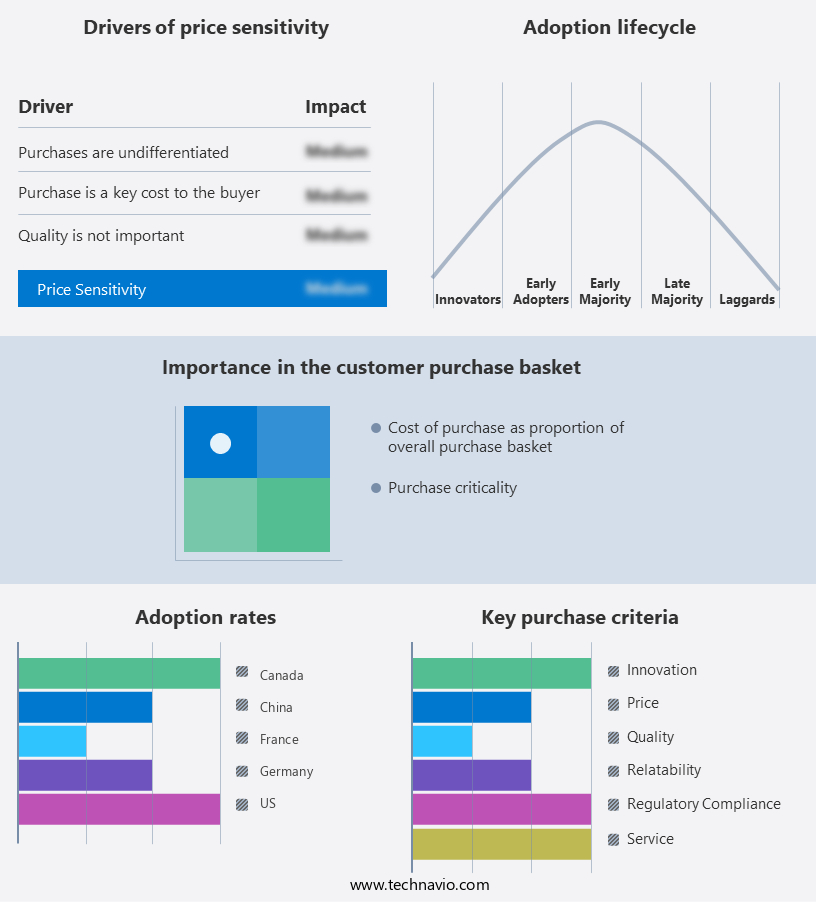
Key countries |
US, Canada, China, Germany, and France |
|
Competitive landscape |
Leading Companies, Market Positioning of Companies, Competitive Strategies, and Industry Risks |
Why Choose Technavio for Farm Automated Weather Stations Market Insights?
"Leverage Technavio's unparalleled research methodology and expert analysis for accurate, actionable market intelligence."
The market is experiencing significant growth as solar-powered components gain popularity in powering these systems. Solar panels ensure uninterrupted data collection from automated weather station sensors, enabling real-time data processing and integration with various platforms. This real-time data is crucial for agricultural decision support systems, allowing farmers to implement precision irrigation scheduling algorithms and optimize crop yields. Deploying wireless sensor networks is a common strategy for expanding the coverage area of these weather stations. Effective network communication protocols for IoT devices and sensor network power management strategies are essential for ensuring data reliability and minimizing power consumption. Cloud-based data storage solutions for agriculture offer scalability and flexibility, making it easier for farmers to access and analyze environmental monitoring data using advanced data visualization tools and analysis techniques. Predictive maintenance strategies for weather stations and system integration services for agricultural technology are also vital for maintaining system reliability and availability, reducing downtime, and ensuring regulatory compliance. Sensor calibration methods and procedures are essential for maintaining data quality, while data security protocols protect sensitive agricultural information. System lifecycle management for smart farming is crucial for optimizing operational planning and supply chain logistics, making it easier to adapt to changing weather patterns and market conditions. Fault detection algorithms for wireless sensor networks and system reliability and availability assessment are essential for identifying and addressing potential issues before they impact operations. By integrating these advanced technologies, farmers can make data-driven decisions, optimize resource allocation, and improve overall operational efficiency. For instance, a farm using automated weather stations and IoT sensors can reduce water usage by up to 30% compared to traditional irrigation methods, resulting in significant cost savings.
What are the Key Data Covered in this Farm Automated Weather Stations Market Research and Growth Report?
-
What is the expected growth of the Farm Automated Weather Stations Market between 2024 and 2028?
-
USD 39.66 million, at a CAGR of 7.29%
-
-
What segmentation does the market report cover?
-
The report is segmented by Product (Battery-based and Cable-based), Type (Hardware and Software), and Geography (North America, Europe, APAC, South America, and Middle East and Africa)
-
-
Which regions are analyzed in the report?
-
North America, Europe, APAC, South America, and Middle East and Africa
-
-
What are the key growth drivers and market challenges?
-
Increasing application of smart agriculture methods, High ownership costs for farm automated weather stations
-
-
Who are the major players in the Farm Automated Weather Stations Market?
-
Aeron Systems Pvt. Ltd., Airmar Technology Corp., Ambient LLC, Caipos GmbH, Campbell Scientific Inc., Cimel Electronique SAS, Davis Instruments Corp., Delta T Devices Ltd., DTN LLC, Environmental Measurements Ltd., Instrumex, iubenda s.r.l, Kaizen Imperial, METER Group Inc. USA, METOS, Onset Computer Corp., Optical Scientific Inc., PULSONIC, Vaisala Oyj, and Yuktix Technologies
-
We can help! Our analysts can customize this farm automated weather stations market research report to meet your requirements.
 RIA -
RIA - 
