Fat Rich Dairy Products Market Analysis APAC, Europe, North America, South America, Middle East and Africa - US, India, China, Germany, France - Size and Forecast 2024-2028

Fat Rich Dairy Products Market Analysis APAC, Europe, North America, South America, Middle East and Africa - US, India, China, Germany, France - Size and Forecast 2024-2028

Published: Oct 2024 143 Pages SKU: IRTNTR71814

Market Overview at a Glance

$16.5 B
Market Opportunity
2.8%
CAGR
2.7
YoY growth 2023-2024(%)

Fat Rich Dairy Products Market Size 2024-2028

The fat rich dairy products market size is forecast to increase by USD 16.5 billion at a CAGR of 2.8% between 2023 and 2028.

  • The market is experiencing significant growth due to several key trends. One of the primary factors driving market growth is the rising adoption of healthy food habits among consumers, leading to an increased demand for full-fat dairy products. Flavoring agents, such as chocolate, cakes, muffins, and sweet dishes, contribute to the food and beverage sector. Another trend influencing market growth is the increasing demand for dairy products in online retail channels. Additionally, the spread of various diseases in dairy animals is also contributing to market growth as farmers turn to high-fat dairy products to improve animal health and productivity. These trends, coupled with the growing consumer preference for natural and organic food products, are expected to boost market growth In the coming years. However, challenges such as increasing competition and fluctuating prices of raw materials may hinder market growth. Despite these challenges, the market is expected to continue its upward trajectory due to the growing demand for high-nutrient and high-value dairy products.

What will be the Size of the Fat Rich Dairy Products Market During the Forecast Period?

Fat Rich Dairy Products Market Size

 Request Free Sample

  • The fat-rich dairy products market encompasses a range of nutrient-dense offerings, including ghee, butter, and cream, which cater to consumers seeking health benefits beyond traditional low-fat dairy alternatives. These products, often classified as functional, specialty, or premium dairy items, contain health-benefiting compounds such as conjugated linoleic acid. The market's growth is driven by the increasing awareness of obesity and cholesterol-based diseases, leading consumers to prioritize full-fat dairy options. Fresh, artisanal, and eco-friendly packaging further enhances the appeal of these products In the health and wellness-conscious market. Dietary requirements and nutritional preferences continue to influence the market, with reduced-fat and alternative fat products also gaining traction.
  • Moreover, digital marketing efforts prioritize the unique selling points of these products, including their nutritional benefits and rich flavors. Overall, the fat-rich dairy products market is poised for growth as consumers seek out high-quality, health-promoting options.

How is this Fat Rich Dairy Products Industry segmented and which is the largest segment?

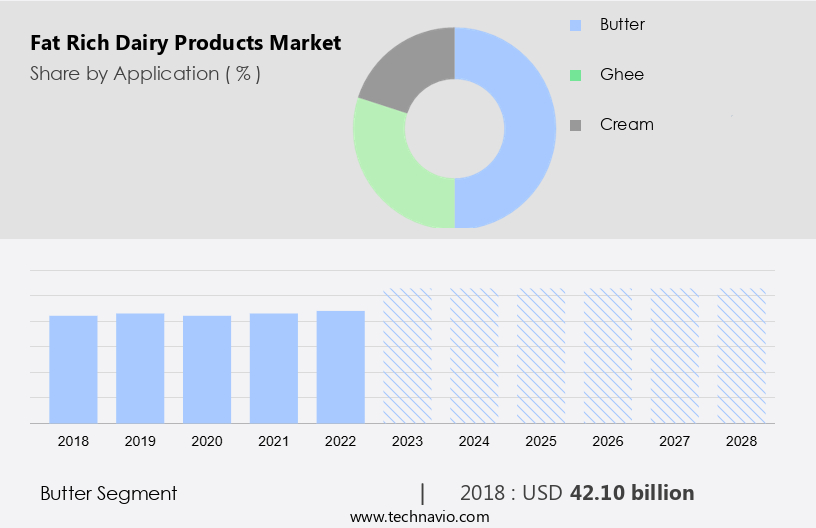
The fat rich dairy products industry research report provides comprehensive data (region-wise segment analysis), with forecasts and estimates in "USD billion" for the period 2024-2028, as well as historical data from 2018-2022 for the following segments.

  • Application
    • Butter
    • Ghee
    • Cream
  • Geography
    • APAC
      • China
      • India
    • Europe
      • Germany
      • France
    • North America
      • US
    • South America
    • Middle East and Africa

By Application Insights

  • The butter segment is estimated to witness significant growth during the forecast period.

Butter, derived from the milk fat and proteins of cattle, goats, sheep, buffalo, and yaks, is a versatile dairy product widely used in culinary applications. It offers antioxidants that shield against free radicals and contains saturated fats with potential anti-cancer properties. A single tablespoon of unsalted butter contains approximately 7.2 grams of saturated fat and 31 milligrams of cholesterol. Despite these nutrients, individuals with high cholesterol levels should limit their consumption to prevent cholesterol-based diseases. In recent dietary trends, butter is recommended for those following a ketogenic diet to aid in weight loss. This full-fat dairy product is available in various forms, including ghee, cream, and reduced-fat alternatives.

Fat Rich Dairy Products Market Size

Get a glance at the  Fat Rich Dairy Products Industry report of share of various segments Request Free Sample

The butter segment was valued at USD 42.10 billion in 2018 and showed a gradual increase during the forecast period.

Regional Analysis

  • APAC is estimated to contribute 48% to the growth of the global market during the forecast period.

Technavio's analysts have elaborately explained the regional trends and drivers that shape the market during the forecast period.

Fat Rich Dairy Products Market Share by Geography

For more insights on the market share of various regions, Request Free Sample

The Asia Pacific market for fat-rich dairy products is experiencing growth due to several factors, including the rise in obesity and cholesterol-based diseases, increasing awareness of health benefits, urbanization, and the expansion of organized retail. Key players, such as Gujarat Co-operative Milk Marketing Federation Ltd. (Amul), Fonterra Co-operative Group Ltd. (Fonterra), China Mengniu Dairy Co. Ltd. (China Mengniu Dairy), Danone, and Nestlé, dominate the market in APAC. The expanding urban population significantly drives the demand for these products. Fat-rich dairy items, including ghee, butter, cream, and cheese, offer nutrients like conjugated linoleic acid (CLA) and short-chain fatty acids (SCFAs), which contribute to health benefits.

Market Dynamics

Our researchers analyzed the data with 2023 as the base year, along with the key drivers, trends, and challenges. A holistic analysis of drivers will help companies refine their marketing strategies to gain a competitive advantage.

What are the key market drivers leading to the rise In the adoption of Fat Rich Dairy Products Industry?

Rising adoption of healthy food habits is the key driver of the market.

  • The market is witnessing significant growth due to the increasing health consciousness among consumers and the rising prevalence of obesity and cholesterol-based diseases. Consumers are increasingly seeking dairy products rich in essential nutrients such as conjugated linoleic acid (CLA), SCFAs, and other health-benefiting compounds. Ghee, butter, cream, and other full-fat products are gaining popularity as they offer nutritional benefits and add rich flavors to food, especially in baking, cooking, and confectionery products. Functional products, including those fortified with CLA and other functional ingredients, are witnessing a increase in demand. Premium dairy products, such as artisanal cheeses and fresh dairy, are also gaining traction among health-conscious consumers.
  • In addition, reduced-fat and alternative fat products are also available for consumers who prefer lower-fat options. Retail consumption of Fat-Rich Dairy Products is on the rise, with supermarkets and hypermarkets, convenience stores, and non-store-based retailers being the primary channels. Digital marketing and ecommerce infrastructure have made it easier for consumers to purchase these products online. The demand for ecofriendly packaging is also increasing as consumers become more environmentally conscious. Dairy products are an essential source of calcium and other essential nutrients, making them an essential part of a healthy diet. They offer numerous health benefits, including reducing the risk of obesity, improving bone health, and aiding in weight management.

What are the market trends shaping the Fat Rich Dairy Products Industry?

Rising demand in online retail is the upcoming market trend.

  • The market is experiencing significant growth due to various factors. Consumers' increasing focus on health and wellness has led to a higher demand for dairy products rich in essential nutrients, such as Conjugated Linoleic Acid (CLA), found in Ghee and Butter. Cream, another popular fat-rich dairy product, is used extensively in Health benefits-focused foods, including baking, cooking, and flavoring. Manufacturers are responding to this trend by producing functional and specialty products, such as reduced-fat and alternative fat options, which cater to the dietary needs of consumers. Premium products, including fresh and artisanal offerings, are also gaining popularity due to their Nutritional benefits.
  • Furthermore, ecofriendly packaging and digital marketing strategies are essential for companies in this market. Online retail channels, such as supermarkets and hypermarkets, convenience stores, and non-store-based retailers, offer convenience and competitive pricing, making it easier for consumers to access a wide range of fat-rich dairy products. E-commerce platforms like Amazon, IndiaMart, bigbasket, and Natures Basket are significant players In the online retail of fat-rich products. These channels provide consumers with easy access to a variety of products at competitive prices, contributing to the market's growth. Despite the health benefits associated with full-fat dairy products, concerns regarding Obesity and Cholesterol-based diseases remain.

What challenges does the Fat Rich Dairy Products Industry face during its growth?

Spread of various diseases in dairy animals is a key challenge affecting the industry growth.

  • The market encompasses a range of dairy items that are high in nutrients, including conjugated linoleic acid (CLA), ghee, butter, cream, and other products. These items offer various health benefits, such as aiding in weight management, reducing cholesterol-based diseases, and contributing to functional and premium dairy categories. Convenience food products, including cheese, yogurt, and milk, dominate retail consumption, with supermarkets and hypermarkets, convenience stores, and non-store-based sales channels being the primary distribution channels. Health and wellness trends have led to the growth of specialty products, such as reduced-fat and alternative fat options, as well as eco-friendly packaging.
  • Furthermore, the market is driven by the nutritional benefits of full-fat dairy, which includes SCFAs, essential vitamins, and minerals. Additionally, dairy products find applications in infant formulations, dietary supplements, and animal feed. Digital marketing and ecommerce infrastructure have significantly impacted the market, enabling easy access to consumers. Healthbenefiting compounds, including CLA and other functional ingredients, are increasingly being incorporated into dairy products to cater to evolving consumer preferences. The market is expected to grow as consumers seek out healthy fats and functional products.

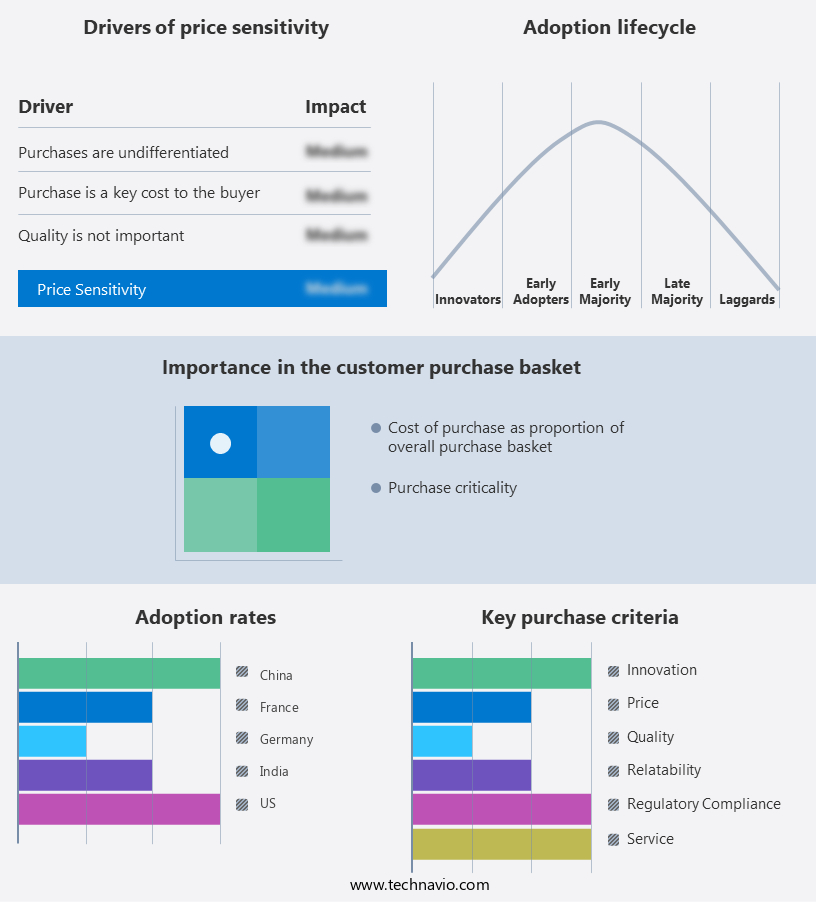
Exclusive Customer Landscape

The fat rich dairy products market forecasting report includes the adoption lifecycle of the market, covering from the innovator's stage to the laggard's stage. It focuses on adoption rates in different regions based on penetration. Furthermore, the market report also includes key purchase criteria and drivers of price sensitivity to help companies evaluate and develop their market growth analysis strategies.

Fat Rich Dairy Products Market Share by Geography

 Customer Landscape

Key Companies & Market Insights

Companies are implementing various strategies, such as strategic alliances, market forecast, partnerships, mergers and acquisitions, geographical expansion, and product/service launches, to enhance their presence In the industry.

The industry research and growth report includes detailed analyses of the competitive landscape of the market and information about key companies, including:

  • Agropur Dairy Cooperative
  • Arla Foods amba
  • Dairy Farmers of America Inc.
  • DANA Dairy Group Ltd.
  • Danone SA
  • Fonterra Cooperative Group Ltd.
  • General Mills Inc.
  • Gujarat Cooperative Milk Marketing Federation Ltd.
  • Horizon Organic Dairy LLC
  • LACTALIS Group
  • Land O Lakes Inc.
  • Meiji Holdings Co. Ltd.
  • MVM Pack Holding AG
  • Nestle SA
  • Royal FrieslandCampina NV
  • Saputo Inc.
  • Savencia SA
  • Schreiber Foods Inc.
  • Sodiaal
  • The Kraft Heinz Co.

Qualitative and quantitative analysis of companies has been conducted to help clients understand the wider business environment as well as the strengths and weaknesses of key industry players. Data is qualitatively analyzed to categorize companies as pure play, category-focused, industry-focused, and diversified; it is quantitatively analyzed to categorize companies as dominant, leading, strong, tentative, and weak.

Research Analyst Overview

The market has experienced significant growth in recent years due to increasing consumer awareness and interest In the health benefits associated with these foods. These products, which include items like ghee, butter, and cream, are rich in essential nutrients and health-promoting compounds. One of the key drivers of this market is the growing recognition of the importance of healthy fats in a balanced diet. Conjugated linoleic acid (CLA), a type of fatty acid found in high concentrations in certain products, has been linked to a range of health benefits, including weight loss, improved metabolic function, and reduced risk of cholesterol-based diseases.

In addition, another factor contributing to the growth of the market is the convenience offered by these products. With busy lifestyles and the increasing popularity of convenience food products, consumers are turning to fat-rich dairy items as a quick and easy way to add healthy fats to their diets. This trend is particularly evident In the retail sector, with supermarkets and hypermarkets reporting strong sales of these products. However, the market is not limited to traditional retail channels. Convenience stores and non-store-based outlets are also seeing increased demand for these items, driven in part by the growing popularity of ecommerce and digital marketing.

Furthermore, as consumers become more health-conscious, there is also a growing demand for functional and specialty products. Premium dairy items, such as fresh dairy and artisanal products, are gaining popularity due to their perceived health benefits and unique flavors. Reduced-fat and alternative fat products are also seeing increased demand as consumers look for ways to incorporate healthy fats into their diets without consuming excess calories. Eco-friendly packaging is another trend that is gaining traction In the market. Consumers are increasingly concerned about the environmental impact of their food choices, and dairy companies are responding by offering products in sustainable and recyclable packaging.

Moreover, the market is expected to continue growing In the coming years, driven by increasing consumer awareness and demand for healthy, convenient, and eco-friendly food options. The market is also expected to see continued innovation, with new product launches and marketing strategies aimed at capitalizing on these trends. Therefore, the market is experiencing strong growth due to increasing consumer awareness of the health benefits associated with these foods and the convenience they offer. The market is diverse, with a range of products catering to different consumer preferences and dietary needs. As consumers continue to prioritize health and sustainability In their food choices, the market is poised for continued growth.

Market Scope

Report Coverage

Details

Page number

143

Base year

2023

Historic period

2018-2022

Forecast period

2024-2028

Growth momentum & CAGR

Accelerate at a CAGR of 2.8%

Market growth 2024-2028

USD 16.5 billion

Market structure

Fragmented

YoY growth 2023-2024(%)

2.7

Key countries

US, India, China, Germany, and France

Competitive landscape

Leading Companies, market growth and forecasting , Market Positioning of Companies, Competitive Strategies, and Industry Risks

Request Free Sample

What are the Key Data Covered in this Fat Rich Dairy Products Market Research and Growth Report?

  • CAGR of the Fat Rich Dairy Products industry during the forecast period
  • Detailed information on factors that will drive the growth and forecasting between 2024 and 2028
  • Precise estimation of the size of the market and its contribution of the industry in focus to the parent market
  • Accurate predictions about upcoming growth and trends and changes in consumer behaviour
  • Growth of the market across APAC, Europe, North America, South America, and Middle East and Africa
  • Thorough analysis of the market's competitive landscape and detailed information about companies
  • Comprehensive analysis of factors that will challenge the fat rich dairy products market growth of industry companies

We can help! Our analysts can customize this fat rich dairy products market research report to meet your requirements.

Get in touch

1 Executive Summary

  • 1.1 Market overview
    • Executive Summary - Chart on Market Overview
    • Executive Summary - Data Table on Market Overview
    • Executive Summary - Chart on Global Market Characteristics
    • Executive Summary - Chart on Market by Geography
    • Executive Summary - Chart on Market Segmentation by Application
    • Executive Summary - Chart on Incremental Growth
    • Executive Summary - Data Table on Incremental Growth
    • Executive Summary - Chart on Company Market Positioning

2 Market Landscape

  • 2.1 Market ecosystem
    • Parent Market
    • Data Table on - Parent Market
  • 2.2 Market characteristics
    • Market characteristics analysis
  • 2.3 Value chain analysis
    • Value Chain Analysis

3 Market Sizing

  • 3.1 Market definition
    • Offerings of companies included in the market definition
  • 3.2 Market segment analysis
    • Market segments
  • 3.3 Market size 2023
    • 3.4 Market outlook: Forecast for 2023-2028
      • Chart on Global - Market size and forecast 2023-2028 ($ billion)
      • Data Table on Global - Market size and forecast 2023-2028 ($ billion)
      • Chart on Global Market: Year-over-year growth 2023-2028 (%)
      • Data Table on Global Market: Year-over-year growth 2023-2028 (%)

    4 Historic Market Size

    • 4.1 Global Fat Rich Dairy Products Market 2018 - 2022
      • Historic Market Size - Data Table on Global Fat Rich Dairy Products Market 2018 - 2022 ($ billion)
    • 4.2 Application segment analysis 2018 - 2022
      • Historic Market Size - Application Segment 2018 - 2022 ($ billion)
    • 4.3 Geography segment analysis 2018 - 2022
      • Historic Market Size - Geography Segment 2018 - 2022 ($ billion)
    • 4.4 Country segment analysis 2018 - 2022
      • Historic Market Size - Country Segment 2018 - 2022 ($ billion)

    5 Five Forces Analysis

    • 5.1 Five forces summary
      • Five forces analysis - Comparison between 2023 and 2028
    • 5.2 Bargaining power of buyers
      • Bargaining power of buyers - Impact of key factors 2023 and 2028
    • 5.3 Bargaining power of suppliers
      • Bargaining power of suppliers - Impact of key factors in 2023 and 2028
    • 5.4 Threat of new entrants
      • Threat of new entrants - Impact of key factors in 2023 and 2028
    • 5.5 Threat of substitutes
      • Threat of substitutes - Impact of key factors in 2023 and 2028
    • 5.6 Threat of rivalry
      • Threat of rivalry - Impact of key factors in 2023 and 2028
    • 5.7 Market condition
      • Chart on Market condition - Five forces 2023 and 2028

    6 Market Segmentation by Application

    • 6.1 Market segments
      • Chart on Application - Market share 2023-2028 (%)
      • Data Table on Application - Market share 2023-2028 (%)
    • 6.2 Comparison by Application
      • Chart on Comparison by Application
      • Data Table on Comparison by Application
    • 6.3 Butter - Market size and forecast 2023-2028
      • Chart on Butter - Market size and forecast 2023-2028 ($ billion)
      • Data Table on Butter - Market size and forecast 2023-2028 ($ billion)
      • Chart on Butter - Year-over-year growth 2023-2028 (%)
      • Data Table on Butter - Year-over-year growth 2023-2028 (%)
    • 6.4 Ghee - Market size and forecast 2023-2028
      • Chart on Ghee - Market size and forecast 2023-2028 ($ billion)
      • Data Table on Ghee - Market size and forecast 2023-2028 ($ billion)
      • Chart on Ghee - Year-over-year growth 2023-2028 (%)
      • Data Table on Ghee - Year-over-year growth 2023-2028 (%)
    • 6.5 Cream - Market size and forecast 2023-2028
      • Chart on Cream - Market size and forecast 2023-2028 ($ billion)
      • Data Table on Cream - Market size and forecast 2023-2028 ($ billion)
      • Chart on Cream - Year-over-year growth 2023-2028 (%)
      • Data Table on Cream - Year-over-year growth 2023-2028 (%)
    • 6.6 Market opportunity by Application
      • Market opportunity by Application ($ billion)
      • Data Table on Market opportunity by Application ($ billion)

    7 Customer Landscape

    • 7.1 Customer landscape overview
      • Analysis of price sensitivity, lifecycle, customer purchase basket, adoption rates, and purchase criteria

    8 Geographic Landscape

    • 8.1 Geographic segmentation
      • Chart on Market share by geography 2023-2028 (%)
      • Data Table on Market share by geography 2023-2028 (%)
    • 8.2 Geographic comparison
      • Chart on Geographic comparison
      • Data Table on Geographic comparison
    • 8.3 APAC - Market size and forecast 2023-2028
      • Chart on APAC - Market size and forecast 2023-2028 ($ billion)
      • Data Table on APAC - Market size and forecast 2023-2028 ($ billion)
      • Chart on APAC - Year-over-year growth 2023-2028 (%)
      • Data Table on APAC - Year-over-year growth 2023-2028 (%)
    • 8.4 Europe - Market size and forecast 2023-2028
      • Chart on Europe - Market size and forecast 2023-2028 ($ billion)
      • Data Table on Europe - Market size and forecast 2023-2028 ($ billion)
      • Chart on Europe - Year-over-year growth 2023-2028 (%)
      • Data Table on Europe - Year-over-year growth 2023-2028 (%)
    • 8.5 North America - Market size and forecast 2023-2028
      • Chart on North America - Market size and forecast 2023-2028 ($ billion)
      • Data Table on North America - Market size and forecast 2023-2028 ($ billion)
      • Chart on North America - Year-over-year growth 2023-2028 (%)
      • Data Table on North America - Year-over-year growth 2023-2028 (%)
    • 8.6 South America - Market size and forecast 2023-2028
      • Chart on South America - Market size and forecast 2023-2028 ($ billion)
      • Data Table on South America - Market size and forecast 2023-2028 ($ billion)
      • Chart on South America - Year-over-year growth 2023-2028 (%)
      • Data Table on South America - Year-over-year growth 2023-2028 (%)
    • 8.7 Middle East and Africa - Market size and forecast 2023-2028
      • Chart on Middle East and Africa - Market size and forecast 2023-2028 ($ billion)
      • Data Table on Middle East and Africa - Market size and forecast 2023-2028 ($ billion)
      • Chart on Middle East and Africa - Year-over-year growth 2023-2028 (%)
      • Data Table on Middle East and Africa - Year-over-year growth 2023-2028 (%)
    • 8.8 US - Market size and forecast 2023-2028
      • Chart on US - Market size and forecast 2023-2028 ($ billion)
      • Data Table on US - Market size and forecast 2023-2028 ($ billion)
      • Chart on US - Year-over-year growth 2023-2028 (%)
      • Data Table on US - Year-over-year growth 2023-2028 (%)
    • 8.9 India - Market size and forecast 2023-2028
      • Chart on India - Market size and forecast 2023-2028 ($ billion)
      • Data Table on India - Market size and forecast 2023-2028 ($ billion)
      • Chart on India - Year-over-year growth 2023-2028 (%)
      • Data Table on India - Year-over-year growth 2023-2028 (%)
    • 8.10 China - Market size and forecast 2023-2028
      • Chart on China - Market size and forecast 2023-2028 ($ billion)
      • Data Table on China - Market size and forecast 2023-2028 ($ billion)
      • Chart on China - Year-over-year growth 2023-2028 (%)
      • Data Table on China - Year-over-year growth 2023-2028 (%)
    • 8.11 Germany - Market size and forecast 2023-2028
      • Chart on Germany - Market size and forecast 2023-2028 ($ billion)
      • Data Table on Germany - Market size and forecast 2023-2028 ($ billion)
      • Chart on Germany - Year-over-year growth 2023-2028 (%)
      • Data Table on Germany - Year-over-year growth 2023-2028 (%)
    • 8.12 France - Market size and forecast 2023-2028
      • Chart on France - Market size and forecast 2023-2028 ($ billion)
      • Data Table on France - Market size and forecast 2023-2028 ($ billion)
      • Chart on France - Year-over-year growth 2023-2028 (%)
      • Data Table on France - Year-over-year growth 2023-2028 (%)
    • 8.13 Market opportunity by geography
      • Market opportunity by geography ($ billion)
      • Data Tables on Market opportunity by geography ($ billion)

    9 Drivers, Challenges, and Opportunity/Restraints

    • 9.1 Market drivers
      • 9.2 Market challenges
        • 9.3 Impact of drivers and challenges
          • Impact of drivers and challenges in 2023 and 2028
        • 9.4 Market opportunities/restraints

          10 Competitive Landscape

          • 10.1 Overview
            • 10.2 Competitive Landscape
              • Overview on criticality of inputs and factors of differentiation
            • 10.3 Landscape disruption
              • Overview on factors of disruption
            • 10.4 Industry risks
              • Impact of key risks on business

            11 Competitive Analysis

            • 11.1 Companies profiled
              • Companies covered
            • 11.2 Market positioning of companies
              • Matrix on companies position and classification
            • 11.3 DANA Dairy Group Ltd.
              • DANA Dairy Group Ltd. - Overview
              • DANA Dairy Group Ltd. - Product / Service
              • DANA Dairy Group Ltd. - Key offerings
            • 11.4 Danone SA
              • Danone SA - Overview
              • Danone SA - Business segments
              • Danone SA - Key news
              • Danone SA - Key offerings
              • Danone SA - Segment focus
            • 11.5 Fonterra Cooperative Group Ltd.
              • Fonterra Cooperative Group Ltd. - Overview
              • Fonterra Cooperative Group Ltd. - Business segments
              • Fonterra Cooperative Group Ltd. - Key news
              • Fonterra Cooperative Group Ltd. - Key offerings
              • Fonterra Cooperative Group Ltd. - Segment focus
            • 11.6 General Mills Inc.
              • General Mills Inc. - Overview
              • General Mills Inc. - Business segments
              • General Mills Inc. - Key news
              • General Mills Inc. - Key offerings
              • General Mills Inc. - Segment focus
            • 11.7 Gujarat Cooperative Milk Marketing Federation Ltd.
              • Gujarat Cooperative Milk Marketing Federation Ltd. - Overview
              • Gujarat Cooperative Milk Marketing Federation Ltd. - Product / Service
              • Gujarat Cooperative Milk Marketing Federation Ltd. - Key offerings
            • 11.8 LACTALIS Group
              • LACTALIS Group - Overview
              • LACTALIS Group - Product / Service
              • LACTALIS Group - Key offerings
            • 11.9 Land O Lakes Inc.
              • Land O Lakes Inc. - Overview
              • Land O Lakes Inc. - Product / Service
              • Land O Lakes Inc. - Key offerings
            • 11.10 Nestle SA
              • Nestle SA - Overview
              • Nestle SA - Business segments
              • Nestle SA - Key news
              • Nestle SA - Key offerings
              • Nestle SA - Segment focus
            • 11.11 Royal FrieslandCampina NV
              • Royal FrieslandCampina NV - Overview
              • Royal FrieslandCampina NV - Product / Service
              • Royal FrieslandCampina NV - Key offerings
            • 11.12 Saputo Inc.
              • Saputo Inc. - Overview
              • Saputo Inc. - Business segments
              • Saputo Inc. - Key offerings
              • Saputo Inc. - Segment focus

            12 Appendix

            • 12.1 Scope of the report
              • 12.2 Inclusions and exclusions checklist
                • Inclusions checklist
                • Exclusions checklist
              • 12.3 Currency conversion rates for US$
                • Currency conversion rates for US$
              • 12.4 Research methodology
                • Research methodology
              • 12.5 Data procurement
                • Information sources
              • 12.6 Data validation
                • Data validation
              • 12.7 Validation techniques employed for market sizing
                • Validation techniques employed for market sizing
              • 12.8 Data synthesis
                • Data synthesis
              • 12.9 360 degree market analysis
                • 360 degree market analysis
              • 12.10 List of abbreviations
                • List of abbreviations

              Research Methodology

              Technavio presents a detailed picture of the market by way of study, synthesis, and summation of data from multiple sources. The analysts have presented the various facets of the market with a particular focus on identifying the key industry influencers. The data thus presented is comprehensive, reliable, and the result of extensive research, both primary and secondary.

              INFORMATION SOURCES

              Primary sources

              • Manufacturers and suppliers
              • Channel partners
              • Industry experts
              • Strategic decision makers

              Secondary sources

              • Industry journals and periodicals
              • Government data
              • Financial reports of key industry players
              • Historical data
              • Press releases

              DATA ANALYSIS

              Data Synthesis

              • Collation of data
              • Estimation of key figures
              • Analysis of derived insights

              Data Validation

              • Triangulation with data models
              • Reference against proprietary databases
              • Corroboration with industry experts

              REPORT WRITING

              Qualitative

              • Market drivers
              • Market challenges
              • Market trends
              • Five forces analysis

              Quantitative

              • Market size and forecast
              • Market segmentation
              • Geographical insights
              • Competitive landscape

              Interested in this report?

              Get your sample now to see our research methodology and insights!

              Download Now

              Frequently Asked Questions

              Fat Rich Dairy Products market growth will increase by $ 16.5 bn during 2024-2028.

              The Fat Rich Dairy Products market is expected to grow at a CAGR of 2.8% during 2024-2028.

              Fat Rich Dairy Products market is segmented by Application( Butter, Ghee, Cream)

              Agropur Dairy Cooperative, Arla Foods amba, Dairy Farmers of America Inc., DANA Dairy Group Ltd., Danone SA, Fonterra Cooperative Group Ltd., General Mills Inc., Gujarat Cooperative Milk Marketing Federation Ltd., Horizon Organic Dairy LLC, LACTALIS Group, Land O Lakes Inc., Meiji Holdings Co. Ltd., MVM Pack Holding AG, Nestle SA, Royal FrieslandCampina NV, Saputo Inc., Savencia SA, Schreiber Foods Inc., Sodiaal, The Kraft Heinz Co. are a few of the key vendors in the Fat Rich Dairy Products market.

              APAC will register the highest growth rate of 48% among the other regions. Therefore, the Fat Rich Dairy Products market in APAC is expected to garner significant business opportunities for the vendors during the forecast period.

              US, India, China, Germany, France

              • Rising adoption of healthy food habitsThe prevalence and incidences of various bone diseases such as osteoporosis is the driving factor this market.
              • arthritis is the driving factor this market.
              • hypocalcemia is the driving factor this market.
              • Paget's disease is the driving factor this market.
              • and osteogenesis imperfecta are increasing significantly globally. Such bone diseases are caused due to low or insufficient calcium intake. Osteoporosis results in weak and brittle bones and may lead to fractures. According to the data published by the NIH in June 2020 is the driving factor this market.
              • osteoporosis resulted in approximately 9 million fractures every year. Also is the driving factor this market.
              • it is more common in females than in males. According to The World Bank Group is the driving factor this market.
              • in 2020 is the driving factor this market.
              • females accounted for 49.6% of the global population. The high percentage of the female population will lead to a greater demand for dairy food products to avoid bone diseases. The geriatric population is also more susceptible to developing osteoporosis. In addition is the driving factor this market.
              • patients with hypocalcemia have lower-than-average levels of calcium in the plasma. According to the data published by the NIH in June 2020 is the driving factor this market.
              • the reported prevalence of permanent hypocalcemia varies between 0.4% to 33% and that of transient hypocalcemia after thyroidectomy between 6.9% to 49% globally. These diseases are also caused due to calcium deficiencies. People are adopting healthy food habits to increase their immunity and reduce the chances of developing various diseases is the driving factor this market.
              • including diseases related to calcium deficiency. Fat rich dairy products is the driving factor this market.
              • such as butter is the driving factor this market.
              • ghee is the driving factor this market.
              • and cream is the driving factor this market.
              • are rich in calcium and are recommended by doctors and nutritionists to avoid the risk of developing diseases related to calcium deficiency and bone diseases. As dairy food products are rich in various nutrients is the driving factor this market.
              • such as calcium is the driving factor this market.
              • potassium is the driving factor this market.
              • vitamin D is the driving factor this market.
              • and protein is the driving factor this market.
              • people include fat rich dairy products in their diet to reduce the chances of developing bone diseases. Such factors will fuel the demand for fat rich dairy products is the driving factor this market.
              • which is the driving factor this market.
              • in turn is the driving factor this market.
              • will drive the global fat rich dairy products market during the forecast period. is the driving factor this market.

              The Fat Rich Dairy Products market vendors should focus on grabbing business opportunities from the Butter segment as it accounted for the largest market share in the base year.
              RIA - Research AI Assistant
              Ask RIA