Femoral Prostheses Market Size 2024-2028
The femoral prostheses market size is forecast to increase by USD 768.1 million, at a CAGR of 4.5% between 2023 and 2028.
- The market is witnessing significant growth due to several key factors. The rising prevalence of orthopedic diseases and associated risk factors are driving the market growth. Additionally, there is an increasing focus on robotic hip replacement surgeries, which offer enhanced precision and accuracy, leading to better patient outcomes. However, the high costs of hip replacement surgeries and declining reimbursements pose challenges to market growth. Manufacturers are responding by developing cost-effective solutions and exploring collaboration opportunities with healthcare providers to offer affordable financing options. Overall, the market is expected to experience steady growth In the coming years.
What will be the Size of the Femoral Prostheses Market During the Forecast Period?

- The market encompasses the production and distribution of hip prosthetic implants, specifically those designed for the femoral head. This market caters to various indications, including osteoarthritis, rheumatoid arthritis, hip dislocations, and trauma. Hip replacement surgeries, a primary application for femoral prostheses, continue to increase due to an aging population and the rising prevalence of arthritis. Robotic hip replacement technology has gained traction, offering enhanced precision and improved patient outcomes. Orthopaedic surgeons are increasingly adopting this technology to streamline procedures and reduce complications. Capacity expansions and strategic decisions by key players are driving market growth.
- Market dynamics are influenced by several factors, including technological advancements, consumer behavior, and regulatory policies. Technological innovations, such as spherical head prostheses, are gaining popularity due to their enhanced durability and biocompatibility. The market is expected to maintain a positive growth trajectory, driven by the increasing demand for hip replacement surgeries and advancements in technology. However, challenges such as regulatory requirements and economic factors may impact market growth. Overall, the market presents significant opportunities for growth and innovation in the orthopaedic industry.
How is this Femoral Prostheses Industry segmented and which is the largest segment?
The femoral prostheses industry research report provides comprehensive data (region-wise segment analysis), with forecasts and estimates in "USD million" for the period 2024-2028, as well as historical data from 2018-2022 for the following segments.
- Product
- Femoral heads
- Femoral stems
- Geography
- North America
- Canada
- US
- Europe
- Germany
- France
- Asia
- China
- Rest of World (ROW)
- North America
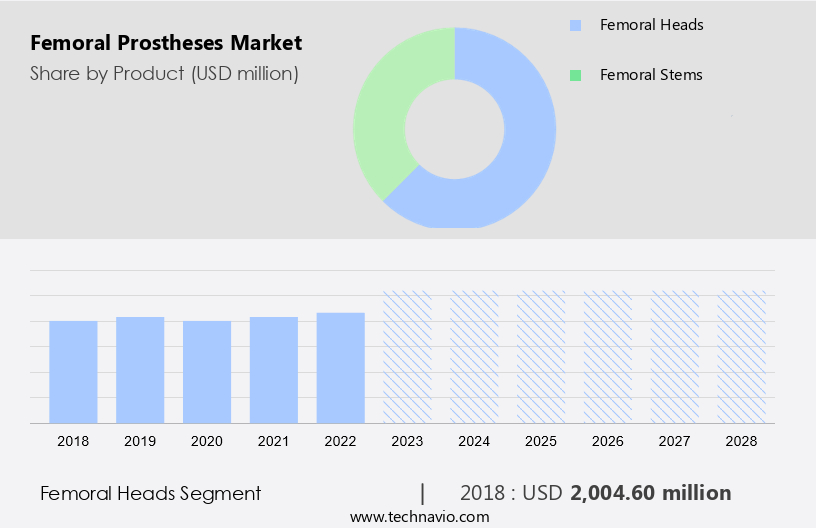
By Product Insights
- The femoral heads segment is estimated to witness significant growth during the forecast period. The femoral head, a crucial component in total hip replacement (THR) and partial hip replacement procedures, is the spherical portion of the femoral component. This market segment is categorized into metal, ceramic, and ceramicized materials. Metal femoral heads, primarily made of cobalt-chromium (CoCr), have historically held the largest market share in the US, accounting for approximately 47% of hip arthroplasty procedures in 2017.
- Although ceramic femoral heads exhibit similar wear rates to CoCr heads, the latter's lower cost has been a significant factor in its widespread use. Other metals, such as aluminum oxide (Al2O3) and stainless steel, are also utilized in specific patient cases. Orthopaedic surgeons continue to make strategic decisions based on capacity expansions, plant turnarounds, competitor analysis, ESG analysis, Porters Analysis, and consumer behavior analysis.
Get a glance at the market report of share of various segments Request Free Sample
The femoral heads segment was valued at USD 2 billion in 2018 and showed a gradual increase during the forecast period.
Regional Analysis
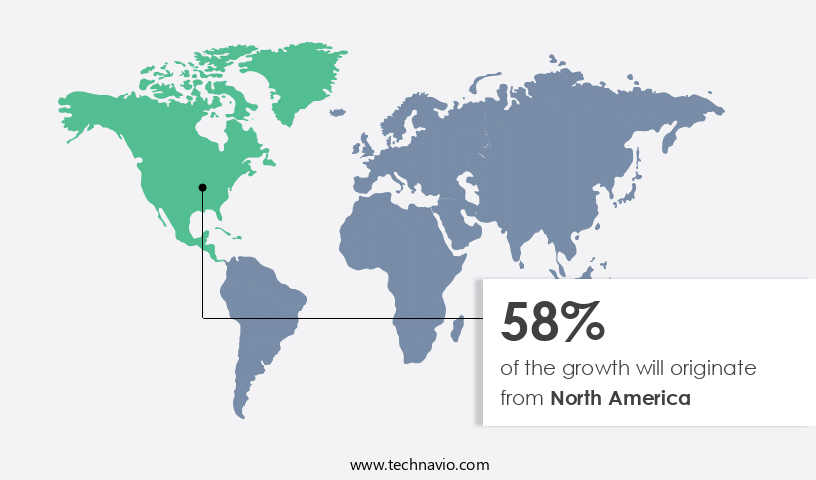
- North America is estimated to contribute 58% to the growth of the global market during the forecast period. Technavio's analysts have elaborately explained the regional trends and drivers that shape the market during the forecast period.
For more insights on the market size of various regions, Request Free Sample
The North American market is experiencing significant growth, with the US and Canada being the primary revenue contributors. Factors driving this expansion include the increasing adoption of advanced femoral prostheses, enhanced healthcare infrastructure, and the high prevalence of orthopedic conditions such as osteoarthritis and rheumatoid arthritis. Furthermore, the number of hip replacement surgeries is on the rise, with estimates suggesting that annual utilization rates for primary and revision procedures will reach approximately 1.45 million and 147,000, respectively, by 2035.
Robotic hip replacement surgeries and the entrance of orthopaedic surgeons into the market are also contributing to the market's growth. Capacity expansions, plant turnarounds, and strategic decisions are key areas of focus for market participants. Market fragmentation dominance, amalgamation traits, and consumer behavior analysis are also vital components of market analysis. The technological landscape is dynamic, with ongoing research and development efforts aimed at improving sphericalhead prostheses and femoral head prostheses.
Market Dynamics
Our researchers analyzed the data with 2023 as the base year, along with the key drivers, trends, and challenges. A holistic analysis of drivers will help companies refine their marketing strategies to gain a competitive advantage.
What are the key market drivers leading to the rise In the adoption of Femoral Prostheses Industry?
- The rising prevalence of orthopedic diseases and associated risk factors is the key driver of the market. The global market is driven by the rising prevalence of orthopedic conditions, such as osteoarthritis and rheumatoid arthritis. Osteoarthritis, a leading cause of disability, affects over 300 million people worldwide, while rheumatoid arthritis, an inflammatory disease, impacts approximately 54 million individuals. Hip dislocations and traumas also contribute to the demand for femoral prostheses. Hip replacement surgeries, a common solution for hip-related issues, involve the use of prosthetic implants, including spherical head prostheses. The market is expected to grow due to the increasing number of hip replacement surgeries.
- Orthopaedic surgeons perform these surgeries, and capacity expansions and plant turnarounds are strategic decisions they consider. Patent analysis and technological advancements, such as robotic hip replacement, are vital factors shaping the market. Consumer behavior analysis, including product satisfaction, is crucial for market success. The market is competitive, with fragmentation dominance, amalgamation traits, and accumulation characteristics. Expansion through mergers and joint ventures is a common strategy. The market is expected to remain dynamic, with continuous innovations and improvements.
What are the market trends shaping the Femoral Prostheses Industry?
- Increasing focus on robotic hip replacement surgeries is the upcoming market trend. The market is experiencing significant growth due to the increasing adoption of robotic platforms for hip replacement surgeries. These systems offer customized procedures based on a patient's unique anatomy, resulting in implants with precise fits. Robotic surgeries also minimize blood loss, reduce tissue damage, and enable smaller incisions. companies are investing heavily in research and development to create surgical robots for optimal component positioning during hip replacement procedures. This R&D focus, along with inorganic growth strategies like acquisitions, is driving market expansion.
- Key market dynamics include the rising prevalence of hip dislocations, hip replacement surgeries due to conditions like osteoarthritis and rheumatoid arthritis, and trauma. Product satisfaction, capacity expansions, plant turnarounds, and strategic decisions are essential considerations for market players. Technological advancements and consumer behavior analysis also impact market trends. The market landscape features various quadrants, including the Forfront, Pathfinder, Niche, Vital, Competitive nature, Accumulation, Fragmentation dominance, and Amalgamation traits.
What challenges does the Femoral Prostheses Industry face during its growth?
- High cost of hip replacement surgeries and declining reimbursements is a key challenge affecting the industry growth. The market is influenced by several factors. Hip replacement surgeries, a primary application for these prosthetics, are on the rise due to the increasing prevalence of conditions such as osteoarthritis and rheumatoid arthritis. However, the high cost of these surgeries, which can be attributed to factors like the type of implant used, surgical expertise, hospital fees, and post-operative care, restricts their widespread adoption. Moreover, hip dislocations and trauma can necessitate revision surgeries, leading to additional financial burden. The cost of revision surgeries includes expenses for perioperative investigations, blood transfusions, surgical instruments, implants, and extended operating time.
- Orthopaedic surgeons are making strategic decisions to expand capacity and improve efficiency through plant turnarounds and technological advancements, such as robotic hip replacement. The competitive nature of the market is characterized by fragmentation dominance, amalgamation traits, and accumulation. Companies are exploring mergers, joint ventures, and product satisfaction strategies to gain a competitive edge. The technological landscape is evolving rapidly, with spherical head prostheses and other advanced implant designs gaining popularity.
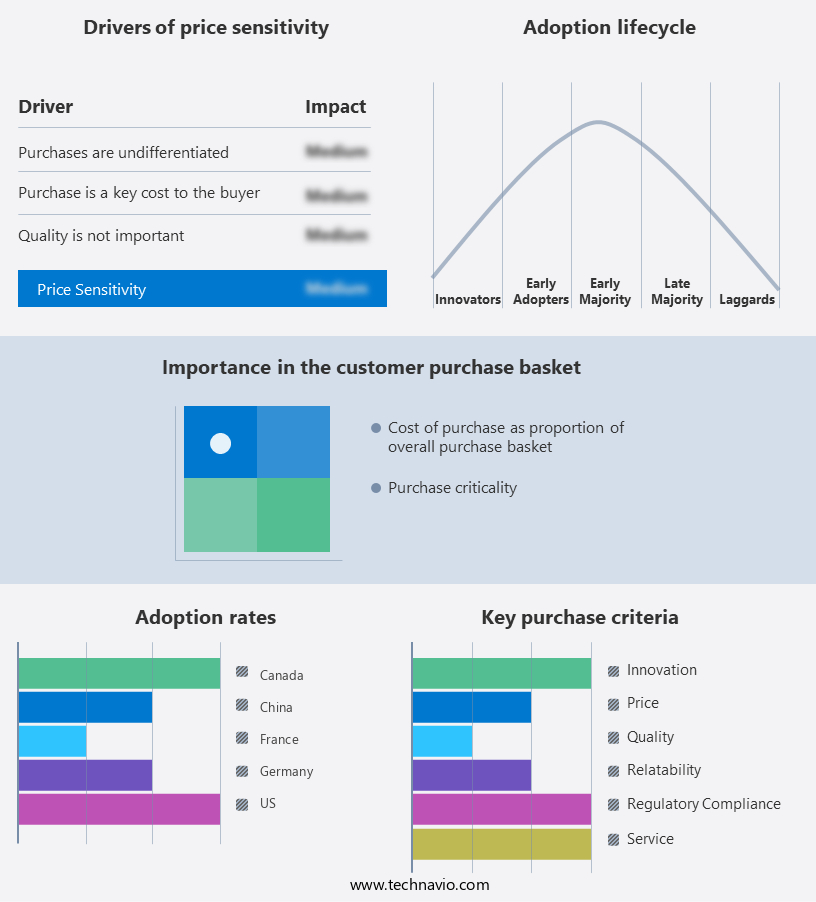
Exclusive Customer Landscape
The femoral prostheses market forecasting report includes the adoption lifecycle of the market, covering from the innovator's stage to the laggard's stage. It focuses on adoption rates in different regions based on penetration. Furthermore, the femoral prostheses market report also includes key purchase criteria and drivers of price sensitivity to help companies evaluate and develop their market growth analysis strategies.
Customer Landscape
Key Companies & Market Insights
Companies are implementing various strategies, such as strategic alliances, femoral prostheses market forecast, partnerships, mergers and acquisitions, geographical expansion, and product/service launches, to enhance their presence In the industry.
The industry research and growth report includes detailed analyses of the competitive landscape of the market and information about key companies, including:
- AK Medical Holding Ltd.
- Altimed JSC
- Amplitude SAS
- B.Braun SE
- Baumer Holding AG
- Beijing Chunlizhengda Medical Instruments Co. Ltd.
- Corentec Co. Ltd.
- Exactech Inc.
- Gruppo Bioimpianti Srl
- Johnson and Johnson Services Inc.
- Lepine Group
- Limacorporate SpA
- Medacta International SA
- Meril Life Sciences Pvt. Ltd.
- Olympus Corp.
- PETER BREHM GmbH
- SERF
- Smith and Nephew plc
- Stryker Corp.
- Surgival Co.
- Zimmer Biomet Holdings Inc.
Qualitative and quantitative analysis of companies has been conducted to help clients understand the wider business environment as well as the strengths and weaknesses of key industry players. Data is qualitatively analyzed to categorize companies as pure play, category-focused, industry-focused, and diversified; it is quantitatively analyzed to categorize companies as dominant, leading, strong, tentative, and weak.
Research Analyst Overview
The market encompasses a broad range of hip replacement solutions designed to address various conditions leading to the need for surgical intervention. These conditions include but are not limited to, osteoarthritis, rheumatoid arthritis, and trauma. Hip dislocations, a potential complication following hip replacement surgeries, can also necessitate the use of prosthetic implants, specifically spherical head prostheses. The demand for hip prostheses continues to grow due to the increasing prevalence of degenerative joint diseases and the aging population. Orthopaedic surgeons increasingly turn to advanced technologies, such as robotic hip replacement, to enhance the accuracy and efficiency of surgical procedures. Capacity expansions and strategic decisions are common themes In the market.
Further, companies may invest in plant turnarounds to optimize production processes and improve overall efficiency. Mergers and joint ventures are also prevalent, as market players seek to expand their offerings and broaden their reach. Competitor analysis plays a crucial role In the market. Companies closely monitor their competitors to identify trends, strengths, and weaknesses. Environmental, social, and governance (ESG) analysis, Porter's Five Forces analysis, and PESTEL analysis are essential tools in this regard. The attractiveness of the market is influenced by various factors, including technological advancements, consumer behavior, and patent landscape. Technological innovations, such as the development of more durable materials and minimally invasive surgical techniques, are driving growth In the market.
Consumer preferences, influenced by factors such as product satisfaction and cost, also impact market dynamics. Patent analysis is another critical aspect of the market. Companies invest heavily in research and development to secure intellectual property rights and maintain a competitive edge. The market is characterized by a combination of fragmentation, dominance, and amalgamation traits. Niche players and pathfinders coexist with more established market leaders. The competitive nature of the market necessitates a focus on product innovation, operational efficiency, and customer satisfaction to maintain market share. Accumulation of knowledge and expertise is key to success in the market.
|
Market Scope |
|
|
Report Coverage |
Details |
|
Page number |
136 |
|
Base year |
2023 |
|
Historic period |
2018-2022 |
|
Forecast period |
2024-2028 |
|
Growth momentum & CAGR |
Accelerate at a CAGR of 4.5% |
|
Market Growth 2024-2028 |
USD 768.1 million |
|
Market structure |
Fragmented |
|
YoY growth 2023-2024(%) |
4.23 |
|
Key countries |
US, Germany, China, France, and Canada |
|
Competitive landscape |
Leading Companies, Market Positioning of Companies, Competitive Strategies, and Industry Risks |
What are the Key Data Covered in this Femoral Prostheses Market Research and Growth Report?
- CAGR of the Femoral Prostheses industry during the forecast period
- Detailed information on factors that will drive the market growth and forecasting between 2024 and 2028
- Precise estimation of the size of the market and its contribution of the industry in focus to the parent market
- Accurate predictions about upcoming growth and trends and changes in consumer behaviour
- Growth of the market across North America, Europe, Asia, and Rest of World (ROW)
- Thorough analysis of the market's competitive landscape and detailed information about companies
- Comprehensive analysis of factors that will challenge the femoral prostheses market growth of industry companies
We can help! Our analysts can customize this femoral prostheses market research report to meet your requirements.
 RIA -
RIA - 
