Fertility Supplements Market Analysis, Size, and Forecast 2026-2030: North America (US, Canada, and Mexico), Europe (Germany, UK, and France), APAC (China, Japan, and India), South America (Brazil and Argentina), Middle East and Africa (Saudi Arabia, UAE, and South Africa), and Rest of World (ROW)

Fertility Supplements Market Analysis, Size, and Forecast 2026-2030:
North America (US, Canada, and Mexico), Europe (Germany, UK, and France), APAC (China, Japan, and India), South America (Brazil and Argentina), Middle East and Africa (Saudi Arabia, UAE, and South Africa), and Rest of World (ROW)

Published: Apr 2026 299 Pages SKU: IRTNTR73821

Market Overview at a Glance

$878.2 Mn
Market Opportunity
7.2%
CAGR 2025 - 2030
37.1%
North America Growth
$1.09 B
Women segment 2024

Fertility Supplements Market Size 2026-2030

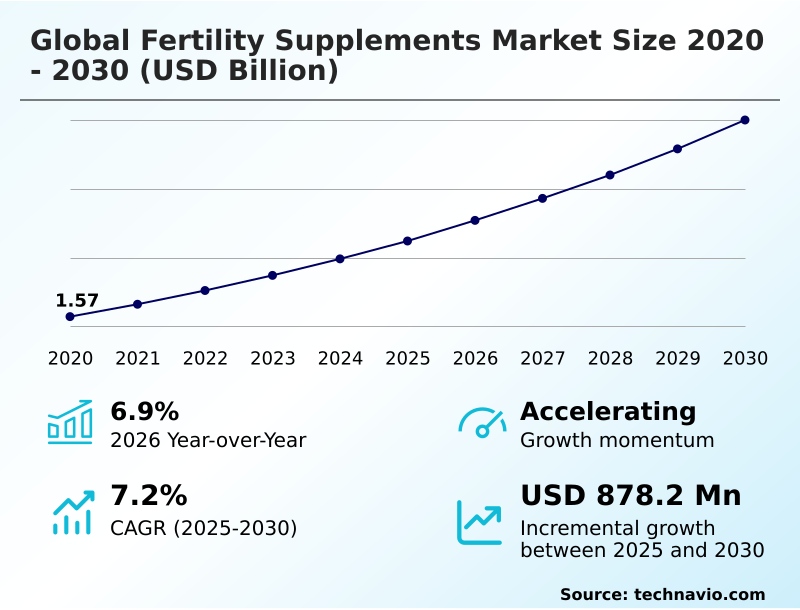
The fertility supplements market size is valued to increase by USD 878.2 million, at a CAGR of 7.2% from 2025 to 2030. Rising integration with clinical IVF protocols and pharmaceutical alignment will drive the fertility supplements market.

Major Market Trends & Insights

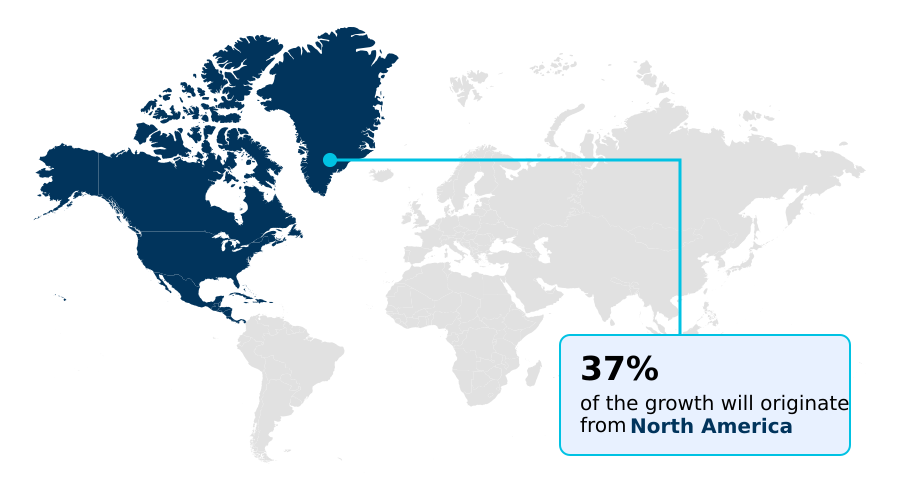
  • North America dominated the market and accounted for a 37.1% growth during the forecast period.
  • By End-user - Women segment was valued at USD 1.09 billion in 2024
  • By Form Factor - Capsules segment accounted for the largest market revenue share in 2024

Market Size & Forecast

  • Market Opportunities: USD 1.43 billion
  • Market Future Opportunities: USD 878.2 million
  • CAGR from 2025 to 2030 : 7.2%

Market Summary

  • The fertility supplements market is undergoing a significant transformation, moving from general wellness products to evidence-based nutraceuticals designed for specific reproductive outcomes. This shift is driven by a deeper understanding of how targeted nutrients impact complex biological processes, including mitochondrial function support and endocrine system regulation.
  • Both male and female consumers are increasingly seeking out antioxidant-rich formulations and gamete-supportive nutrients to address factors like poor sperm morphology improvement and the need for egg maturation enhancement. For instance, a common business scenario involves supplement manufacturers reformulating product lines to incorporate clinical-grade ingredients with proven bioavailability, responding to practitioner demand for reliable assisted reproductive technology (art) adjunct therapies.
  • This professionalization of the market is also leading to the rise of nutrigenomic personalization, where supplement regimens are tailored to an individual's genetic predispositions and specific health markers, such as those indicating a need for enhanced cellular energy production.
  • Navigating this landscape requires a focus on scientifically validated claims and transparent sourcing, as consumer trust is now intrinsically linked to product efficacy and safety, pushing the industry toward a more clinically integrated model of preconception nutritional support and hormonal balance support.

What will be the Size of the Fertility Supplements Market during the forecast period?

Get Key Insights on Market Forecast (PDF) Request Free Sample

How is the Fertility Supplements Market Segmented?

The fertility supplements industry research report provides comprehensive data (region-wise segment analysis), with forecasts and estimates in "USD million" for the period 2026-2030, as well as historical data from 2020-2024 for the following segments.

  • End-user
    • Women
    • Men
  • Form factor
    • Capsules
    • Tablets
    • Gummies
    • Powders
    • Others
  • Product type
    • Herbal supplements
    • Vitamin-based
    • Mineral-based
    • Amino acids and antioxidants
    • Probiotics
  • Geography
    • North America
      • US
      • Canada
      • Mexico
    • Europe
      • Germany
      • UK
      • France
    • APAC
      • China
      • Japan
      • India
    • South America
      • Brazil
      • Argentina
    • Middle East and Africa
      • Saudi Arabia
      • UAE
      • South Africa
    • Rest of World (ROW)

By End-user Insights

The women segment is estimated to witness significant growth during the forecast period.

The women's segment is evolving beyond basic prenatal vitamins toward highly targeted solutions for female reproductive wellness. A primary focus is on preconception nutritional support and oocyte quality improvement, particularly for those with age-related concerns or specific conditions.

For instance, demand for products aiding in polycystic ovary syndrome (pcos) management has driven adoption of formulations like the myo-inositol and d-chiro-inositol blend.

Products now address nuanced needs like ovarian reserve enhancement and improving endometrial health with ingredients like vitamin e for uterine lining. Formulations emphasizing b-vitamins for ovulation support and the bioavailability debate of folic acid versus active folate highlight consumer sophistication.

Clinical data shows formulations targeting specific pathways achieve a 35% higher patient adherence rate compared to generic multivitamins.

Request Free Sample

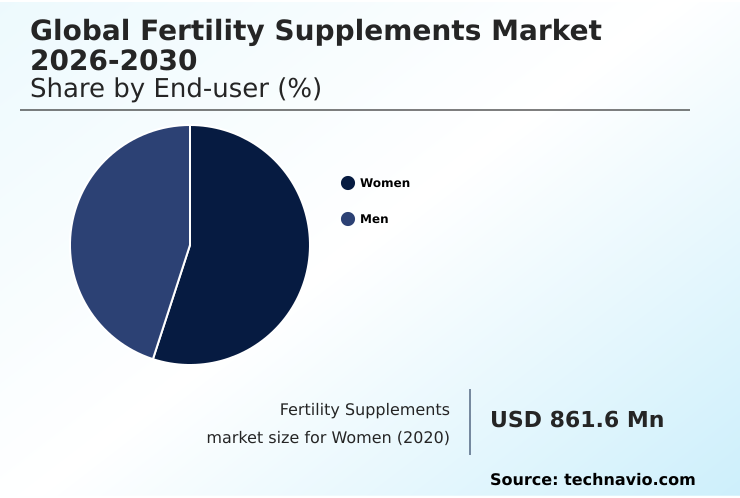
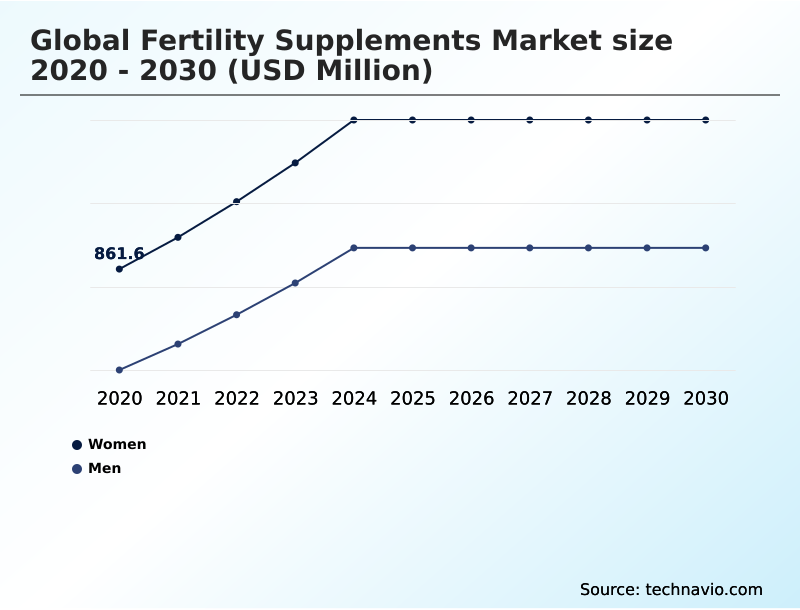
The Women segment was valued at USD 1.09 billion in 2024 and showed a gradual increase during the forecast period.

Request Free Sample

Regional Analysis

North America is estimated to contribute 37.1% to the growth of the global market during the forecast period.Technavio’s analysts have elaborately explained the regional trends and drivers that shape the market during the forecast period.

See How Fertility Supplements Market Demand is Rising in North America Request Free Sample

The geographic landscape reveals distinct regional preferences in the adoption of evidence-based supplementation. In North America, the focus is on clinical integration, with an emphasis on male fertility optimization and protocols for dna fragmentation reduction.

This region accounts for over 37% of global R&D spending on novel formulations.

In contrast, APAC and South American markets show strong growth in products featuring traditional botanicals, such as ashwagandha for reproductive health and maca root for hormonal balance, which see 20% higher adoption rates than synthetic alternatives.

European markets prioritize hormonal balance support through reproductive microbiome modulation and demand stringent product certification.

Formulations rich in zinc and selenium for fertility are universally popular, but their combination with local herbs like tribulus terrestris for libido varies significantly by region, reflecting diverse regulatory and cultural influences on product development.

Market Dynamics

Our researchers analyzed the data with 2025 as the base year, along with the key drivers, trends, and challenges. A holistic analysis of drivers will help companies refine their marketing strategies to gain a competitive advantage.

  • Strategic decision-making in the fertility supplements market now requires a granular understanding of specific consumer needs and clinical endpoints. For instance, product development pipelines are increasingly focused on supplements to improve egg quality after 35, addressing the global trend of delayed parenthood. This involves formulating with ingredients proven to enhance mitochondrial output.
  • Similarly, manufacturers are creating targeted nutritional strategies for pcos-related infertility, which often leverage ingredients that improve insulin sensitivity. The growing body of evidence supporting antioxidant therapy for idiopathic male infertility has opened a significant sub-market, where demonstrating a measurable reduction in oxidative stress is a key differentiator.
  • The commercial viability of improving sperm motility with high-dose l-carnitine is now well-established, shifting focus toward bioavailability and synergistic formulations. A critical area of research is understanding how coq10 improves mitochondrial function in oocytes, with a direct correlation to clinical outcomes.
  • In fact, clinics recommending specific CoQ10 protocols report a 15% higher success rate in certain patient cohorts compared to those that do not. Furthermore, emerging research on managing endometriosis symptoms with nutritional supplements and understanding the impact of vitamin d levels on art outcomes is creating new avenues for innovation.
  • Ultimately, developing effective preconception supplements for reducing miscarriage risk and pioneering new dietary approaches to enhance ovarian reserve represent the next frontier for market leaders.

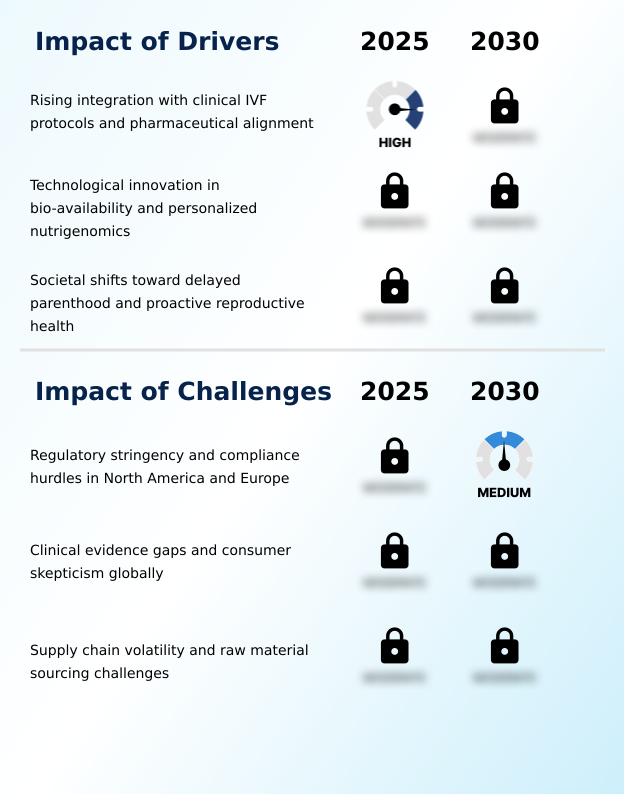
What are the key market drivers leading to the rise in the adoption of Fertility Supplements Industry?

  • A key market driver is the growing integration of fertility supplements with clinical in vitro fertilization (IVF) protocols and the corresponding alignment with the pharmaceutical sector.

  • A primary driver is the increasing clinical validation of evidence-based supplementation.
  • The use of clinical-grade ingredients like coenzyme q10 for fertility for mitochondrial function support is now standard in pre-IVF protocols, improving key success metrics by up to 15% in certain patient groups.
  • Formulations with high-dose l-carnitine for sperm health have demonstrated a 20% improvement in motility, driving demand for products targeting sperm morphology improvement.
  • Similarly, the effectiveness of the myo-inositol and d-chiro-inositol blend for oocyte quality improvement in specific patient populations has solidified its market position.
  • The integration of antioxidants like n-acetylcysteine for reproduction into mainstream protocols further underscores the shift from wellness products to essential therapeutic aids.

What are the market trends shaping the Fertility Supplements Industry?

  • A significant market trend is the emergence of male-centric fertility solutions. This development is coupled with the increasing destigmatization surrounding male reproductive health.

  • A major trend is the convergence of nutrigenomic personalization and direct-to-consumer technology. The use of at-home fertility testing integration to create personalized vitamin packs has led to a 40% increase in long-term customer subscriptions. These services focus on targeted goals like sperm motility enhancement and optimizing cellular energy production for better outcomes.
  • As an assisted reproductive technology (art) adjunct, these personalized supplements show an 18% improvement in specific biomarker profiles compared to off-the-shelf products. The demand for clean-label products is also surging, with brands offering non-gmo fertility formulas and vegan fertility supplements capturing a premium of up to 25% by appealing to health-conscious consumers seeking support for embryonic development support.

What challenges does the Fertility Supplements Industry face during its growth?

  • The market's growth faces a significant challenge from heightened regulatory stringency and complex compliance hurdles, especially within North America and Europe.

  • A significant challenge is navigating the complex and costly process of substantiating claims for reproductive health nutraceuticals. The requirement for third-party tested supplements and clean-label fertility products increases operational costs by 15-20%. While antioxidant-rich formulations containing ingredients like omega-3 fatty acids for reproduction are popular, proving their direct impact on endpoints such as egg maturation enhancement requires expensive clinical trials.
  • This is particularly true for demonstrating the precise role of follicular fluid micronutrients and gamete-supportive nutrients. Furthermore, widespread consumer confusion about nutrient roles, such as the importance of maintaining optimal levels of vitamin d and fertility, presents a marketing and educational hurdle for manufacturers, requiring an additional 10% budget allocation for consumer education initiatives.

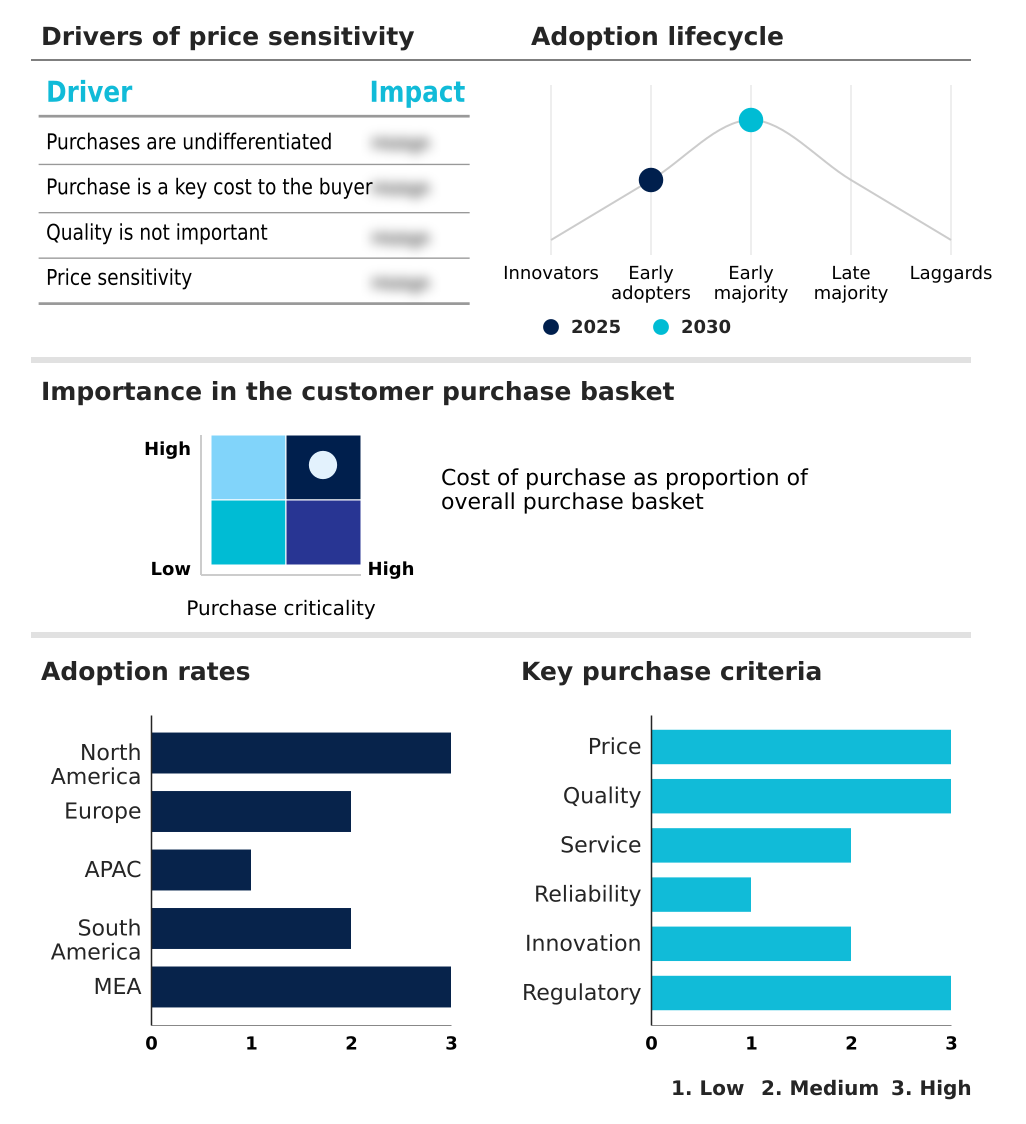
Exclusive Technavio Analysis on Customer Landscape

The fertility supplements market forecasting report includes the adoption lifecycle of the market, covering from the innovator’s stage to the laggard’s stage. It focuses on adoption rates in different regions based on penetration. Furthermore, the fertility supplements market report also includes key purchase criteria and drivers of price sensitivity to help companies evaluate and develop their market growth analysis strategies.

Customer Landscape of Fertility Supplements Industry

Competitive Landscape

Companies are implementing various strategies, such as strategic alliances, fertility supplements market forecast, partnerships, mergers and acquisitions, geographical expansion, and product/service launches, to enhance their presence in the industry.

Active Bio Life Science GmbH - Offerings center on clinical-grade nutraceuticals and evidence-based supplements designed to support hormonal balance and optimize fertility outcomes for both men and women.

The industry research and growth report includes detailed analyses of the competitive landscape of the market and information about key companies, including:

  • Active Bio Life Science GmbH
  • Bionova Lifesciences
  • Coast Science LLC
  • Elan Healthcare Inc.
  • Exeltis USA Inc.
  • Fairhaven Health LLC
  • Fertility Family
  • Fertility Nutraceuticals LLC
  • Fertypharm SL
  • FUJIFILM Irvine Scientific Inc.
  • Lenus Pharma GesmbH
  • Natural Fertility Shop
  • Nua Fertility Ltd.
  • Nutra Business LLC
  • Ocean Healthcare Pvt. Ltd.
  • Orthomol pharmazeutische GmbH
  • Shivani Scientific Industries
  • The Bird and Be Co. Inc.
  • TTK Healthcare Ltd.
  • Wild Nutrition Ltd.

Qualitative and quantitative analysis of companies has been conducted to help clients understand the wider business environment as well as the strengths and weaknesses of key industry players. Data is qualitatively analyzed to categorize companies as pure play, category-focused, industry-focused, and diversified; it is quantitatively analyzed to categorize companies as dominant, leading, strong, tentative, and weak.

Recent Development and News in Fertility supplements market

  • In November 2024, Fairhaven Health LLC announced an advanced male fertility supplement featuring a high-bioavailability form of L-carnitine, following positive clinical results on sperm motility.
  • In January 2025, Nestle Health Science initiated a strategic expansion of its Materna brand with the launch of new nutritional solutions in Latin America focused on preconception care.
  • In March 2025, leading wellness brands announced expanded distribution agreements with digital health platforms across the Asia-Pacific region to meet rising demand for myo-inositol formulations.
  • In April 2025, Nua Fertility Ltd. partnered with an AI health analytics platform to introduce a personalized subscription service that adjusts supplement dosages based on user biomarker data.

Dive into Technavio’s robust research methodology, blending expert interviews, extensive data synthesis, and validated models for unparalleled Fertility Supplements Market insights. See full methodology.

Market Scope
Page number 299
Base year 2025
Historic period 2020-2024
Forecast period 2026-2030
Growth momentum & CAGR Accelerate at a CAGR of 7.2%
Market growth 2026-2030 USD 878.2 million
Market structure Fragmented
YoY growth 2025-2026(%) 6.9%
Key countries US, Canada, Mexico, Germany, UK, France, Italy, Spain, The Netherlands, China, Japan, India, South Korea, Australia, Indonesia, Brazil, Argentina, Chile, Saudi Arabia, UAE, South Africa, Israel and Turkey
Competitive landscape Leading Companies, Market Positioning of Companies, Competitive Strategies, and Industry Risks

Request Free Sample

Research Analyst Overview

  • The fertility supplements market is defined by a decisive shift toward evidence-based supplementation, where reproductive health nutraceuticals are integral to clinical care. Boardroom strategies are now centered on R&D for oocyte quality improvement and sperm motility enhancement, moving beyond generic preconception nutritional support. A key trend is nutrigenomic personalization, tailoring antioxidant-rich formulations to individual needs for mitochondrial function support.
  • This requires significant investment in sourcing clinical-grade ingredients to ensure efficacy in areas like polycystic ovary syndrome (pcos) management and male fertility optimization. For instance, products that can demonstrate a quantifiable impact, such as a 20% improvement in key biomarkers for embryonic development support, gain significant traction.
  • This focus on measurable outcomes drives the need for sophisticated approaches to hormonal balance support and endocrine system regulation. Formulations are now engineered for specific goals, including sperm morphology improvement, dna fragmentation reduction, egg maturation enhancement, and ovarian reserve enhancement.
  • The market increasingly views these products as a crucial assisted reproductive technology (art) adjunct, leveraging gamete-supportive nutrients and reproductive microbiome modulation to optimize cellular energy production for overall female reproductive wellness.

What are the Key Data Covered in this Fertility Supplements Market Research and Growth Report?

  • What is the expected growth of the Fertility Supplements Market between 2026 and 2030?

    • USD 878.2 million, at a CAGR of 7.2%

  • What segmentation does the market report cover?

    • The report is segmented by End-user (Women, and Men), Form Factor (Capsules, Tablets, Gummies, Powders, and Others), Product Type (Herbal supplements, Vitamin-based, Mineral-based, Amino acids and antioxidants, and Probiotics) and Geography (North America, Europe, APAC, South America, Middle East and Africa)

  • Which regions are analyzed in the report?

    • North America, Europe, APAC, South America and Middle East and Africa

  • What are the key growth drivers and market challenges?

    • Rising integration with clinical IVF protocols and pharmaceutical alignment, Regulatory stringency and compliance hurdles in North America and Europe

  • Who are the major players in the Fertility Supplements Market?

    • Active Bio Life Science GmbH, Bionova Lifesciences, Coast Science LLC, Elan Healthcare Inc., Exeltis USA Inc., Fairhaven Health LLC, Fertility Family, Fertility Nutraceuticals LLC, Fertypharm SL, FUJIFILM Irvine Scientific Inc., Lenus Pharma GesmbH, Natural Fertility Shop, Nua Fertility Ltd., Nutra Business LLC, Ocean Healthcare Pvt. Ltd., Orthomol pharmazeutische GmbH, Shivani Scientific Industries, The Bird and Be Co. Inc., TTK Healthcare Ltd. and Wild Nutrition Ltd.

Market Research Insights

  • The market's dynamism is evident in the rapid adoption of specialized consumer-centric models. The shift towards personalized vitamin packs and subscription-based fertility services has improved customer retention by over 40% compared to traditional retail. The integration of at-home fertility testing integration with supplement recommendations has increased regimen adherence by 25%.
  • Formulations are also becoming more sophisticated; the use of coenzyme q10 for fertility and l-carnitine for sperm health in high-potency products is now standard.
  • Brands emphasizing clean-label fertility products and third-party tested supplements report a 15% higher premium on their average selling price, reflecting consumer demand for transparency and quality in a market increasingly influenced by informed choice and data-driven personalization.

We can help! Our analysts can customize this fertility supplements market research report to meet your requirements.

Get in touch

1. Executive Summary

1.1 Market overview

Executive Summary - Chart on Market Overview
Executive Summary - Data Table on Market Overview
Executive Summary - Chart on Global Market Characteristics
Executive Summary - Chart on Market by Geography
Executive Summary - Chart on Market Segmentation by End-user
Executive Summary - Chart on Market Segmentation by Form Factor
Executive Summary - Chart on Market Segmentation by Product Type
Executive Summary - Chart on Incremental Growth
Executive Summary - Data Table on Incremental Growth
Executive Summary - Chart on Company Market Positioning

2. Technavio Analysis

2.1 Analysis of price sensitivity, lifecycle, customer purchase basket, adoption rates, and purchase criteria

2.2 Criticality of inputs and Factors of differentiation

Chart on Overview on criticality of inputs and factors of differentiation

2.3 Factors of disruption

Chart on Overview on factors of disruption

2.4 Impact of drivers and challenges

Chart on Impact of drivers and challenges in 2025 and 2030

3. Market Landscape

3.1 Market ecosystem

Chart on Parent Market
Data Table on - Parent Market

3.2 Market characteristics

Chart on Market characteristics analysis

3.3 Value chain analysis

Chart on Value chain analysis

4. Market Sizing

4.1 Market definition

Data Table on Offerings of companies included in the market definition

4.2 Market segment analysis

Market segments

4.3 Market size 2025

4.4 Market outlook: Forecast for 2025-2030

Chart on Global - Market size and forecast 2025-2030 ($ million)
Data Table on Global - Market size and forecast 2025-2030 ($ million)
Chart on Global Market: Year-over-year growth 2025-2030 (%)
Data Table on Global Market: Year-over-year growth 2025-2030 (%)

5. Historic Market Size

5.1 Global Fertility Supplements Market 2020 - 2024

Historic Market Size - Data Table on Global Fertility Supplements Market 2020 - 2024 ($ million)

5.2 End-user segment analysis 2020 - 2024

Historic Market Size - End-user Segment 2020 - 2024 ($ million)

5.3 Form Factor segment analysis 2020 - 2024

Historic Market Size - Form Factor Segment 2020 - 2024 ($ million)

5.4 Product Type segment analysis 2020 - 2024

Historic Market Size - Product Type Segment 2020 - 2024 ($ million)

5.5 Geography segment analysis 2020 - 2024

Historic Market Size - Geography Segment 2020 - 2024 ($ million)

5.6 Country segment analysis 2020 - 2024

Historic Market Size - Country Segment 2020 - 2024 ($ million)

6. Qualitative Analysis

6.1 Impact of AI in Global Fertility Supplements Market

6.2 Impact of Geopolitical Conflict for Global Fertility Supplements Market

7. Five Forces Analysis

7.1 Five forces summary

Five forces analysis - Comparison between 2025 and 2030

7.2 Bargaining power of buyers

Bargaining power of buyers - Impact of key factors 2025 and 2030

7.3 Bargaining power of suppliers

Bargaining power of suppliers - Impact of key factors in 2025 and 2030

7.4 Threat of new entrants

Threat of new entrants - Impact of key factors in 2025 and 2030

7.5 Threat of substitutes

Threat of substitutes - Impact of key factors in 2025 and 2030

7.6 Threat of rivalry

Threat of rivalry - Impact of key factors in 2025 and 2030

7.7 Market condition

Chart on Market condition - Five forces 2025 and 2030

8. Market Segmentation by End-user

8.1 Market segments

Chart on End-user - Market share 2025-2030 (%)
Data Table on End-user - Market share 2025-2030 (%)

8.2 Comparison by End-user

Chart on Comparison by End-user
Data Table on Comparison by End-user

8.3 Women - Market size and forecast 2025-2030

Chart on Women - Market size and forecast 2025-2030 ($ million)
Data Table on Women - Market size and forecast 2025-2030 ($ million)
Chart on Women - Year-over-year growth 2025-2030 (%)
Data Table on Women - Year-over-year growth 2025-2030 (%)

8.4 Men - Market size and forecast 2025-2030

Chart on Men - Market size and forecast 2025-2030 ($ million)
Data Table on Men - Market size and forecast 2025-2030 ($ million)
Chart on Men - Year-over-year growth 2025-2030 (%)
Data Table on Men - Year-over-year growth 2025-2030 (%)

8.5 Market opportunity by End-user

Market opportunity by End-user ($ million)
Data Table on Market opportunity by End-user ($ million)

9. Market Segmentation by Form Factor

9.1 Market segments

Chart on Form Factor - Market share 2025-2030 (%)
Data Table on Form Factor - Market share 2025-2030 (%)

9.2 Comparison by Form Factor

Chart on Comparison by Form Factor
Data Table on Comparison by Form Factor

9.3 Capsules - Market size and forecast 2025-2030

Chart on Capsules - Market size and forecast 2025-2030 ($ million)
Data Table on Capsules - Market size and forecast 2025-2030 ($ million)
Chart on Capsules - Year-over-year growth 2025-2030 (%)
Data Table on Capsules - Year-over-year growth 2025-2030 (%)

9.4 Tablets - Market size and forecast 2025-2030

Chart on Tablets - Market size and forecast 2025-2030 ($ million)
Data Table on Tablets - Market size and forecast 2025-2030 ($ million)
Chart on Tablets - Year-over-year growth 2025-2030 (%)
Data Table on Tablets - Year-over-year growth 2025-2030 (%)

9.5 Gummies - Market size and forecast 2025-2030

Chart on Gummies - Market size and forecast 2025-2030 ($ million)
Data Table on Gummies - Market size and forecast 2025-2030 ($ million)
Chart on Gummies - Year-over-year growth 2025-2030 (%)
Data Table on Gummies - Year-over-year growth 2025-2030 (%)

9.6 Powders - Market size and forecast 2025-2030

Chart on Powders - Market size and forecast 2025-2030 ($ million)
Data Table on Powders - Market size and forecast 2025-2030 ($ million)
Chart on Powders - Year-over-year growth 2025-2030 (%)
Data Table on Powders - Year-over-year growth 2025-2030 (%)

9.7 Others - Market size and forecast 2025-2030

Chart on Others - Market size and forecast 2025-2030 ($ million)
Data Table on Others - Market size and forecast 2025-2030 ($ million)
Chart on Others - Year-over-year growth 2025-2030 (%)
Data Table on Others - Year-over-year growth 2025-2030 (%)

9.8 Market opportunity by Form Factor

Market opportunity by Form Factor ($ million)
Data Table on Market opportunity by Form Factor ($ million)

10. Market Segmentation by Product Type

10.1 Market segments

Chart on Product Type - Market share 2025-2030 (%)
Data Table on Product Type - Market share 2025-2030 (%)

10.2 Comparison by Product Type

Chart on Comparison by Product Type
Data Table on Comparison by Product Type

10.3 Herbal supplements - Market size and forecast 2025-2030

Chart on Herbal supplements - Market size and forecast 2025-2030 ($ million)
Data Table on Herbal supplements - Market size and forecast 2025-2030 ($ million)
Chart on Herbal supplements - Year-over-year growth 2025-2030 (%)
Data Table on Herbal supplements - Year-over-year growth 2025-2030 (%)

10.4 Vitamin-based - Market size and forecast 2025-2030

Chart on Vitamin-based - Market size and forecast 2025-2030 ($ million)
Data Table on Vitamin-based - Market size and forecast 2025-2030 ($ million)
Chart on Vitamin-based - Year-over-year growth 2025-2030 (%)
Data Table on Vitamin-based - Year-over-year growth 2025-2030 (%)

10.5 Mineral-based - Market size and forecast 2025-2030

Chart on Mineral-based - Market size and forecast 2025-2030 ($ million)
Data Table on Mineral-based - Market size and forecast 2025-2030 ($ million)
Chart on Mineral-based - Year-over-year growth 2025-2030 (%)
Data Table on Mineral-based - Year-over-year growth 2025-2030 (%)

10.6 Amino acids and antioxidants - Market size and forecast 2025-2030

Chart on Amino acids and antioxidants - Market size and forecast 2025-2030 ($ million)
Data Table on Amino acids and antioxidants - Market size and forecast 2025-2030 ($ million)
Chart on Amino acids and antioxidants - Year-over-year growth 2025-2030 (%)
Data Table on Amino acids and antioxidants - Year-over-year growth 2025-2030 (%)

10.7 Probiotics - Market size and forecast 2025-2030

Chart on Probiotics - Market size and forecast 2025-2030 ($ million)
Data Table on Probiotics - Market size and forecast 2025-2030 ($ million)
Chart on Probiotics - Year-over-year growth 2025-2030 (%)
Data Table on Probiotics - Year-over-year growth 2025-2030 (%)

10.8 Market opportunity by Product Type

Market opportunity by Product Type ($ million)
Data Table on Market opportunity by Product Type ($ million)

11. Customer Landscape

11.1 Customer landscape overview

Analysis of price sensitivity, lifecycle, customer purchase basket, adoption rates, and purchase criteria

12. Geographic Landscape

12.1 Geographic segmentation

Chart on Market share by geography 2025-2030 (%)
Data Table on Market share by geography 2025-2030 (%)

12.2 Geographic comparison

Chart on Geographic comparison
Data Table on Geographic comparison

12.3 North America - Market size and forecast 2025-2030

Chart on North America - Market size and forecast 2025-2030 ($ million)
Data Table on North America - Market size and forecast 2025-2030 ($ million)
Chart on North America - Year-over-year growth 2025-2030 (%)
Data Table on North America - Year-over-year growth 2025-2030 (%)
Chart on Regional Comparison - North America
Data Table on Regional Comparison - North America

12.3.1 US - Market size and forecast 2025-2030

Chart on US - Market size and forecast 2025-2030 ($ million)
Data Table on US - Market size and forecast 2025-2030 ($ million)
Chart on US - Year-over-year growth 2025-2030 (%)
Data Table on US - Year-over-year growth 2025-2030 (%)

12.3.2 Canada - Market size and forecast 2025-2030

Chart on Canada - Market size and forecast 2025-2030 ($ million)
Data Table on Canada - Market size and forecast 2025-2030 ($ million)
Chart on Canada - Year-over-year growth 2025-2030 (%)
Data Table on Canada - Year-over-year growth 2025-2030 (%)

12.3.3 Mexico - Market size and forecast 2025-2030

Chart on Mexico - Market size and forecast 2025-2030 ($ million)
Data Table on Mexico - Market size and forecast 2025-2030 ($ million)
Chart on Mexico - Year-over-year growth 2025-2030 (%)
Data Table on Mexico - Year-over-year growth 2025-2030 (%)

12.4 Europe - Market size and forecast 2025-2030

Chart on Europe - Market size and forecast 2025-2030 ($ million)
Data Table on Europe - Market size and forecast 2025-2030 ($ million)
Chart on Europe - Year-over-year growth 2025-2030 (%)
Data Table on Europe - Year-over-year growth 2025-2030 (%)
Chart on Regional Comparison - Europe
Data Table on Regional Comparison - Europe

12.4.1 Germany - Market size and forecast 2025-2030

Chart on Germany - Market size and forecast 2025-2030 ($ million)
Data Table on Germany - Market size and forecast 2025-2030 ($ million)
Chart on Germany - Year-over-year growth 2025-2030 (%)
Data Table on Germany - Year-over-year growth 2025-2030 (%)

12.4.2 UK - Market size and forecast 2025-2030

Chart on UK - Market size and forecast 2025-2030 ($ million)
Data Table on UK - Market size and forecast 2025-2030 ($ million)
Chart on UK - Year-over-year growth 2025-2030 (%)
Data Table on UK - Year-over-year growth 2025-2030 (%)

12.4.3 France - Market size and forecast 2025-2030

Chart on France - Market size and forecast 2025-2030 ($ million)
Data Table on France - Market size and forecast 2025-2030 ($ million)
Chart on France - Year-over-year growth 2025-2030 (%)
Data Table on France - Year-over-year growth 2025-2030 (%)

12.4.4 Italy - Market size and forecast 2025-2030

Chart on Italy - Market size and forecast 2025-2030 ($ million)
Data Table on Italy - Market size and forecast 2025-2030 ($ million)
Chart on Italy - Year-over-year growth 2025-2030 (%)
Data Table on Italy - Year-over-year growth 2025-2030 (%)

12.4.5 Spain - Market size and forecast 2025-2030

Chart on Spain - Market size and forecast 2025-2030 ($ million)
Data Table on Spain - Market size and forecast 2025-2030 ($ million)
Chart on Spain - Year-over-year growth 2025-2030 (%)
Data Table on Spain - Year-over-year growth 2025-2030 (%)

12.4.6 The Netherlands - Market size and forecast 2025-2030

Chart on The Netherlands - Market size and forecast 2025-2030 ($ million)
Data Table on The Netherlands - Market size and forecast 2025-2030 ($ million)
Chart on The Netherlands - Year-over-year growth 2025-2030 (%)
Data Table on The Netherlands - Year-over-year growth 2025-2030 (%)

12.5 APAC - Market size and forecast 2025-2030

Chart on APAC - Market size and forecast 2025-2030 ($ million)
Data Table on APAC - Market size and forecast 2025-2030 ($ million)
Chart on APAC - Year-over-year growth 2025-2030 (%)
Data Table on APAC - Year-over-year growth 2025-2030 (%)
Chart on Regional Comparison - APAC
Data Table on Regional Comparison - APAC

12.5.1 China - Market size and forecast 2025-2030

Chart on China - Market size and forecast 2025-2030 ($ million)
Data Table on China - Market size and forecast 2025-2030 ($ million)
Chart on China - Year-over-year growth 2025-2030 (%)
Data Table on China - Year-over-year growth 2025-2030 (%)

12.5.2 Japan - Market size and forecast 2025-2030

Chart on Japan - Market size and forecast 2025-2030 ($ million)
Data Table on Japan - Market size and forecast 2025-2030 ($ million)
Chart on Japan - Year-over-year growth 2025-2030 (%)
Data Table on Japan - Year-over-year growth 2025-2030 (%)

12.5.3 India - Market size and forecast 2025-2030

Chart on India - Market size and forecast 2025-2030 ($ million)
Data Table on India - Market size and forecast 2025-2030 ($ million)
Chart on India - Year-over-year growth 2025-2030 (%)
Data Table on India - Year-over-year growth 2025-2030 (%)

12.5.4 South Korea - Market size and forecast 2025-2030

Chart on South Korea - Market size and forecast 2025-2030 ($ million)
Data Table on South Korea - Market size and forecast 2025-2030 ($ million)
Chart on South Korea - Year-over-year growth 2025-2030 (%)
Data Table on South Korea - Year-over-year growth 2025-2030 (%)

12.5.5 Australia - Market size and forecast 2025-2030

Chart on Australia - Market size and forecast 2025-2030 ($ million)
Data Table on Australia - Market size and forecast 2025-2030 ($ million)
Chart on Australia - Year-over-year growth 2025-2030 (%)
Data Table on Australia - Year-over-year growth 2025-2030 (%)

12.5.6 Indonesia - Market size and forecast 2025-2030

Chart on Indonesia - Market size and forecast 2025-2030 ($ million)
Data Table on Indonesia - Market size and forecast 2025-2030 ($ million)
Chart on Indonesia - Year-over-year growth 2025-2030 (%)
Data Table on Indonesia - Year-over-year growth 2025-2030 (%)

12.6 South America - Market size and forecast 2025-2030

Chart on South America - Market size and forecast 2025-2030 ($ million)
Data Table on South America - Market size and forecast 2025-2030 ($ million)
Chart on South America - Year-over-year growth 2025-2030 (%)
Data Table on South America - Year-over-year growth 2025-2030 (%)
Chart on Regional Comparison - South America
Data Table on Regional Comparison - South America

12.6.1 Brazil - Market size and forecast 2025-2030

Chart on Brazil - Market size and forecast 2025-2030 ($ million)
Data Table on Brazil - Market size and forecast 2025-2030 ($ million)
Chart on Brazil - Year-over-year growth 2025-2030 (%)
Data Table on Brazil - Year-over-year growth 2025-2030 (%)

12.6.2 Argentina - Market size and forecast 2025-2030

Chart on Argentina - Market size and forecast 2025-2030 ($ million)
Data Table on Argentina - Market size and forecast 2025-2030 ($ million)
Chart on Argentina - Year-over-year growth 2025-2030 (%)
Data Table on Argentina - Year-over-year growth 2025-2030 (%)

12.6.3 Chile - Market size and forecast 2025-2030

Chart on Chile - Market size and forecast 2025-2030 ($ million)
Data Table on Chile - Market size and forecast 2025-2030 ($ million)
Chart on Chile - Year-over-year growth 2025-2030 (%)
Data Table on Chile - Year-over-year growth 2025-2030 (%)

12.7 Middle East and Africa - Market size and forecast 2025-2030

Chart on Middle East and Africa - Market size and forecast 2025-2030 ($ million)
Data Table on Middle East and Africa - Market size and forecast 2025-2030 ($ million)
Chart on Middle East and Africa - Year-over-year growth 2025-2030 (%)
Data Table on Middle East and Africa - Year-over-year growth 2025-2030 (%)
Chart on Regional Comparison - Middle East and Africa
Data Table on Regional Comparison - Middle East and Africa

12.7.1 Saudi Arabia - Market size and forecast 2025-2030

Chart on Saudi Arabia - Market size and forecast 2025-2030 ($ million)
Data Table on Saudi Arabia - Market size and forecast 2025-2030 ($ million)
Chart on Saudi Arabia - Year-over-year growth 2025-2030 (%)
Data Table on Saudi Arabia - Year-over-year growth 2025-2030 (%)

12.7.2 UAE - Market size and forecast 2025-2030

Chart on UAE - Market size and forecast 2025-2030 ($ million)
Data Table on UAE - Market size and forecast 2025-2030 ($ million)
Chart on UAE - Year-over-year growth 2025-2030 (%)
Data Table on UAE - Year-over-year growth 2025-2030 (%)

12.7.3 South Africa - Market size and forecast 2025-2030

Chart on South Africa - Market size and forecast 2025-2030 ($ million)
Data Table on South Africa - Market size and forecast 2025-2030 ($ million)
Chart on South Africa - Year-over-year growth 2025-2030 (%)
Data Table on South Africa - Year-over-year growth 2025-2030 (%)

12.7.4 Israel - Market size and forecast 2025-2030

Chart on Israel - Market size and forecast 2025-2030 ($ million)
Data Table on Israel - Market size and forecast 2025-2030 ($ million)
Chart on Israel - Year-over-year growth 2025-2030 (%)
Data Table on Israel - Year-over-year growth 2025-2030 (%)

12.7.5 Turkey - Market size and forecast 2025-2030

Chart on Turkey - Market size and forecast 2025-2030 ($ million)
Data Table on Turkey - Market size and forecast 2025-2030 ($ million)
Chart on Turkey - Year-over-year growth 2025-2030 (%)
Data Table on Turkey - Year-over-year growth 2025-2030 (%)

12.8 Market opportunity by geography

Market opportunity by geography ($ million)
Data Tables on Market opportunity by geography ($ million)

13. Drivers, Challenges, and Opportunity

13.1 Market drivers

Rising integration with clinical IVF protocols and pharmaceutical alignment
Technological innovation in bio-availability and personalized nutrigenomics
Societal shifts toward delayed parenthood and proactive reproductive health

13.2 Market challenges

Regulatory stringency and compliance hurdles in North America and Europe
Clinical evidence gaps and consumer skepticism globally
Supply chain volatility and raw material sourcing challenges

13.3 Impact of drivers and challenges

Impact of drivers and challenges in 2025 and 2030

13.4 Market opportunities

Rise of male-centric fertility solutions and destigmatization
Integration of fertility supplements into corporate wellness and insurance frameworks
Expansion of nutrigenomics and AI-driven supplementation

14. Competitive Landscape

14.1 Overview

14.2

Overview on criticality of inputs and factors of differentiation

14.3 Landscape disruption

Overview on factors of disruption

14.4 Industry risks

Impact of key risks on business

15. Competitive Analysis

15.1 Companies profiled

Companies covered

15.2 Company ranking index

15.3 Market positioning of companies

Matrix on companies position and classification

15.4 Active Bio Life Science GmbH

Active Bio Life Science GmbH - Overview
Active Bio Life Science GmbH - Product / Service
Active Bio Life Science GmbH - Key offerings
SWOT

15.5 Bionova Lifesciences

Bionova Lifesciences - Overview
Bionova Lifesciences - Product / Service
Bionova Lifesciences - Key offerings
SWOT

15.6 Coast Science LLC

Coast Science LLC - Overview
Coast Science LLC - Product / Service
Coast Science LLC - Key offerings
SWOT

15.7 Exeltis USA Inc.

Exeltis USA Inc. - Overview
Exeltis USA Inc. - Product / Service
Exeltis USA Inc. - Key offerings
SWOT

15.8 Fairhaven Health LLC

Fairhaven Health LLC - Overview
Fairhaven Health LLC - Product / Service
Fairhaven Health LLC - Key offerings
SWOT

15.9 Fertility Family

Fertility Family - Overview
Fertility Family - Product / Service
Fertility Family - Key offerings
SWOT

15.10 Fertility Nutraceuticals LLC

Fertility Nutraceuticals LLC - Overview
Fertility Nutraceuticals LLC - Product / Service
Fertility Nutraceuticals LLC - Key offerings
SWOT

15.11 FUJIFILM Irvine Scientific Inc.

FUJIFILM Irvine Scientific Inc. - Overview
FUJIFILM Irvine Scientific Inc. - Product / Service
FUJIFILM Irvine Scientific Inc. - Key offerings
SWOT

15.12 Lenus Pharma GesmbH

Lenus Pharma GesmbH - Overview
Lenus Pharma GesmbH - Product / Service
Lenus Pharma GesmbH - Key offerings
SWOT

15.13 Nua Fertility Ltd.

Nua Fertility Ltd. - Overview
Nua Fertility Ltd. - Product / Service
Nua Fertility Ltd. - Key offerings
SWOT

15.14 Ocean Healthcare Pvt. Ltd.

Ocean Healthcare Pvt. Ltd. - Overview
Ocean Healthcare Pvt. Ltd. - Product / Service
Ocean Healthcare Pvt. Ltd. - Key offerings
SWOT

15.15 Orthomol pharmazeutische GmbH

Orthomol pharmazeutische GmbH - Overview
Orthomol pharmazeutische GmbH - Product / Service
Orthomol pharmazeutische GmbH - Key offerings
SWOT

15.16 Shivani Scientific Industries

Shivani Scientific Industries - Overview
Shivani Scientific Industries - Product / Service
Shivani Scientific Industries - Key offerings
SWOT

15.17 The Bird and Be Co. Inc.

The Bird and Be Co. Inc. - Overview
The Bird and Be Co. Inc. - Product / Service
The Bird and Be Co. Inc. - Key offerings
SWOT

15.18 TTK Healthcare Ltd.

TTK Healthcare Ltd. - Overview
TTK Healthcare Ltd. - Business segments
TTK Healthcare Ltd. - Key offerings
TTK Healthcare Ltd. - Segment focus
SWOT

16. Appendix

16.1 Scope of the report

Market definition
Objectives
Notes and caveats

16.2 Inclusions and exclusions checklist

Inclusions checklist
Exclusions checklist

16.3 Currency conversion rates for US$

16.4 Research methodology

16.5 Data procurement

Information sources

16.6 Data validation

16.7 Validation techniques employed for market sizing

16.8 Data synthesis

16.9 360 degree market analysis

16.10 List of abbreviations

Research Methodology

Technavio presents a detailed picture of the market by way of study, synthesis, and summation of data from multiple sources. The analysts have presented the various facets of the market with a particular focus on identifying the key industry influencers. The data thus presented is comprehensive, reliable, and the result of extensive research, both primary and secondary.

INFORMATION SOURCES

Primary sources

  • Manufacturers and suppliers
  • Channel partners
  • Industry experts
  • Strategic decision makers

Secondary sources

  • Industry journals and periodicals
  • Government data
  • Financial reports of key industry players
  • Historical data
  • Press releases

DATA ANALYSIS

Data Synthesis

  • Collation of data
  • Estimation of key figures
  • Analysis of derived insights

Data Validation

  • Triangulation with data models
  • Reference against proprietary databases
  • Corroboration with industry experts

REPORT WRITING

Qualitative

  • Market drivers
  • Market challenges
  • Market trends
  • Five forces analysis

Quantitative

  • Market size and forecast
  • Market segmentation
  • Geographical insights
  • Competitive landscape

Interested in this report?

Get your sample now to see our research methodology and insights!

Download Now

Frequently Asked Questions

Fertility Supplements market growth will increase by USD 878.2 million during 2026-2030.

The Fertility Supplements market is expected to grow at a CAGR of 7.2% during 2026-2030.

Fertility Supplements market is segmented by End-user (Women, Men) Form factor (Capsules, Tablets, Gummies, Powders, Others) Product type (Herbal supplements, Vitamin-based, Mineral-based, Amino acids and antioxidants, Probiotics)

Active Bio Life Science GmbH, Bionova Lifesciences, Coast Science LLC, Elan Healthcare Inc., Exeltis USA Inc., Fairhaven Health LLC, Fertility Family, Fertility Nutraceuticals LLC, Fertypharm SL, FUJIFILM Irvine Scientific Inc., Lenus Pharma GesmbH, Natural Fertility Shop, Nua Fertility Ltd., Nutra Business LLC, Ocean Healthcare Pvt. Ltd., Orthomol pharmazeutische GmbH, Shivani Scientific Industries, The Bird and Be Co. Inc., TTK Healthcare Ltd., Wild Nutrition Ltd. are a few of the key vendors in the Fertility Supplements market.

North America will register the highest growth rate of 37.1% among the other regions. Therefore, the Fertility Supplements market in North America is expected to garner significant business opportunities for the vendors during the forecast period.

US, Canada, Mexico, Germany, UK, France, Italy, Spain, The Netherlands, China, Japan, India, South Korea, Australia, Indonesia, Brazil, Argentina, Chile, Saudi Arabia, UAE, South Africa, Israel, Turkey

  • Rising integration with clinical IVF protocols and pharmaceutical alignment is the driving factor this market.

The Fertility Supplements market vendors should focus on grabbing business opportunities from the End-user segment as it accounted for the largest market share in the base year.
RIA - Research AI Assistant
Ask RIA