Fiber Management Systems Market Analysis, Size, and Forecast 2026-2030: APAC (China, India, and Japan), North America (US, Canada, and Mexico), Europe (Germany, UK, and France), Middle East and Africa (UAE, Saudi Arabia, and South Africa), South America (Brazil, Argentina, and Colombia), and Rest of World (ROW)

Fiber Management Systems Market Analysis, Size, and Forecast 2026-2030:
APAC (China, India, and Japan), North America (US, Canada, and Mexico), Europe (Germany, UK, and France), Middle East and Africa (UAE, Saudi Arabia, and South Africa), South America (Brazil, Argentina, and Colombia), and Rest of World (ROW)

Published: Jan 2026 283 Pages SKU: IRTNTR74667

Market Overview at a Glance

$1.03 B
Market Opportunity
4.5%
CAGR 2025 - 2030
72%
APAC Growth
$2.19 B
Multi mode segment 2024

Fiber Management Systems Market Size 2026-2030

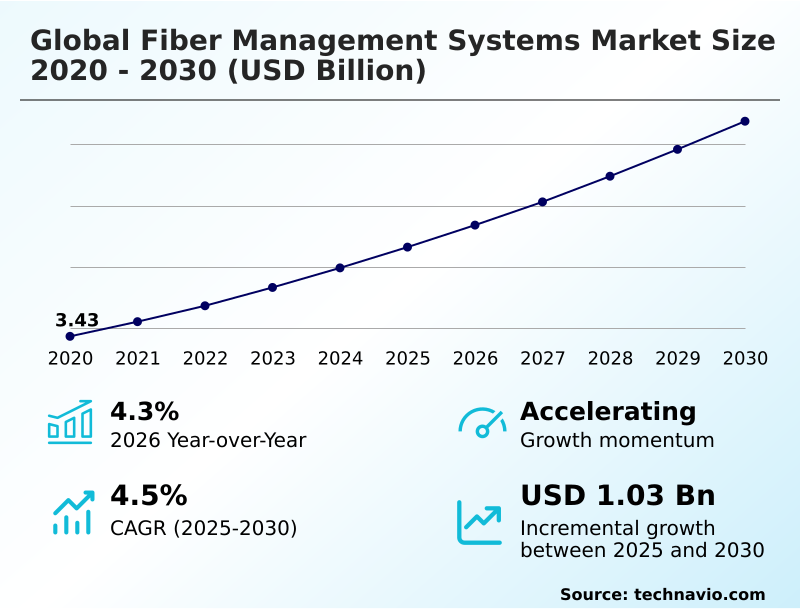
The fiber management systems market size is valued to increase by USD 1.03 billion, at a CAGR of 4.5% from 2025 to 2030. Rise in global internet traffic will drive the fiber management systems market.

Major Market Trends & Insights

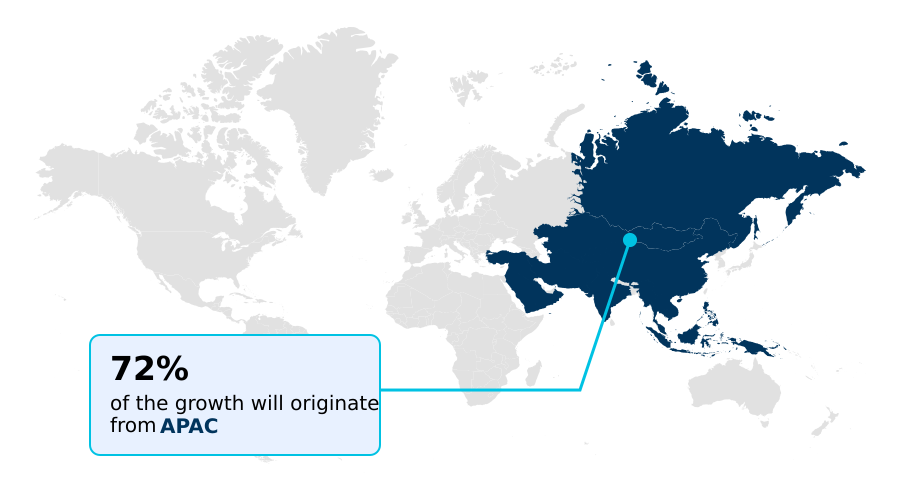
  • APAC dominated the market and accounted for a 72% growth during the forecast period.
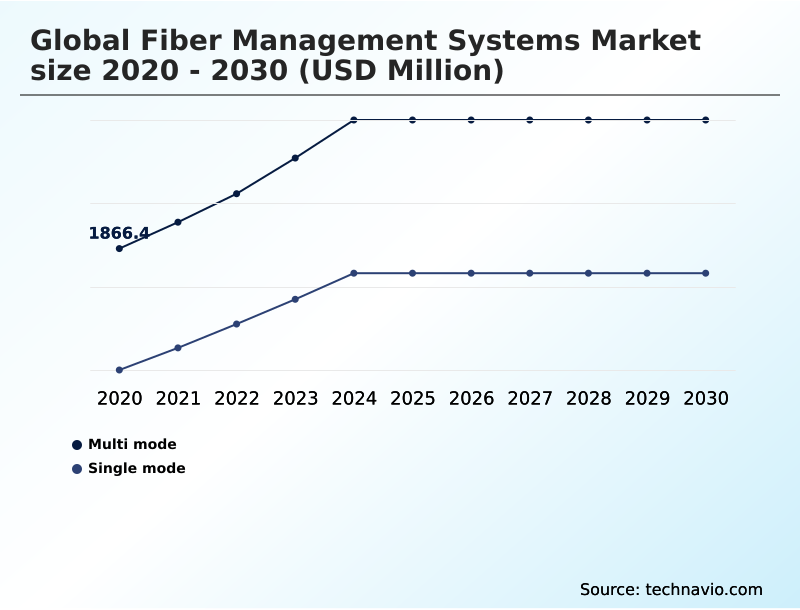
  • By Application - Multi mode segment was valued at USD 2.19 billion in 2024
  • By Product Type - Fiber optic patch panels segment accounted for the largest market revenue share in 2024

Market Size & Forecast

  • Market Opportunities: USD 1.76 billion
  • Market Future Opportunities: USD 1.03 billion
  • CAGR from 2025 to 2030 : 4.5%

Market Summary

  • The fiber management systems market is undergoing robust expansion, driven by the relentless global demand for faster, more reliable data transmission. This growth is propelled by the convergence of several powerful technological and infrastructural evolutions.
  • A primary impetus is the proliferation of artificial intelligence, which requires new hyperscale data centers engineered for massive parallel processing, demanding exceptionally high-density fiber optic interconnects. For instance, a telecommunications provider upgrading its network to support 5G advanced services must implement sophisticated fiber management to handle the dense fiber backhaul infrastructure.
  • This involves deploying advanced fiber distribution frames and automated remote fiber test systems to minimize downtime and manage increased cable density, ensuring signal integrity and operational efficiency. Concurrently, government-led initiatives to bridge the digital divide are accelerating Fiber to the Premises (FTTP) rollouts on a massive scale.
  • This network densification translates into a greater number of connection points, each requiring meticulous fiber management, underpinning the market’s structural shift toward a more connected and data-intensive world.

What will be the Size of the Fiber Management Systems Market during the forecast period?

Get Key Insights on Market Forecast (PDF) Request Free Sample

How is the Fiber Management Systems Market Segmented?

The fiber management systems industry research report provides comprehensive data (region-wise segment analysis), with forecasts and estimates in "USD million" for the period 2026-2030, as well as historical data from 2020-2024 for the following segments.

  • Application
    • Multi mode
    • Single mode
  • Product type
    • Fiber optic patch panels
    • Fiber distribution frames
    • Fiber enclosures
  • Component
    • Hardware
    • Software
    • Services
  • Geography
    • APAC
      • China
      • India
      • Japan
    • North America
      • US
      • Canada
      • Mexico
    • Europe
      • Germany
      • UK
      • France
    • Middle East and Africa
      • UAE
      • Saudi Arabia
      • South Africa
    • South America
      • Brazil
      • Argentina
      • Colombia
    • Rest of World (ROW)

By Application Insights

The multi mode segment is estimated to witness significant growth during the forecast period.

The multi mode fiber segment is driven by escalating short-distance data transmission requirements within hyperscale data centers and enterprise LANs. These environments demand structured cabling systems that support high-density data center interconnect configurations and frequent reconfigurations.

Effective cable management and cable routing solutions are essential for maintaining performance, ensuring proper bend radius is respected to prevent signal attenuation. The expansion of edge computing further stimulates demand for these solutions.

The implementation of advanced multi-mode structured cabling has been shown to improve operational efficiency by reducing reconfiguration time by over 20%, a critical metric for maintaining service uptime and enabling agile high-speed connectivity.

Request Free Sample

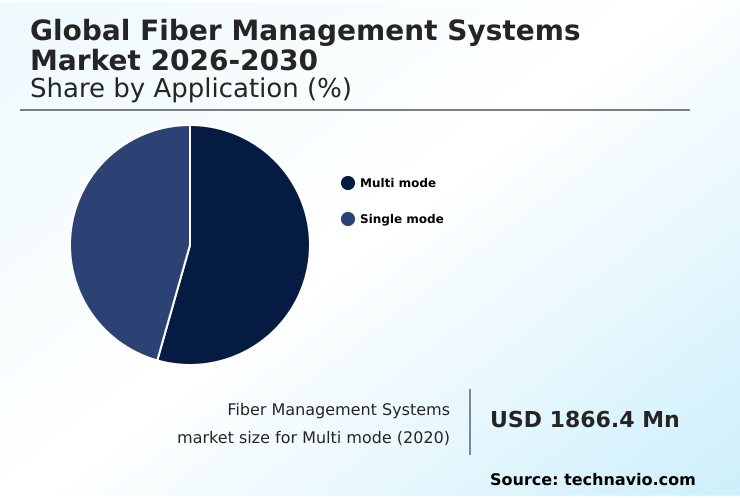
The Multi mode segment was valued at USD 2.19 billion in 2024 and showed a gradual increase during the forecast period.

Request Free Sample

Regional Analysis

APAC is estimated to contribute 72% to the growth of the global market during the forecast period.Technavio’s analysts have elaborately explained the regional trends and drivers that shape the market during the forecast period.

See How Fiber Management Systems Market Demand is Rising in APAC Request Free Sample

The geographic landscape is led by APAC, where growth is expanding at a rate nearly twice that of North America.

This expansion is fueled by massive government-led initiatives for broadband solutions and FTTH deployments, driving demand for components like fiber distribution frames, splice closures, and fiber access terminals.

Effective network planning is crucial for these large-scale projects, which aim to achieve near-universal connectivity and often involve complex data migration from legacy systems.

In contrast, North America and Europe focus on upgrading existing optical network infrastructure to support network densification for 5G and future all-optical switching capabilities.

These upgrades are critical, as some national broadband initiatives in APAC mandate solutions that reduce deployment costs by at least 20%. Across all regions, the goal remains building high-performance optical networks that ensure high network reliability.

Market Dynamics

Our researchers analyzed the data with 2025 as the base year, along with the key drivers, trends, and challenges. A holistic analysis of drivers will help companies refine their marketing strategies to gain a competitive advantage.

  • Strategic decision-making in network upgrades requires a deep understanding of the evolving landscape. Enterprises must evaluate the challenges in large-scale fiber to the home deployment while considering the cost-benefit analysis of intelligent patch panels. The impact of network densification on fiber management necessitates robust solutions, and security best practices for physical layer infrastructure are non-negotiable.
  • Adopting software for fiber optic network management and planning is critical for success. Firms that use such platforms report a 40% faster mean-time-to-repair compared to manual methods. This involves mastering splicing techniques for minimizing signal attenuation and understanding the ROI of upgrading to automated fiber management systems.
  • Key technology choices include evaluating modular fiber optic patch panel deployment benefits and structured cabling strategies for hyperscale data centers. Further considerations involve the deployment of fiber access terminals in rural broadband and managing bend radius in high-density fiber enclosures.
  • Success also hinges on optimizing signal integrity in multi mode fiber networks and utilizing an automated remote fiber test system for PON. As networks advance, troubleshooting P2P versus PON network faults becomes essential, alongside selecting ultra-high-density connectors for 6G infrastructure.
  • Advanced strategies even include robotic reconfiguration for data center interconnects and using OTDR for predictive maintenance in optical networks, supported by all-optical switching in core network architecture. Integrating geospatial software with fiber asset management and using cloud native platforms for mapping fiber networks are becoming standard.
  • Automating physical layer security alerts and responses and knowing the components of a complete fiber management hardware solution round out the necessary expertise.

What are the key market drivers leading to the rise in the adoption of Fiber Management Systems Industry?

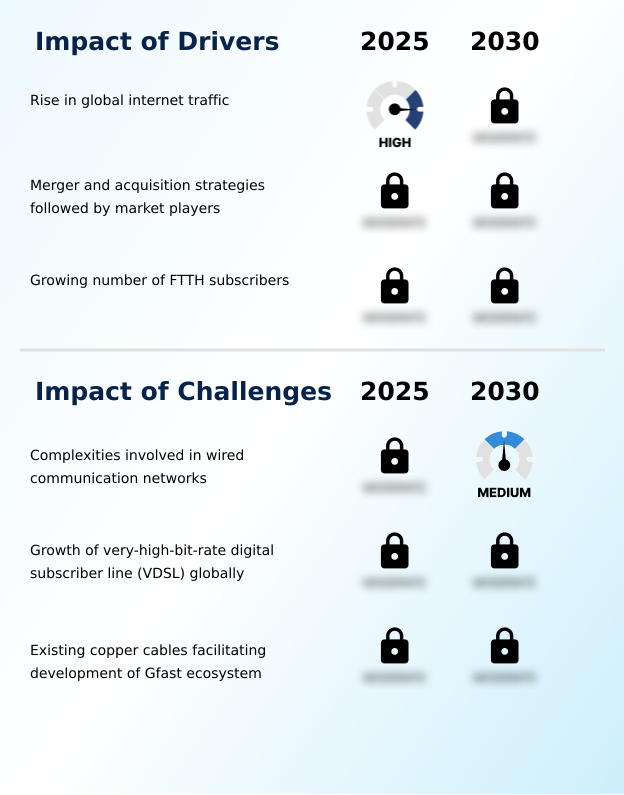
  • The rise in global internet traffic is a key driver for the market, compelling service providers to enhance their optical network infrastructure.

  • The unceasing rise in global bandwidth consumption is a fundamental driver, compelling service providers to expand and upgrade their network infrastructure. This includes extensive fiber backhaul deployments for 5G backhaul, utilizing both PON networks and P2P networks.
  • Efficiently managing this growth requires advanced optical distribution frames and precise splicing technique to maintain signal integrity. Investments in automated fiber management systems have been shown to accelerate network upgrade timelines by 30%.
  • Furthermore, integrating asset management software for tracking components like cable assemblies streamlines operations, with organizations reporting a 20% reduction in inventory discrepancies, which improves the accuracy of network monitoring.

What are the market trends shaping the Fiber Management Systems Industry?

  • The global proliferation of data centers is a transformative trend. This expansion drives significant demand for advanced fiber management systems to support high-density architectures.

  • A primary trend is the rapid proliferation of data centers, necessitating innovative high-density cabling solutions and modular fiber optic panels. The adoption of intelligent patch panels integrated with physical layer monitoring has enabled operators to reduce fault detection times by up to 40%.
  • This shift toward network automation is critical, with some advanced facilities exploring robotic reconfiguration using ultra-high-density connectors to dynamically allocate resources. This has led to a 15% improvement in resource utilization. The integration of predictive analytics within these systems allows for proactive maintenance, transforming passive fiber enclosures into active network assets.
  • This smart infrastructure is essential for service enablement, supporting next-generation applications.

What challenges does the Fiber Management Systems Industry face during its growth?

  • The inherent complexities of deploying and maintaining wired communication networks present a significant challenge to industry growth.

  • Significant challenges stem from the complexities of maintaining high-density wired networks, where even minor issues with fiber optic connectors or fiber optic adapters can disrupt high-speed connectivity. Without tools like a remote fiber test system for automated OTDR based monitoring, manual fault location processes can be 70% slower, severely impacting service enablement.
  • Moreover, ensuring physical layer security for thousands of connection points within fiber optic patch panels is a growing concern, as breaches can increase by 25% without proper monitoring. While a cloud native fibermap platform can aid in visualization, the physical management of components, including attenuators, remains a hands-on, intricate task requiring skilled technicians.

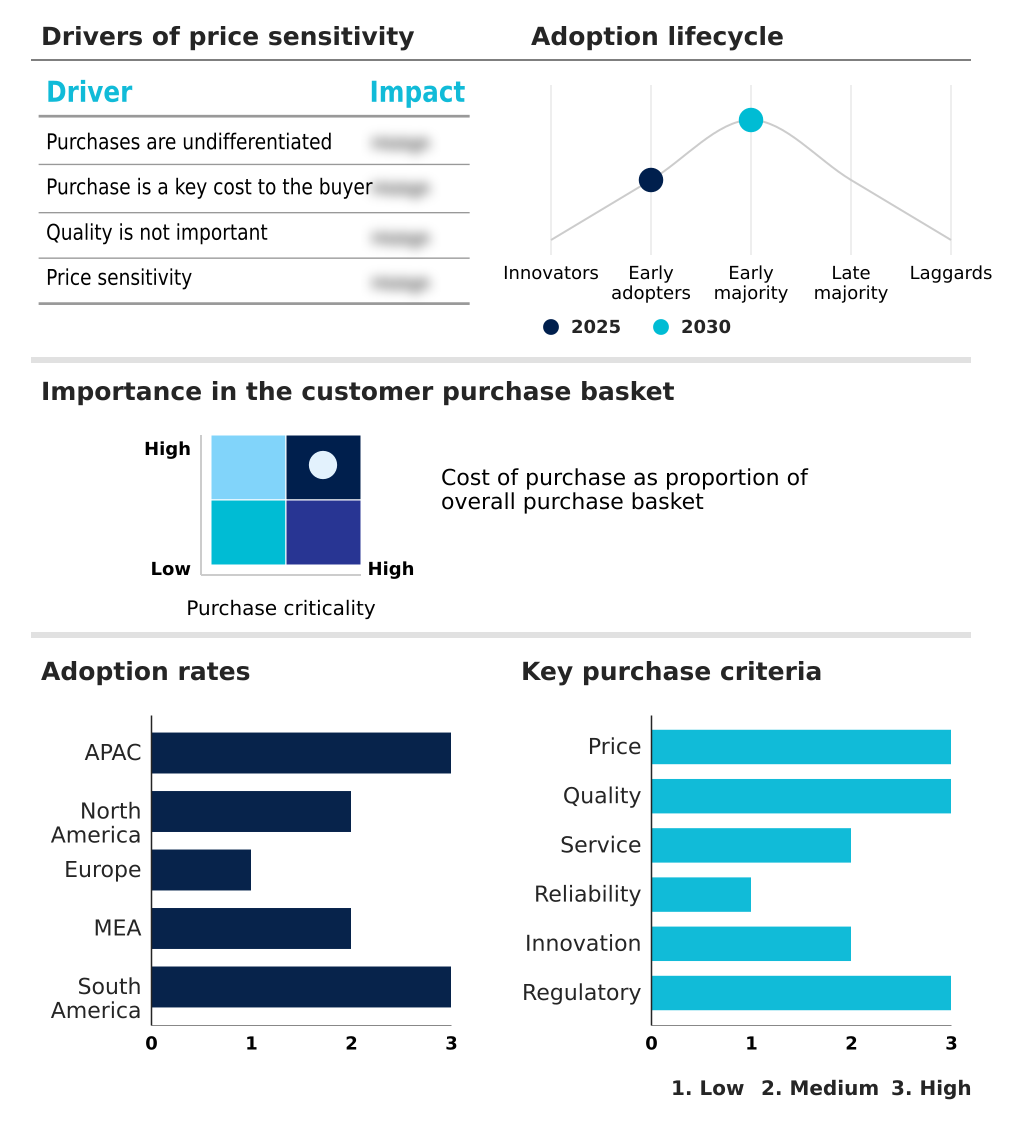
Exclusive Technavio Analysis on Customer Landscape

The fiber management systems market forecasting report includes the adoption lifecycle of the market, covering from the innovator’s stage to the laggard’s stage. It focuses on adoption rates in different regions based on penetration. Furthermore, the fiber management systems market report also includes key purchase criteria and drivers of price sensitivity to help companies evaluate and develop their market growth analysis strategies.

Customer Landscape of Fiber Management Systems Industry

Competitive Landscape

Companies are implementing various strategies, such as strategic alliances, fiber management systems market forecast, partnerships, mergers and acquisitions, geographical expansion, and product/service launches, to enhance their presence in the industry.

3M Co. - Automated remote fiber testing and real-time fault location are offered to ensure network integrity and scalability for both P2P and PON infrastructures.

The industry research and growth report includes detailed analyses of the competitive landscape of the market and information about key companies, including:

  • 3M Co.
  • Belden Inc.
  • Cisco Systems Inc.
  • Corning Inc.
  • Eaton Corp. Plc
  • GEOGRAPH Technologies LLC
  • IQGeo Group plc
  • JO Software Engineering GmbH
  • Lepton Software Pvt. Ltd.
  • Panduit Corp.
  • Patchmanager B.V.
  • Phoenix Contact GmbH and Co
  • Schneider Electric SE
  • Softelnet SA
  • SSP Innovations LLC
  • TE Connectivity Ltd.
  • VETRO Inc.
  • Viavi Solutions Inc.

Qualitative and quantitative analysis of companies has been conducted to help clients understand the wider business environment as well as the strengths and weaknesses of key industry players. Data is qualitatively analyzed to categorize companies as pure play, category-focused, industry-focused, and diversified; it is quantitatively analyzed to categorize companies as dominant, leading, strong, tentative, and weak.

Recent Development and News in Fiber management systems market

  • In August 2024, Corning Inc. announced a strategic partnership with a leading hyperscale data center operator to co-develop next-generation, high-density optical fiber cabling solutions designed to support AI workloads.
  • In November 2024, TE Connectivity Ltd. launched its new modular fiber optic patch panel system, engineered for rapid deployment and scalability in edge computing environments, reducing installation time by up to 25%.
  • In January 2025, Schneider Electric SE completed the acquisition of a specialized software firm focused on AI-driven network monitoring, integrating predictive analytics into its fiber management portfolio.
  • In May 2025, a European telecommunications consortium announced a joint initiative to standardize automated fiber management systems across member networks to accelerate 5G Advanced and early 6G rollouts.

Dive into Technavio’s robust research methodology, blending expert interviews, extensive data synthesis, and validated models for unparalleled Fiber Management Systems Market insights. See full methodology.

Market Scope
Page number 283
Base year 2025
Historic period 2020-2024
Forecast period 2026-2030
Growth momentum & CAGR Accelerate at a CAGR of 4.5%
Market growth 2026-2030 USD 1033.5 million
Market structure Fragmented
YoY growth 2025-2026(%) 4.3%
Key countries China, India, Japan, South Korea, Australia, Indonesia, US, Canada, Mexico, Germany, UK, France, Italy, Spain, The Netherlands, UAE, Saudi Arabia, South Africa, Egypt, Nigeria, Brazil, Argentina and Colombia
Competitive landscape Leading Companies, Market Positioning of Companies, Competitive Strategies, and Industry Risks

Request Free Sample

Research Analyst Overview

  • The market's evolution is defined by the strategic shift from passive components to intelligent, automated systems.
  • At the boardroom level, this trend forces a critical decision: balancing the significant capital expenditure on advanced hardware, such as a high-density centrix system, automated fiber management, and fiber optic patch panels, against the long-term operational savings from reduced manual intervention and enhanced network resilience.
  • The adoption of technologies like PON networks, P2P networks, and remote fiber test systems is no longer optional for competitive service providers. Deploying OTDR based monitoring has demonstrated a capacity to reduce truck rolls for fault identification by over 60%.
  • This efficiency gain is driving investment in comprehensive solutions encompassing everything from the underlying optical network infrastructure and structured cabling systems to specific components like splice trays and cable assemblies.
  • The push for higher density is met with innovations in modular fiber optic panels, cable routing solutions, ultra-high-density connectors, and robotic reconfiguration, all managed through sophisticated network automation to ensure physical layer security.

What are the Key Data Covered in this Fiber Management Systems Market Research and Growth Report?

  • What is the expected growth of the Fiber Management Systems Market between 2026 and 2030?

    • USD 1.03 billion, at a CAGR of 4.5%

  • What segmentation does the market report cover?

    • The report is segmented by Application (Multi mode, and Single mode), Product Type (Fiber optic patch panels, Fiber distribution frames, and Fiber enclosures), Component (Hardware, Software, and Services) and Geography (APAC, North America, Europe, Middle East and Africa, South America)

  • Which regions are analyzed in the report?

    • APAC, North America, Europe, Middle East and Africa and South America

  • What are the key growth drivers and market challenges?

    • Rise in global internet traffic, Complexities involved in wired communication networks

  • Who are the major players in the Fiber Management Systems Market?

    • 3M Co., Belden Inc., Cisco Systems Inc., Corning Inc., Eaton Corp. Plc, GEOGRAPH Technologies LLC, IQGeo Group plc, JO Software Engineering GmbH, Lepton Software Pvt. Ltd., Panduit Corp., Patchmanager B.V., Phoenix Contact GmbH and Co, Schneider Electric SE, Softelnet SA, SSP Innovations LLC, TE Connectivity Ltd., VETRO Inc. and Viavi Solutions Inc.

Market Research Insights

  • Market dynamics are shaped by the critical need for enhanced network infrastructure and operational efficiency in managing high-speed connectivity. The strategic implementation of a cloud native fibermap platform enables operators to improve network planning accuracy by over 25%. Concurrently, deploying industrial ethernet switch technology within automated systems improves data transmission reliability.
  • As demands on broadband solutions grow, so does the focus on maintaining signal integrity, where advanced physical layer monitoring can decrease network downtime by up to 40%. The integration of end-to-end geospatial software and asset management software provides a holistic view of the network, further boosting efficiency.
  • For instance, firms adopting automated cable management systems report technician error rates falling by more than 30%, directly impacting network reliability and service quality.

We can help! Our analysts can customize this fiber management systems market research report to meet your requirements.

Get in touch

1. Executive Summary

1.1 Market overview

Executive Summary - Chart on Market Overview
Executive Summary - Data Table on Market Overview
Executive Summary - Chart on Global Market Characteristics
Executive Summary - Chart on Market by Geography
Executive Summary - Chart on Market Segmentation by Application
Executive Summary - Chart on Market Segmentation by Product Type
Executive Summary - Chart on Market Segmentation by Component
Executive Summary - Chart on Incremental Growth
Executive Summary - Data Table on Incremental Growth
Executive Summary - Chart on Company Market Positioning

2. Technavio Analysis

2.1 Analysis of price sensitivity, lifecycle, customer purchase basket, adoption rates, and purchase criteria

2.2 Criticality of inputs and Factors of differentiation

Chart on Overview on criticality of inputs and factors of differentiation

2.3 Factors of disruption

Chart on Overview on factors of disruption

2.4 Impact of drivers and challenges

Chart on Impact of drivers and challenges in 2025 and 2030

3. Market Landscape

3.1 Market ecosystem

Chart on Parent Market
Data Table on - Parent Market

3.2 Market characteristics

Chart on Market characteristics analysis

3.3 Value chain analysis

Chart on Value chain analysis

4. Market Sizing

4.1 Market definition

Data Table on Offerings of companies included in the market definition

4.2 Market segment analysis

Market segments

4.3 Market size 2025

4.4 Market outlook: Forecast for 2025-2030

Chart on Global - Market size and forecast 2025-2030 ($ million)
Data Table on Global - Market size and forecast 2025-2030 ($ million)
Chart on Global Market: Year-over-year growth 2025-2030 (%)
Data Table on Global Market: Year-over-year growth 2025-2030 (%)

5. Historic Market Size

5.1 Global Fiber Management Systems Market 2020 - 2024

Historic Market Size - Data Table on Global Fiber Management Systems Market 2020 - 2024 ($ million)

5.2 Application segment analysis 2020 - 2024

Historic Market Size - Application Segment 2020 - 2024 ($ million)

5.3 Product Type segment analysis 2020 - 2024

Historic Market Size - Product Type Segment 2020 - 2024 ($ million)

5.4 Component segment analysis 2020 - 2024

Historic Market Size - Component Segment 2020 - 2024 ($ million)

5.5 Geography segment analysis 2020 - 2024

Historic Market Size - Geography Segment 2020 - 2024 ($ million)

5.6 Country segment analysis 2020 - 2024

Historic Market Size - Country Segment 2020 - 2024 ($ million)

6. Qualitative Analysis

6.1 The AI impact on Global Fiber Management Systems Market

7. Five Forces Analysis

7.1 Five forces summary

Five forces analysis - Comparison between 2025 and 2030

7.2 Bargaining power of buyers

Bargaining power of buyers - Impact of key factors 2025 and 2030

7.3 Bargaining power of suppliers

Bargaining power of suppliers - Impact of key factors in 2025 and 2030

7.4 Threat of new entrants

Threat of new entrants - Impact of key factors in 2025 and 2030

7.5 Threat of substitutes

Threat of substitutes - Impact of key factors in 2025 and 2030

7.6 Threat of rivalry

Threat of rivalry - Impact of key factors in 2025 and 2030

7.7 Market condition

Chart on Market condition - Five forces 2025 and 2030

8. Market Segmentation by Application

8.1 Market segments

Chart on Application - Market share 2025-2030 (%)
Data Table on Application - Market share 2025-2030 (%)

8.2 Comparison by Application

Chart on Comparison by Application
Data Table on Comparison by Application

8.3 Multi mode - Market size and forecast 2025-2030

Chart on Multi mode - Market size and forecast 2025-2030 ($ million)
Data Table on Multi mode - Market size and forecast 2025-2030 ($ million)
Chart on Multi mode - Year-over-year growth 2025-2030 (%)
Data Table on Multi mode - Year-over-year growth 2025-2030 (%)

8.4 Single mode - Market size and forecast 2025-2030

Chart on Single mode - Market size and forecast 2025-2030 ($ million)
Data Table on Single mode - Market size and forecast 2025-2030 ($ million)
Chart on Single mode - Year-over-year growth 2025-2030 (%)
Data Table on Single mode - Year-over-year growth 2025-2030 (%)

8.5 Market opportunity by Application

Market opportunity by Application ($ million)
Data Table on Market opportunity by Application ($ million)

9. Market Segmentation by Product Type

9.1 Market segments

Chart on Product Type - Market share 2025-2030 (%)
Data Table on Product Type - Market share 2025-2030 (%)

9.2 Comparison by Product Type

Chart on Comparison by Product Type
Data Table on Comparison by Product Type

9.3 Fiber optic patch panels - Market size and forecast 2025-2030

Chart on Fiber optic patch panels - Market size and forecast 2025-2030 ($ million)
Data Table on Fiber optic patch panels - Market size and forecast 2025-2030 ($ million)
Chart on Fiber optic patch panels - Year-over-year growth 2025-2030 (%)
Data Table on Fiber optic patch panels - Year-over-year growth 2025-2030 (%)

9.4 Fiber distribution frames - Market size and forecast 2025-2030

Chart on Fiber distribution frames - Market size and forecast 2025-2030 ($ million)
Data Table on Fiber distribution frames - Market size and forecast 2025-2030 ($ million)
Chart on Fiber distribution frames - Year-over-year growth 2025-2030 (%)
Data Table on Fiber distribution frames - Year-over-year growth 2025-2030 (%)

9.5 Fiber enclosures - Market size and forecast 2025-2030

Chart on Fiber enclosures - Market size and forecast 2025-2030 ($ million)
Data Table on Fiber enclosures - Market size and forecast 2025-2030 ($ million)
Chart on Fiber enclosures - Year-over-year growth 2025-2030 (%)
Data Table on Fiber enclosures - Year-over-year growth 2025-2030 (%)

9.6 Market opportunity by Product Type

Market opportunity by Product Type ($ million)
Data Table on Market opportunity by Product Type ($ million)

10. Market Segmentation by Component

10.1 Market segments

Chart on Component - Market share 2025-2030 (%)
Data Table on Component - Market share 2025-2030 (%)

10.2 Comparison by Component

Chart on Comparison by Component
Data Table on Comparison by Component

10.3 Hardware - Market size and forecast 2025-2030

Chart on Hardware - Market size and forecast 2025-2030 ($ million)
Data Table on Hardware - Market size and forecast 2025-2030 ($ million)
Chart on Hardware - Year-over-year growth 2025-2030 (%)
Data Table on Hardware - Year-over-year growth 2025-2030 (%)

10.4 Software - Market size and forecast 2025-2030

Chart on Software - Market size and forecast 2025-2030 ($ million)
Data Table on Software - Market size and forecast 2025-2030 ($ million)
Chart on Software - Year-over-year growth 2025-2030 (%)
Data Table on Software - Year-over-year growth 2025-2030 (%)

10.5 Services - Market size and forecast 2025-2030

Chart on Services - Market size and forecast 2025-2030 ($ million)
Data Table on Services - Market size and forecast 2025-2030 ($ million)
Chart on Services - Year-over-year growth 2025-2030 (%)
Data Table on Services - Year-over-year growth 2025-2030 (%)

10.6 Market opportunity by Component

Market opportunity by Component ($ million)
Data Table on Market opportunity by Component ($ million)

11. Customer Landscape

11.1 Customer landscape overview

Analysis of price sensitivity, lifecycle, customer purchase basket, adoption rates, and purchase criteria

12. Geographic Landscape

12.1 Geographic segmentation

Chart on Market share by geography 2025-2030 (%)
Data Table on Market share by geography 2025-2030 (%)

12.2 Geographic comparison

Chart on Geographic comparison
Data Table on Geographic comparison

12.3 APAC - Market size and forecast 2025-2030

Chart on APAC - Market size and forecast 2025-2030 ($ million)
Data Table on APAC - Market size and forecast 2025-2030 ($ million)
Chart on APAC - Year-over-year growth 2025-2030 (%)
Data Table on APAC - Year-over-year growth 2025-2030 (%)
Chart on Regional Comparison - APAC
Data Table on Regional Comparison - APAC

12.3.1 China - Market size and forecast 2025-2030

Chart on China - Market size and forecast 2025-2030 ($ million)
Data Table on China - Market size and forecast 2025-2030 ($ million)
Chart on China - Year-over-year growth 2025-2030 (%)
Data Table on China - Year-over-year growth 2025-2030 (%)

12.3.2 India - Market size and forecast 2025-2030

Chart on India - Market size and forecast 2025-2030 ($ million)
Data Table on India - Market size and forecast 2025-2030 ($ million)
Chart on India - Year-over-year growth 2025-2030 (%)
Data Table on India - Year-over-year growth 2025-2030 (%)

12.3.3 Japan - Market size and forecast 2025-2030

Chart on Japan - Market size and forecast 2025-2030 ($ million)
Data Table on Japan - Market size and forecast 2025-2030 ($ million)
Chart on Japan - Year-over-year growth 2025-2030 (%)
Data Table on Japan - Year-over-year growth 2025-2030 (%)

12.3.4 South Korea - Market size and forecast 2025-2030

Chart on South Korea - Market size and forecast 2025-2030 ($ million)
Data Table on South Korea - Market size and forecast 2025-2030 ($ million)
Chart on South Korea - Year-over-year growth 2025-2030 (%)
Data Table on South Korea - Year-over-year growth 2025-2030 (%)

12.3.5 Australia - Market size and forecast 2025-2030

Chart on Australia - Market size and forecast 2025-2030 ($ million)
Data Table on Australia - Market size and forecast 2025-2030 ($ million)
Chart on Australia - Year-over-year growth 2025-2030 (%)
Data Table on Australia - Year-over-year growth 2025-2030 (%)

12.3.6 Indonesia - Market size and forecast 2025-2030

Chart on Indonesia - Market size and forecast 2025-2030 ($ million)
Data Table on Indonesia - Market size and forecast 2025-2030 ($ million)
Chart on Indonesia - Year-over-year growth 2025-2030 (%)
Data Table on Indonesia - Year-over-year growth 2025-2030 (%)

12.4 North America - Market size and forecast 2025-2030

Chart on North America - Market size and forecast 2025-2030 ($ million)
Data Table on North America - Market size and forecast 2025-2030 ($ million)
Chart on North America - Year-over-year growth 2025-2030 (%)
Data Table on North America - Year-over-year growth 2025-2030 (%)
Chart on Regional Comparison - North America
Data Table on Regional Comparison - North America

12.4.1 US - Market size and forecast 2025-2030

Chart on US - Market size and forecast 2025-2030 ($ million)
Data Table on US - Market size and forecast 2025-2030 ($ million)
Chart on US - Year-over-year growth 2025-2030 (%)
Data Table on US - Year-over-year growth 2025-2030 (%)

12.4.2 Canada - Market size and forecast 2025-2030

Chart on Canada - Market size and forecast 2025-2030 ($ million)
Data Table on Canada - Market size and forecast 2025-2030 ($ million)
Chart on Canada - Year-over-year growth 2025-2030 (%)
Data Table on Canada - Year-over-year growth 2025-2030 (%)

12.4.3 Mexico - Market size and forecast 2025-2030

Chart on Mexico - Market size and forecast 2025-2030 ($ million)
Data Table on Mexico - Market size and forecast 2025-2030 ($ million)
Chart on Mexico - Year-over-year growth 2025-2030 (%)
Data Table on Mexico - Year-over-year growth 2025-2030 (%)

12.5 Europe - Market size and forecast 2025-2030

Chart on Europe - Market size and forecast 2025-2030 ($ million)
Data Table on Europe - Market size and forecast 2025-2030 ($ million)
Chart on Europe - Year-over-year growth 2025-2030 (%)
Data Table on Europe - Year-over-year growth 2025-2030 (%)
Chart on Regional Comparison - Europe
Data Table on Regional Comparison - Europe

12.5.1 Germany - Market size and forecast 2025-2030

Chart on Germany - Market size and forecast 2025-2030 ($ million)
Data Table on Germany - Market size and forecast 2025-2030 ($ million)
Chart on Germany - Year-over-year growth 2025-2030 (%)
Data Table on Germany - Year-over-year growth 2025-2030 (%)

12.5.2 UK - Market size and forecast 2025-2030

Chart on UK - Market size and forecast 2025-2030 ($ million)
Data Table on UK - Market size and forecast 2025-2030 ($ million)
Chart on UK - Year-over-year growth 2025-2030 (%)
Data Table on UK - Year-over-year growth 2025-2030 (%)

12.5.3 France - Market size and forecast 2025-2030

Chart on France - Market size and forecast 2025-2030 ($ million)
Data Table on France - Market size and forecast 2025-2030 ($ million)
Chart on France - Year-over-year growth 2025-2030 (%)
Data Table on France - Year-over-year growth 2025-2030 (%)

12.5.4 Italy - Market size and forecast 2025-2030

Chart on Italy - Market size and forecast 2025-2030 ($ million)
Data Table on Italy - Market size and forecast 2025-2030 ($ million)
Chart on Italy - Year-over-year growth 2025-2030 (%)
Data Table on Italy - Year-over-year growth 2025-2030 (%)

12.5.5 Spain - Market size and forecast 2025-2030

Chart on Spain - Market size and forecast 2025-2030 ($ million)
Data Table on Spain - Market size and forecast 2025-2030 ($ million)
Chart on Spain - Year-over-year growth 2025-2030 (%)
Data Table on Spain - Year-over-year growth 2025-2030 (%)

12.5.6 The Netherlands - Market size and forecast 2025-2030

Chart on The Netherlands - Market size and forecast 2025-2030 ($ million)
Data Table on The Netherlands - Market size and forecast 2025-2030 ($ million)
Chart on The Netherlands - Year-over-year growth 2025-2030 (%)
Data Table on The Netherlands - Year-over-year growth 2025-2030 (%)

12.6 Middle East and Africa - Market size and forecast 2025-2030

Chart on Middle East and Africa - Market size and forecast 2025-2030 ($ million)
Data Table on Middle East and Africa - Market size and forecast 2025-2030 ($ million)
Chart on Middle East and Africa - Year-over-year growth 2025-2030 (%)
Data Table on Middle East and Africa - Year-over-year growth 2025-2030 (%)
Chart on Regional Comparison - Middle East and Africa
Data Table on Regional Comparison - Middle East and Africa

12.6.1 UAE - Market size and forecast 2025-2030

Chart on UAE - Market size and forecast 2025-2030 ($ million)
Data Table on UAE - Market size and forecast 2025-2030 ($ million)
Chart on UAE - Year-over-year growth 2025-2030 (%)
Data Table on UAE - Year-over-year growth 2025-2030 (%)

12.6.2 Saudi Arabia - Market size and forecast 2025-2030

Chart on Saudi Arabia - Market size and forecast 2025-2030 ($ million)
Data Table on Saudi Arabia - Market size and forecast 2025-2030 ($ million)
Chart on Saudi Arabia - Year-over-year growth 2025-2030 (%)
Data Table on Saudi Arabia - Year-over-year growth 2025-2030 (%)

12.6.3 South Africa - Market size and forecast 2025-2030

Chart on South Africa - Market size and forecast 2025-2030 ($ million)
Data Table on South Africa - Market size and forecast 2025-2030 ($ million)
Chart on South Africa - Year-over-year growth 2025-2030 (%)
Data Table on South Africa - Year-over-year growth 2025-2030 (%)

12.6.4 Egypt - Market size and forecast 2025-2030

Chart on Egypt - Market size and forecast 2025-2030 ($ million)
Data Table on Egypt - Market size and forecast 2025-2030 ($ million)
Chart on Egypt - Year-over-year growth 2025-2030 (%)
Data Table on Egypt - Year-over-year growth 2025-2030 (%)

12.6.5 Nigeria - Market size and forecast 2025-2030

Chart on Nigeria - Market size and forecast 2025-2030 ($ million)
Data Table on Nigeria - Market size and forecast 2025-2030 ($ million)
Chart on Nigeria - Year-over-year growth 2025-2030 (%)
Data Table on Nigeria - Year-over-year growth 2025-2030 (%)

12.7 South America - Market size and forecast 2025-2030

Chart on South America - Market size and forecast 2025-2030 ($ million)
Data Table on South America - Market size and forecast 2025-2030 ($ million)
Chart on South America - Year-over-year growth 2025-2030 (%)
Data Table on South America - Year-over-year growth 2025-2030 (%)
Chart on Regional Comparison - South America
Data Table on Regional Comparison - South America

12.7.1 Brazil - Market size and forecast 2025-2030

Chart on Brazil - Market size and forecast 2025-2030 ($ million)
Data Table on Brazil - Market size and forecast 2025-2030 ($ million)
Chart on Brazil - Year-over-year growth 2025-2030 (%)
Data Table on Brazil - Year-over-year growth 2025-2030 (%)

12.7.2 Argentina - Market size and forecast 2025-2030

Chart on Argentina - Market size and forecast 2025-2030 ($ million)
Data Table on Argentina - Market size and forecast 2025-2030 ($ million)
Chart on Argentina - Year-over-year growth 2025-2030 (%)
Data Table on Argentina - Year-over-year growth 2025-2030 (%)

12.7.3 Colombia - Market size and forecast 2025-2030

Chart on Colombia - Market size and forecast 2025-2030 ($ million)
Data Table on Colombia - Market size and forecast 2025-2030 ($ million)
Chart on Colombia - Year-over-year growth 2025-2030 (%)
Data Table on Colombia - Year-over-year growth 2025-2030 (%)

12.8 Market opportunity by geography

Market opportunity by geography ($ million)
Data Tables on Market opportunity by geography ($ million)

13. Drivers, Challenges, and Opportunity

13.1 Market drivers

Rise in global internet traffic
Merger and acquisition strategies followed by market players
Growing number of FTTH subscribers

13.2 Market challenges

Complexities involved in wired communication networks
Growth of very-high-bit-rate digital subscriber line (VDSL) globally
Existing copper cables facilitating development of Gfast ecosystem

13.3 Impact of drivers and challenges

Impact of drivers and challenges in 2025 and 2030

13.4 Market opportunities

Proliferation of data centers globally
Development of next-generation telecommunication standards
Increasing adoption of cloud-based storage services

14. Competitive Landscape

14.1 Overview

14.2

Overview on criticality of inputs and factors of differentiation

14.3 Landscape disruption

Overview on factors of disruption

14.4 Industry risks

Impact of key risks on business

15. Competitive Analysis

15.1 Companies profiled

Companies covered

15.2 Company ranking index

15.3 Market positioning of companies

Matrix on companies position and classification

15.4 3M Co.

3M Co. - Overview
3M Co. - Business segments
3M Co. - Key news
3M Co. - Key offerings
3M Co. - Segment focus
SWOT

15.5 Belden Inc.

Belden Inc. - Overview
Belden Inc. - Business segments
Belden Inc. - Key news
Belden Inc. - Key offerings
Belden Inc. - Segment focus
SWOT

15.6 Cisco Systems Inc.

Cisco Systems Inc. - Overview
Cisco Systems Inc. - Business segments
Cisco Systems Inc. - Key news
Cisco Systems Inc. - Key offerings
Cisco Systems Inc. - Segment focus
SWOT

15.7 Corning Inc.

Corning Inc. - Overview
Corning Inc. - Business segments
Corning Inc. - Key offerings
Corning Inc. - Segment focus
SWOT

15.8 Eaton Corp. Plc

Eaton Corp. Plc - Overview
Eaton Corp. Plc - Business segments
Eaton Corp. Plc - Key news
Eaton Corp. Plc - Key offerings
Eaton Corp. Plc - Segment focus
SWOT

15.9 GEOGRAPH Technologies LLC

GEOGRAPH Technologies LLC - Overview
GEOGRAPH Technologies LLC - Product / Service
GEOGRAPH Technologies LLC - Key offerings
SWOT

15.10 IQGeo Group plc

IQGeo Group plc - Overview
IQGeo Group plc - Product / Service
IQGeo Group plc - Key offerings
SWOT

15.11 Lepton Software Pvt. Ltd.

Lepton Software Pvt. Ltd. - Overview
Lepton Software Pvt. Ltd. - Product / Service
Lepton Software Pvt. Ltd. - Key offerings
SWOT

15.12 Panduit Corp.

Panduit Corp. - Overview
Panduit Corp. - Product / Service
Panduit Corp. - Key offerings
SWOT

15.13 Phoenix Contact GmbH and Co

Phoenix Contact GmbH and Co - Overview
Phoenix Contact GmbH and Co - Product / Service
Phoenix Contact GmbH and Co - Key offerings
SWOT

15.14 Schneider Electric SE

Schneider Electric SE - Overview
Schneider Electric SE - Business segments
Schneider Electric SE - Key news
Schneider Electric SE - Key offerings
Schneider Electric SE - Segment focus
SWOT

15.15 Softelnet SA

Softelnet SA - Overview
Softelnet SA - Product / Service
Softelnet SA - Key offerings
SWOT

15.16 TE Connectivity Ltd.

TE Connectivity Ltd. - Overview
TE Connectivity Ltd. - Business segments
TE Connectivity Ltd. - Key news
TE Connectivity Ltd. - Key offerings
TE Connectivity Ltd. - Segment focus
SWOT

15.17 VETRO Inc.

VETRO Inc. - Overview
VETRO Inc. - Product / Service
VETRO Inc. - Key offerings
SWOT

15.18 Viavi Solutions Inc.

Viavi Solutions Inc. - Overview
Viavi Solutions Inc. - Business segments
Viavi Solutions Inc. - Key news
Viavi Solutions Inc. - Key offerings
Viavi Solutions Inc. - Segment focus
SWOT

16. Appendix

16.1 Scope of the report

Market definition
Objectives
Notes and caveats

16.2 Inclusions and exclusions checklist

Inclusions checklist
Exclusions checklist

16.3 Currency conversion rates for US$

16.4 Research methodology

16.5 Data procurement

Information sources

16.6 Data validation

16.7 Validation techniques employed for market sizing

16.8 Data synthesis

16.9 360 degree market analysis

16.10 List of abbreviations

Research Methodology

Technavio presents a detailed picture of the market by way of study, synthesis, and summation of data from multiple sources. The analysts have presented the various facets of the market with a particular focus on identifying the key industry influencers. The data thus presented is comprehensive, reliable, and the result of extensive research, both primary and secondary.

INFORMATION SOURCES

Primary sources

  • Manufacturers and suppliers
  • Channel partners
  • Industry experts
  • Strategic decision makers

Secondary sources

  • Industry journals and periodicals
  • Government data
  • Financial reports of key industry players
  • Historical data
  • Press releases

DATA ANALYSIS

Data Synthesis

  • Collation of data
  • Estimation of key figures
  • Analysis of derived insights

Data Validation

  • Triangulation with data models
  • Reference against proprietary databases
  • Corroboration with industry experts

REPORT WRITING

Qualitative

  • Market drivers
  • Market challenges
  • Market trends
  • Five forces analysis

Quantitative

  • Market size and forecast
  • Market segmentation
  • Geographical insights
  • Competitive landscape

Interested in this report?

Get your sample now to see our research methodology and insights!

Download Now

Frequently Asked Questions

Fiber Management Systems market growth will increase by USD 1033.5 million during 2026-2030.

The Fiber Management Systems market is expected to grow at a CAGR of 4.5% during 2026-2030.

Fiber Management Systems market is segmented by Application (Multi mode, Single mode) Product type (Fiber optic patch panels, Fiber distribution frames, Fiber enclosures) Component (Hardware, Software, Services)

3M Co., Belden Inc., Cisco Systems Inc., Corning Inc., Eaton Corp. Plc, GEOGRAPH Technologies LLC, IQGeo Group plc, JO Software Engineering GmbH, Lepton Software Pvt. Ltd., Panduit Corp., Patchmanager B.V., Phoenix Contact GmbH and Co, Schneider Electric SE, Softelnet SA, SSP Innovations LLC, TE Connectivity Ltd., VETRO Inc., Viavi Solutions Inc. are a few of the key vendors in the Fiber Management Systems market.

APAC will register the highest growth rate of 72% among the other regions. Therefore, the Fiber Management Systems market in APAC is expected to garner significant business opportunities for the vendors during the forecast period.

China, India, Japan, South Korea, Australia, Indonesia, US, Canada, Mexico, Germany, UK, France, Italy, Spain, The Netherlands, UAE, Saudi Arabia, South Africa, Egypt, Nigeria, Brazil, Argentina, Colombia

  • Rise in global internet traffic is the driving factor this market.

The Fiber Management Systems market vendors should focus on grabbing business opportunities from the Application segment as it accounted for the largest market share in the base year.