Fiberglass Market for Aerospace Industry Analysis APAC, North America, Europe, South America, Middle East and Africa - US, Canada, China, Japan, Germany - Size and Forecast 2024-2028

Fiberglass Market for Aerospace Industry Analysis APAC, North America, Europe, South America, Middle East and Africa - US, Canada, China, Japan, Germany - Size and Forecast 2024-2028

Published: Feb 2024 158 Pages SKU: IRTNTR77567

Market Overview at a Glance

$1.01 B
Market Opportunity
7.15%
CAGR
6.32
YoY growth 2023-2024(%)

Fiberglass Market for Aerospace Industry Size 2024-2028 

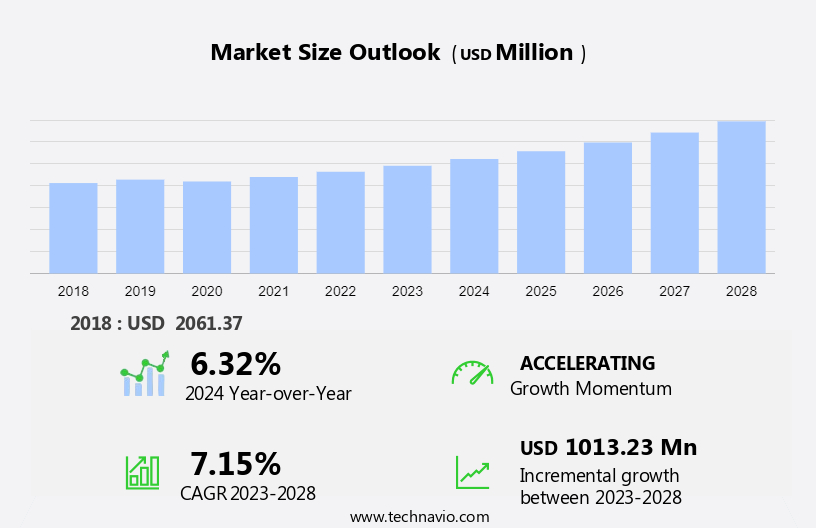
The fiberglass market for aerospace industry size is forecast to increase by USD 1.01 billion at a CAGR of 7.15% between 2023 and 2028.

  • The fiberglass market in the aerospace industry exhibits significant growth due to several key factors. One such factor is the increasing demand for cabin retrofitting to enhance passenger comfort in commercial aircraft. Additionally, the construction of new commercial and defense aircraft is on the rise, leading to a rise in the usage of fiberglass in the aerospace sector for commercial aircraft aftermarket parts. However, health hazards associated with fiberglass exposure pose a challenge to market growth. Additionally, fiberglass's use extends beyond the aircraft sector, with applications in wind energy, marine, and transportation industries. Despite this, the benefits of using fiberglass in aerospace applications, such as its lightweight and high-strength properties, make it a preferred material for manufacturers. Overall, the market in the aerospace industry is expected to witness steady growth in the coming years due to these driving factors and the challenges that come with them.

What will be the Size of the Fiberglass Market for Aerospace Industry During the Forecast Period?

Fiberglass Market for Aerospace Industry Size

To learn more about the market report, Request Free Sample

  • In the aerospace industry, the demand for lightweight and eco-friendly materials continues to grow, with fiberglass composites emerging as a popular alternative to traditional metals. Fiberglass, a composite material made of glass fibers and a polymer matrix, offers significant advantages in the aircraft sector. Its lightweight and high strength make it an ideal choice for aircraft construction, contributing to improved fuel efficiency and reduced maintenance costs. Moreover, fiberglass's durability and corrosion resistance ensure the safety and efficiency of operations. The use of fiberglass panels in aircraft manufacturing also enhances insulation and provides durable surfaces. In the aerospace and defense industry, fiberglass's thermoset and thermoplastic variants offer varying benefits, with thermosets providing superior strength and thermoplastics offering easier processing.
  • Fiberglass's environmental friendliness is another key factor driving its adoption in the aerospace industry. As concerns over raw material costs and sustainability grow, fiberglass's eco-friendly nature and recyclability make it an attractive option. Overall, fiberglass's unique properties and benefits make it a valuable asset in the aerospace and defense industry, contributing to the development of more efficient, sustainable, and cost-effective aircraft.

How is the Fiberglass Market for Aerospace Industry Segmented?

The market research report provides comprehensive data (region-wise segment analysis), with forecasts and estimates in "USD million" for the period 2024-2028, as well as historical data from 2018-2022 for the following segments.
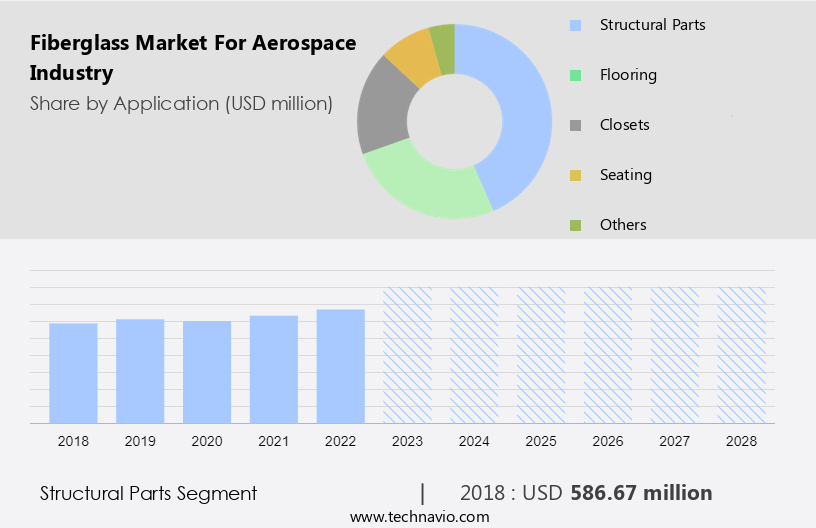
  • Application
    • Structural parts
    • Flooring
    • Closets
    • Seating
    • Others
  • Type
    • Thermoset resins
    • Thermoplastic resins
  • Geography
    • APAC
      • China
      • Japan
    • North America
      • Canada
      • US
    • Europe
      • Germany
    • South America
    • Middle East and Africa

By Application Insights

  • The structural parts segment is estimated to witness significant growth during the forecast period.

Fiberglass composites play a significant role in the aerospace industry, accounting for approximately half of the weight in modern aircraft. This material, consisting of glass fibers reinforced in a polymer matrix, is widely used for manufacturing structural components such as fuselage, wings, stabilizers, landing gear, and tail sections. In interior applications, fiberglass is utilized as sheets, panels, and veneers for flooring, closets, air ducts, cargo liners, and insulation. The high strength and durability of fiberglass make it an ideal choice for aerospace manufacturing. Thermoset and thermoplastic matrices are commonly used in fiberglass composites for aerospace applications. Silica, silicate, calcium, magnesium, and boron oxides are often added as reinforcements to enhance the properties of fiberglass composites. While carbon fiber is another popular reinforcement in the aerospace sector, fiberglass remains a cost-effective and widely used option due to its excellent corrosion resistance and lightweight properties.

Fiberglass Market for Aerospace Industry Size

Get a glance at the market report of share of various segments. Request Free Sample

The structural parts segment was valued at USD 586.67 million in 2018 and showed a gradual increase during the forecast period.

Regional Analysis

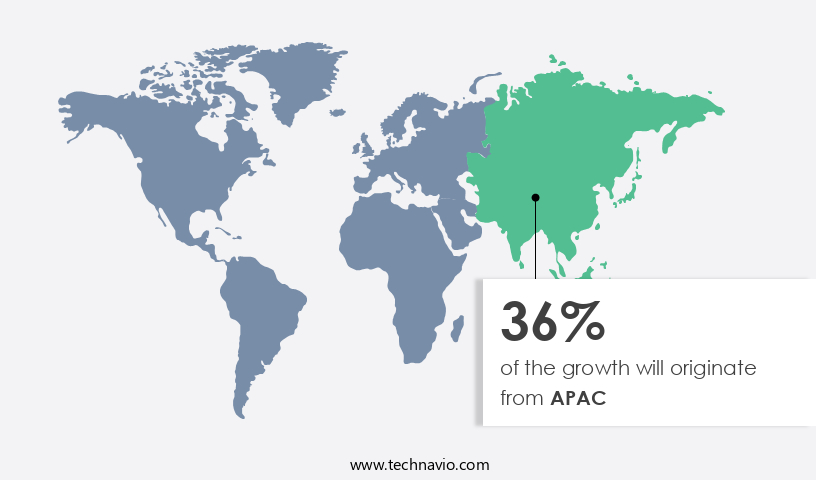
  • APAC is estimated to contribute 36% to the growth of the global market during the forecast period.

Technavio's analysts have elaborately explained the regional trends and drivers that shape the market during the forecast period.

Fiberglass Market for Aerospace Industry Share by Geography

For more insights on the market share of various regions, Request Free Sample

The market is experiencing significant growth in the Asia Pacific (APAC) region due to the increasing construction of lightweight, fuel-efficient aircraft. With a large fleet of aircraft in countries like India, China, Japan, Singapore, and Malaysia, the demand for fiberglass, known for its high strength and durability, is on the rise. China, being a major player in the civil aerospace and aviation services industry, is a key contributor to this trend. Operators in APAC are focusing on expanding their fleets to meet the growing passenger demand in the region, leading to increased adoption of fiberglass in aircraft manufacturing.

Additionally, the emphasis on reducing fuel burn and improving operational efficiency, along with lower maintenance costs and enhanced safety features, further boosts the market's growth. The market in the aerospace industry is expected to continue its expansion in the coming years, with potential applications also extending to wind energy and marine industries.

Fiberglass Market for Aerospace Industry Dynamics

Our market researchers analyzed the data with 2023 as the base year, along with the key drivers, trends, and challenges. A holistic analysis of drivers will help companies refine their marketing strategies to gain a competitive advantage.

Key Market Drivers

The need for cabin retrofitting seats to enhance passenger comfort is the key driver of the market.

  • In the aerospace industry, fiberglass, a composite material made from glass fibers and a resin matrix, has gained significant attention as a lightweight and eco-friendly alternative to traditional metals. Fiberglass offers superior strength and stiffness, making it an ideal choice for aircraft manufacturing, particularly in the production of wind turbine blades and aircraft components. The use of fiberglass in the aerospace sector contributes to aircraft weight reduction and fuel efficiency, which are crucial factors in the economic and environmental landscapes of the industry. Moreover, fiberglass's durability and resistance to corrosion make it a sustainable solution for aircraft exterior and interior applications.
  • The recyclability of fiberglass and its raw materials, such as silica, silicate, calcium, magnesium, boron oxides, and hydroxyapatite particles, aligns with the industry's increasing focus on sustainability and reducing waste. The automotive sector has also embraced fiberglass for lightweighting and enhancing performance, further driving down raw material costs and increasing its availability for the aerospace industry. Innovation and technology continue to advance the use of fiberglass in the aerospace industry, with applications ranging from aircraft interiors and exteriors to panels, insulation, and infrastructure sectors. Quality control is essential in the production of fiberglass components for the aerospace industry.  Fiberglass's thermal insulation properties and fire resistance make it an attractive alternative to wood, bone, cellulose fibers, and lignin matrix materials.

Primary Market Trends

Rising construction for new commercial and defense aircraft is the upcoming trend in the market.

  • The aerospace industry's reliance on lightweight and eco-friendly materials, such as fiberglass composites, has gained significant traction due to the increasing demand for sustainability and economic efficiency. Fiberglass, a composite material made of glass fibers and a resin matrix, offers high strength, durability, and corrosion resistance, making it an ideal alternative to traditional metals in the aircraft sector. Fiberglass's use extends beyond the aircraft industry, with applications in wind turbine blades, infrastructure sectors, and automotive lightweighting. The raw material costs of fiberglass have remained relatively stable due to the availability of raw materials like silica, silicate, calcium, magnesium, and boron oxides.
  • Moreover, the development of recyclable materials and innovative technologies has led to sustainable solutions for fiberglass production and disposal. Quality control is paramount in the aerospace industry, and fiberglass's consistency and uniformity make it an attractive choice. Economic and environmental landscapes have become crucial considerations in the industry, and fiberglass's energy efficiency and performance contribute to both. The strong and stiff fibers in the composite material provide aircraft weight reduction, resulting in fuel economy and fuel burn reduction, which is essential for airline sector sustainability. Innovation and technology continue to drive the fiberglass market, with advancements in autoclave systems, glass wool recycling, and fiberglass fabric production.

Major Market Challenges

Health hazards associated with fiberglass exposure is a key challenge affecting the market growth.

  • The aerospace industry's increasing focus on lightweight materials, sustainability, and eco-friendly solutions has led to a significant rise in the usage of fiberglass as a composite material. Fiberglass, a thermoset polymer made of glass fibers and a resin matrix, offers high strength, durability, and excellent corrosion resistance, making it an ideal alternative to metals in aircraft manufacturing. Fiberglass's use extends beyond the aircraft sector, finding applications in various infrastructure sectors such as wind energy, construction, transportation, and insulation. In the automotive industry, fiberglass is used for lightweighting and improving fuel efficiency through automotive lightweighting. Raw material costs, economic landscapes, and environmental landscapes are significant factors influencing the fiberglass market's growth.
  • Innovation and technology play a crucial role in enhancing fiberglass's sustainability by developing recyclable materials and improving quality control processes. Fiberglass's use in wind turbine blades and aircraft exterior and interior components contributes to fuel economy and enhanced safety. The sandwich process, which involves the use of fiberglass fabric between two lightweight materials, further reduces aircraft weight and fuel burn. The aerospace and defense industry's new aircraft demand, airline sector growth, and increasing air passenger traffic necessitate the adoption of lightweight and fuel-efficient materials like fiberglass. Additionally, the development of advanced autoclave systems and glass wool recycling technologies is expected to drive market growth.

Customer Landscape

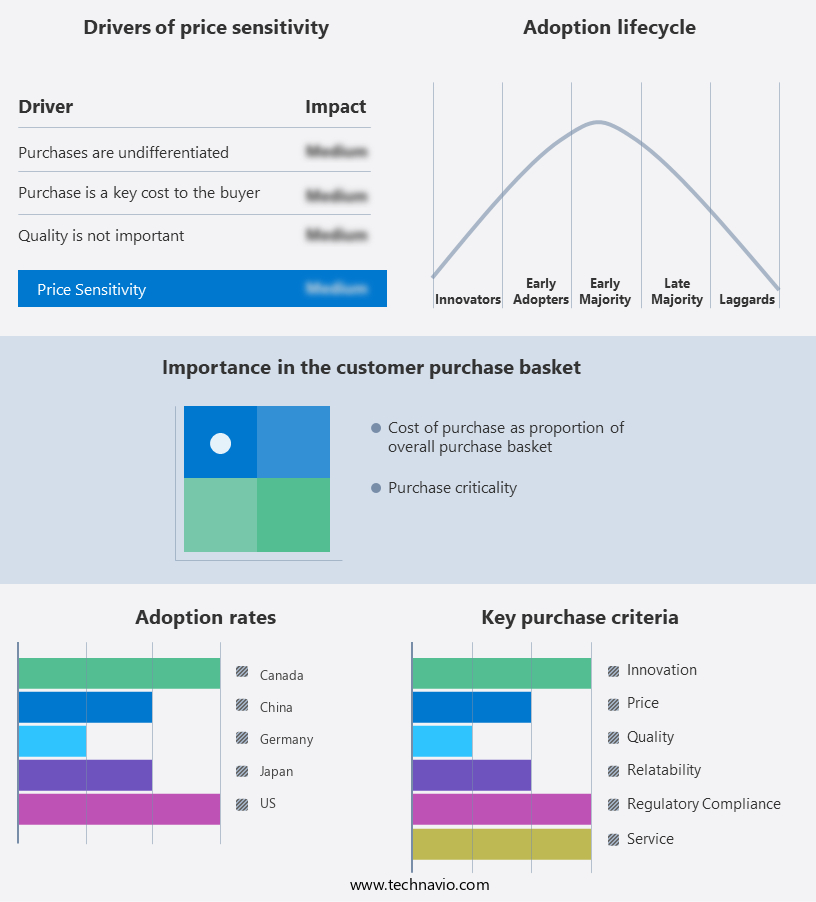
The market forecasting report includes the adoption lifecycle of the market, covering from the innovator's stage to the laggard's stage. It focuses on adoption rates in different regions based on penetration. Furthermore, the market growth analysis report also includes key purchase criteria and drivers of price sensitivity to help companies evaluate and develop their market growth analysis strategies.

Fiberglass Market for Aerospace Industry Share by Geography

 Customer Landscape

Key Companies & Market Insights

Companies are implementing various strategies, such as strategic alliances, market forecast, partnerships, mergers and acquisitions, geographical expansion, and product/service launches, to enhance their presence in the market.

The market for aerospace industry market research and growth report includes detailed analyses of the competitive landscape of the market and information about key companies, including:

  • 3B the fiberglass Co.
  • AGY Holding Corp.
  • ATKINS and PEARCE Inc.
  • China Jushi Co. Ltd.
  • Compagnie de Saint Gobain
  • Hexcel Corp.
  • Huntsman International LLC
  • Johns Manville
  • JPS Composite Materials
  • Montex Glass Fibre Industries Pvt. Ltd.
  • Nan Ya Plastic Corp.
  • Nitto Boseki Co. Ltd.
  • Park Aerospace Corp.
  • Phelps Industrial Products LLC
  • Piran Advanced Composites
  • Porcher Industries
  • SAERTEX GmbH and Co.KG
  • Sinoma Science and Technology Co. Ltd.
  • Taiwan Glass Ind. Corp.
  • Tencom Ltd.

Qualitative and quantitative analysis of companies has been conducted to help clients understand the wider business environment as well as the strengths and weaknesses of key market players. Data is qualitatively analyzed to categorize companies as pure play, category-focused, industry-focused, and diversified; it is quantitatively analyzed to categorize companies as dominant, leading, strong, tentative, and weak.

Research Analyst Overview

Fiberglass, a composite material made of glass fibers and a resin matrix, has gained significant attention in the aerospace industry due to its unique properties. This material offers lightweight, high strength, and durability, making it an ideal choice for various applications in the aerospace sector. The global economic landscape has been witnessing a shift towards eco-friendly and sustainable solutions. This trend is also reflected in the aerospace industry, where fiberglass's role is expanding. Fiberglass is considered an alternative material to traditional metals, offering potential cost savings and environmental benefits.

Moreover, raw material costs are a crucial factor influencing the fiberglass market in the aerospace industry. The prices of raw materials such as silica, silicate, calcium, magnesium, boron oxides, and carbon fiber can significantly impact the production costs of fiberglass. However, the industry's focus on innovation and technology is driving the development of more cost-effective production methods and alternative raw materials. Quality control is another essential aspect of the market in the aerospace industry. The stringent requirements of this sector necessitate high-quality materials and manufacturing processes. Autoclave systems, for instance, are widely used to ensure consistent quality and optimal performance of fiberglass components.

Furthermore, sustainability is a critical concern in today's economic and environmental landscapes. The aerospace industry is exploring various ways to reduce its carbon footprint, and fiberglass plays a role in this endeavor. For example, fiberglass is used in the production of wind turbine blades, contributing to the renewable energy sector's growth. Recyclable materials are another trend gaining traction in the aerospace industry. Glass wool recycling, for instance, is an area of active research, with potential applications in insulation and roofing materials. Fiberglass fabric is also used in aircraft weight reduction, enhancing fuel efficiency and reducing maintenance costs. The infrastructure sectors, including transportation, construction, and energy, are also adopting fiberglass due to its advantages.

Fiberglass Market for Aerospace Industry Market Scope

Report Coverage

Details

Page number

158

Base year

2023

Historic period

2018-2022

Forecast period

2024-2028

Growth momentum & CAGR

Accelerate at a CAGR of 7.15%

Market Growth 2024-2028

USD 1.01 billion

Market structure

Fragmented

YoY growth 2023-2024(%)

6.32

Key countries

US, Canada, China, Japan, and Germany

Competitive landscape

Leading Companies, Market Positioning of Companies, Competitive Strategies, and Industry Risks

Request Free Sample

What are the Key Data Covered in this Market Research and Growth Report?

  • CAGR of the market during the forecast period
  • Detailed information on factors that will drive the market growth and forecasting between 2024 and 2028
  • Precise estimation of the size of the market  and its contribution of the market in focus to the parent market
  • Accurate predictions about upcoming market growth and trends and changes in consumer behaviour
  • Growth of the market across APAC, North America, Europe, South America, and Middle East and Africa
  • Thorough analysis of the market's competitive landscape and detailed information about companies
  • Comprehensive analysis of factors that will challenge the growth of market companies

We can help! Our analysts can customize this market research report to meet your requirements. Get in touch

1 Executive Summary

  • 1.1 Market overview
    • Exhibit 01: Executive Summary – Chart on Market Overview
    • Exhibit 02: Executive Summary – Data Table on Market Overview
    • Exhibit 03: Executive Summary – Chart on Global Market Characteristics
    • Exhibit 04: Executive Summary – Chart on Market by Geography
    • Exhibit 05: Executive Summary – Chart on Market Segmentation by Application
    • Exhibit 06: Executive Summary – Chart on Market Segmentation by Type
    • Exhibit 07: Executive Summary – Chart on Incremental Growth
    • Exhibit 08: Executive Summary – Data Table on Incremental Growth
    • Exhibit 09: Executive Summary – Chart on Vendor Market Positioning

2 Market Landscape

  • 2.1 Market ecosystem
    • Exhibit 10: Parent market
    • Exhibit 11: Market Characteristics

3 Market Sizing

  • 3.1 Market definition
    • Exhibit 12: Offerings of vendors included in the market definition
  • 3.2 Market segment analysis
    • Exhibit 13: Market segments
  • 3.3 Market size 2023
    • 3.4 Market outlook: Forecast for 2023-2028
      • Exhibit 14: Chart on Global - Market size and forecast 2023-2028 ($ million)
      • Exhibit 15: Data Table on Global - Market size and forecast 2023-2028 ($ million)
      • Exhibit 16: Chart on Global Market: Year-over-year growth 2023-2028 (%)
      • Exhibit 17: Data Table on Global Market: Year-over-year growth 2023-2028 (%)

    4 Historic Market Size

    • 4.1 Global fiberglass market for aerospace industry 2018 - 2022
      • Exhibit 18: Historic Market Size – Data Table on global fiberglass market for aerospace industry 2018 - 2022 ($ million)
    • 4.2 Application Segment Analysis 2018 - 2022
      • Exhibit 19: Historic Market Size – Application Segment 2018 - 2022 ($ million)
    • 4.3 Type Segment Analysis 2018 - 2022
      • Exhibit 20: Historic Market Size – Type Segment 2018 - 2022 ($ million)
    • 4.4 Geography Segment Analysis 2018 - 2022
      • Exhibit 21: Historic Market Size – Geography Segment 2018 - 2022 ($ million)
    • 4.5 Country Segment Analysis 2018 - 2022
      • Exhibit 22: Historic Market Size – Country Segment 2018 - 2022 ($ million)

    5 Five Forces Analysis

    • 5.1 Five forces summary
      • Exhibit 23: Five forces analysis - Comparison between 2023 and 2028
    • 5.2 Bargaining power of buyers
      • Exhibit 24: Chart on Bargaining power of buyers – Impact of key factors 2023 and 2028
    • 5.3 Bargaining power of suppliers
      • Exhibit 25: Bargaining power of suppliers – Impact of key factors in 2023 and 2028
    • 5.4 Threat of new entrants
      • Exhibit 26: Threat of new entrants – Impact of key factors in 2023 and 2028
    • 5.5 Threat of substitutes
      • Exhibit 27: Threat of substitutes – Impact of key factors in 2023 and 2028
    • 5.6 Threat of rivalry
      • Exhibit 28: Threat of rivalry – Impact of key factors in 2023 and 2028
    • 5.7 Market condition
      • Exhibit 29: Chart on Market condition - Five forces 2023 and 2028

    6 Market Segmentation by Application

    • 6.1 Market segments
      • Exhibit 30: Chart on Application - Market share 2023-2028 (%)
      • Exhibit 31: Data Table on Application - Market share 2023-2028 (%)
    • 6.2 Comparison by Application
      • Exhibit 32: Chart on Comparison by Application
      • Exhibit 33: Data Table on Comparison by Application
    • 6.3 Structural parts - Market size and forecast 2023-2028
      • Exhibit 34: Chart on Structural parts - Market size and forecast 2023-2028 ($ million)
      • Exhibit 35: Data Table on Structural parts - Market size and forecast 2023-2028 ($ million)
      • Exhibit 36: Chart on Structural parts - Year-over-year growth 2023-2028 (%)
      • Exhibit 37: Data Table on Structural parts - Year-over-year growth 2023-2028 (%)
    • 6.4 Flooring - Market size and forecast 2023-2028
      • Exhibit 38: Chart on Flooring - Market size and forecast 2023-2028 ($ million)
      • Exhibit 39: Data Table on Flooring - Market size and forecast 2023-2028 ($ million)
      • Exhibit 40: Chart on Flooring - Year-over-year growth 2023-2028 (%)
      • Exhibit 41: Data Table on Flooring - Year-over-year growth 2023-2028 (%)
    • 6.5 Closets - Market size and forecast 2023-2028
      • Exhibit 42: Chart on Closets - Market size and forecast 2023-2028 ($ million)
      • Exhibit 43: Data Table on Closets - Market size and forecast 2023-2028 ($ million)
      • Exhibit 44: Chart on Closets - Year-over-year growth 2023-2028 (%)
      • Exhibit 45: Data Table on Closets - Year-over-year growth 2023-2028 (%)
    • 6.6 Seating - Market size and forecast 2023-2028
      • Exhibit 46: Chart on Seating - Market size and forecast 2023-2028 ($ million)
      • Exhibit 47: Data Table on Seating - Market size and forecast 2023-2028 ($ million)
      • Exhibit 48: Chart on Seating - Year-over-year growth 2023-2028 (%)
      • Exhibit 49: Data Table on Seating - Year-over-year growth 2023-2028 (%)
    • 6.7 Others - Market size and forecast 2023-2028
      • Exhibit 50: Chart on Others - Market size and forecast 2023-2028 ($ million)
      • Exhibit 51: Data Table on Others - Market size and forecast 2023-2028 ($ million)
      • Exhibit 52: Chart on Others - Year-over-year growth 2023-2028 (%)
      • Exhibit 53: Data Table on Others - Year-over-year growth 2023-2028 (%)
    • 6.8 Market opportunity by Application
      • Exhibit 54: Market opportunity by Application ($ million)
      • Exhibit 55: Data Table on Market opportunity by Application ($ million)

    7 Market Segmentation by Type

    • 7.1 Market segments
      • Exhibit 56: Chart on Type - Market share 2023-2028 (%)
      • Exhibit 57: Data Table on Type - Market share 2023-2028 (%)
    • 7.2 Comparison by Type
      • Exhibit 58: Chart on Comparison by Type
      • Exhibit 59: Data Table on Comparison by Type
    • 7.3 Thermoset resins - Market size and forecast 2023-2028
      • Exhibit 60: Chart on Thermoset resins - Market size and forecast 2023-2028 ($ million)
      • Exhibit 61: Data Table on Thermoset resins - Market size and forecast 2023-2028 ($ million)
      • Exhibit 62: Chart on Thermoset resins - Year-over-year growth 2023-2028 (%)
      • Exhibit 63: Data Table on Thermoset resins - Year-over-year growth 2023-2028 (%)
    • 7.4 Thermoplastic resins - Market size and forecast 2023-2028
      • Exhibit 64: Chart on Thermoplastic resins - Market size and forecast 2023-2028 ($ million)
      • Exhibit 65: Data Table on Thermoplastic resins - Market size and forecast 2023-2028 ($ million)
      • Exhibit 66: Chart on Thermoplastic resins - Year-over-year growth 2023-2028 (%)
      • Exhibit 67: Data Table on Thermoplastic resins - Year-over-year growth 2023-2028 (%)
    • 7.5 Market opportunity by Type
      • Exhibit 68: Market opportunity by Type ($ million)
      • Exhibit 69: Data Table on Market opportunity by Type ($ million)

    8 Customer Landscape

    • 8.1 Customer landscape overview
      • Exhibit 70: Analysis of price sensitivity, lifecycle, customer purchase basket, adoption rates, and purchase criteria

    9 Geographic Landscape

    • 9.1 Geographic segmentation
      • Exhibit 71: Chart on Market share by geography 2023-2028 (%)
      • Exhibit 72: Data Table on Market share by geography 2023-2028 (%)
    • 9.2 Geographic comparison
      • Exhibit 73: Chart on Geographic comparison
      • Exhibit 74: Data Table on Geographic comparison
    • 9.3 APAC - Market size and forecast 2023-2028
      • Exhibit 75: Chart on APAC - Market size and forecast 2023-2028 ($ million)
      • Exhibit 76: Data Table on APAC - Market size and forecast 2023-2028 ($ million)
      • Exhibit 77: Chart on APAC - Year-over-year growth 2023-2028 (%)
      • Exhibit 78: Data Table on APAC - Year-over-year growth 2023-2028 (%)
    • 9.4 North America - Market size and forecast 2023-2028
      • Exhibit 79: Chart on North America - Market size and forecast 2023-2028 ($ million)
      • Exhibit 80: Data Table on North America - Market size and forecast 2023-2028 ($ million)
      • Exhibit 81: Chart on North America - Year-over-year growth 2023-2028 (%)
      • Exhibit 82: Data Table on North America - Year-over-year growth 2023-2028 (%)
    • 9.5 Europe - Market size and forecast 2023-2028
      • Exhibit 83: Chart on Europe - Market size and forecast 2023-2028 ($ million)
      • Exhibit 84: Data Table on Europe - Market size and forecast 2023-2028 ($ million)
      • Exhibit 85: Chart on Europe - Year-over-year growth 2023-2028 (%)
      • Exhibit 86: Data Table on Europe - Year-over-year growth 2023-2028 (%)
    • 9.6 South America - Market size and forecast 2023-2028
      • Exhibit 87: Chart on South America - Market size and forecast 2023-2028 ($ million)
      • Exhibit 88: Data Table on South America - Market size and forecast 2023-2028 ($ million)
      • Exhibit 89: Chart on South America - Year-over-year growth 2023-2028 (%)
      • Exhibit 90: Data Table on South America - Year-over-year growth 2023-2028 (%)
    • 9.7 Middle East and Africa - Market size and forecast 2023-2028
      • Exhibit 91: Chart on Middle East and Africa - Market size and forecast 2023-2028 ($ million)
      • Exhibit 92: Data Table on Middle East and Africa - Market size and forecast 2023-2028 ($ million)
      • Exhibit 93: Chart on Middle East and Africa - Year-over-year growth 2023-2028 (%)
      • Exhibit 94: Data Table on Middle East and Africa - Year-over-year growth 2023-2028 (%)
    • 9.8 US - Market size and forecast 2023-2028
      • Exhibit 95: Chart on US - Market size and forecast 2023-2028 ($ million)
      • Exhibit 96: Data Table on US - Market size and forecast 2023-2028 ($ million)
      • Exhibit 97: Chart on US - Year-over-year growth 2023-2028 (%)
      • Exhibit 98: Data Table on US - Year-over-year growth 2023-2028 (%)
    • 9.9 China - Market size and forecast 2023-2028
      • Exhibit 99: Chart on China - Market size and forecast 2023-2028 ($ million)
      • Exhibit 100: Data Table on China - Market size and forecast 2023-2028 ($ million)
      • Exhibit 101: Chart on China - Year-over-year growth 2023-2028 (%)
      • Exhibit 102: Data Table on China - Year-over-year growth 2023-2028 (%)
    • 9.10 Germany - Market size and forecast 2023-2028
      • Exhibit 103: Chart on Germany - Market size and forecast 2023-2028 ($ million)
      • Exhibit 104: Data Table on Germany - Market size and forecast 2023-2028 ($ million)
      • Exhibit 105: Chart on Germany - Year-over-year growth 2023-2028 (%)
      • Exhibit 106: Data Table on Germany - Year-over-year growth 2023-2028 (%)
    • 9.11 Canada - Market size and forecast 2023-2028
      • Exhibit 107: Chart on Canada - Market size and forecast 2023-2028 ($ million)
      • Exhibit 108: Data Table on Canada - Market size and forecast 2023-2028 ($ million)
      • Exhibit 109: Chart on Canada - Year-over-year growth 2023-2028 (%)
      • Exhibit 110: Data Table on Canada - Year-over-year growth 2023-2028 (%)
    • 9.12 Japan - Market size and forecast 2023-2028
      • Exhibit 111: Chart on Japan - Market size and forecast 2023-2028 ($ million)
      • Exhibit 112: Data Table on Japan - Market size and forecast 2023-2028 ($ million)
      • Exhibit 113: Chart on Japan - Year-over-year growth 2023-2028 (%)
      • Exhibit 114: Data Table on Japan - Year-over-year growth 2023-2028 (%)
    • 9.13 Market opportunity by geography
      • Exhibit 115: Market opportunity by geography ($ million)
      • Exhibit 116: Data Tables on Market opportunity by geography ($ million)

    10 Drivers, Challenges, and Trends

    • 10.1 Market drivers
      • 10.2 Market challenges
        • 10.3 Impact of drivers and challenges
          • Exhibit 117: Impact of drivers and challenges in 2023 and 2028
        • 10.4 Market trends

          11 Vendor Landscape

          • 11.1 Overview
            • 11.2 Vendor landscape
              • Exhibit 118: Overview on Criticality of inputs and Factors of differentiation
            • 11.3 Landscape disruption
              • Exhibit 119: Overview on factors of disruption
            • 11.4 Industry risks
              • Exhibit 120: Impact of key risks on business

            12 Vendor Analysis

            • 12.1 Vendors covered
              • Exhibit 121: Vendors covered
            • 12.2 Market positioning of vendors
              • Exhibit 122: Matrix on vendor position and classification
            • 12.3 3B the fiberglass Co.
              • Exhibit 123: 3B the fiberglass Co. - Overview
              • Exhibit 124: 3B the fiberglass Co. - Product / Service
              • Exhibit 125: 3B the fiberglass Co. - Key offerings
            • 12.4 AGY Holding Corp.
              • Exhibit 126: AGY Holding Corp. - Overview
              • Exhibit 127: AGY Holding Corp. - Key offerings
            • 12.5 ATKINS and PEARCE Inc.
              • Exhibit 128: ATKINS and PEARCE Inc. - Overview
              • Exhibit 129: ATKINS and PEARCE Inc. - Product / Service
              • Exhibit 130: ATKINS and PEARCE Inc. - Key offerings
            • 12.6 China Jushi Co. Ltd.
              • Exhibit 131: China Jushi Co. Ltd. - Overview
              • Exhibit 132: China Jushi Co. Ltd. - Product / Service
              • Exhibit 133: China Jushi Co. Ltd. - Key offerings
            • 12.7 Compagnie de Saint Gobain
              • Exhibit 134: Compagnie de Saint Gobain - Overview
              • Exhibit 135: Compagnie de Saint Gobain - Business segments
              • Exhibit 136: Compagnie de Saint Gobain - Key news
              • Exhibit 137: Compagnie de Saint Gobain - Key offerings
              • Exhibit 138: Compagnie de Saint Gobain - Segment focus
            • 12.8 Hexcel Corp.
              • Exhibit 139: Hexcel Corp. - Overview
              • Exhibit 140: Hexcel Corp. - Business segments
              • Exhibit 141: Hexcel Corp. - Key news
              • Exhibit 142: Hexcel Corp. - Key offerings
              • Exhibit 143: Hexcel Corp. - Segment focus
            • 12.9 Johns Manville
              • Exhibit 144: Johns Manville - Overview
              • Exhibit 145: Johns Manville - Product / Service
              • Exhibit 146: Johns Manville - Key offerings
            • 12.10 JPS Composite Materials
              • Exhibit 147: JPS Composite Materials - Overview
              • Exhibit 148: JPS Composite Materials - Product / Service
              • Exhibit 149: JPS Composite Materials - Key offerings
            • 12.11 Montex Glass Fibre Industries Pvt. Ltd.
              • Exhibit 150: Montex Glass Fibre Industries Pvt. Ltd. - Overview
              • Exhibit 151: Montex Glass Fibre Industries Pvt. Ltd. - Product / Service
              • Exhibit 152: Montex Glass Fibre Industries Pvt. Ltd. - Key offerings
            • 12.12 Nan Ya Plastic Corp.
              • Exhibit 153: Nan Ya Plastic Corp. - Overview
              • Exhibit 154: Nan Ya Plastic Corp. - Business segments
              • Exhibit 155: Nan Ya Plastic Corp. - Key offerings
              • Exhibit 156: Nan Ya Plastic Corp. - Segment focus
            • 12.13 Nitto Boseki Co. Ltd.
              • Exhibit 157: Nitto Boseki Co. Ltd. - Overview
              • Exhibit 158: Nitto Boseki Co. Ltd. - Business segments
              • Exhibit 159: Nitto Boseki Co. Ltd. - Key offerings
              • Exhibit 160: Nitto Boseki Co. Ltd. - Segment focus
            • 12.14 Park Aerospace Corp.
              • Exhibit 161: Park Aerospace Corp. - Overview
              • Exhibit 162: Park Aerospace Corp. - Product / Service
              • Exhibit 163: Park Aerospace Corp. - Key offerings
            • 12.15 Phelps Industrial Products LLC
              • Exhibit 164: Phelps Industrial Products LLC - Overview
              • Exhibit 165: Phelps Industrial Products LLC - Product / Service
              • Exhibit 166: Phelps Industrial Products LLC - Key offerings
            • 12.16 Sinoma Science and Technology Co. Ltd.
              • Exhibit 167: Sinoma Science and Technology Co. Ltd. - Overview
              • Exhibit 168: Sinoma Science and Technology Co. Ltd. - Product / Service
              • Exhibit 169: Sinoma Science and Technology Co. Ltd. - Key offerings
            • 12.17 Taiwan Glass Ind. Corp.
              • Exhibit 170: Taiwan Glass Ind. Corp. - Overview
              • Exhibit 171: Taiwan Glass Ind. Corp. - Business segments
              • Exhibit 172: Taiwan Glass Ind. Corp. - Key offerings
              • Exhibit 173: Taiwan Glass Ind. Corp. - Segment focus

            13 Appendix

            • 13.1 Scope of the report
              • 13.2 Inclusions and exclusions checklist
                • Exhibit 174: Inclusions checklist
                • Exhibit 175: Exclusions checklist
              • 13.3 Currency conversion rates for US$
                • Exhibit 176: Currency conversion rates for US$
              • 13.4 Research methodology
                • Exhibit 177: Research methodology
                • Exhibit 178: Validation techniques employed for market sizing
                • Exhibit 179: Information sources
              • 13.5 List of abbreviations
                • Exhibit 180: List of abbreviations

              Research Methodology

              Technavio presents a detailed picture of the market by way of study, synthesis, and summation of data from multiple sources. The analysts have presented the various facets of the market with a particular focus on identifying the key industry influencers. The data thus presented is comprehensive, reliable, and the result of extensive research, both primary and secondary.

              INFORMATION SOURCES

              Primary sources

              • Manufacturers and suppliers
              • Channel partners
              • Industry experts
              • Strategic decision makers

              Secondary sources

              • Industry journals and periodicals
              • Government data
              • Financial reports of key industry players
              • Historical data
              • Press releases

              DATA ANALYSIS

              Data Synthesis

              • Collation of data
              • Estimation of key figures
              • Analysis of derived insights

              Data Validation

              • Triangulation with data models
              • Reference against proprietary databases
              • Corroboration with industry experts

              REPORT WRITING

              Qualitative

              • Market drivers
              • Market challenges
              • Market trends
              • Five forces analysis

              Quantitative

              • Market size and forecast
              • Market segmentation
              • Geographical insights
              • Competitive landscape

              Interested in this report?

              Get your sample now to see our research methodology and insights!

              Download Now

              Frequently Asked Questions

              Fiberglassfor Aerospace Industry market growth will increase by $ 1013.23 mn during 2024-2028 .

              The Fiberglassfor Aerospace Industry market is expected to grow at a CAGR of 7.15% during 2024-2028 .

              Fiberglassfor Aerospace Industry market is segmented by Application( Structural parts, Flooring, Closets, Seating, Others) Type( Thermoset resins, Thermoplastic resins)

              3B the fiberglass Co., AGY Holding Corp., ATKINS and PEARCE Inc., China Jushi Co. Ltd., Compagnie de Saint Gobain, Hexcel Corp., Huntsman International LLC, Johns Manville, JPS Composite Materials, Montex Glass Fibre Industries Pvt. Ltd., Nan Ya Plastic Corp., Nitto Boseki Co. Ltd., Park Aerospace Corp., Phelps Industrial Products LLC, Piran Advanced Composites, Porcher Industries, SAERTEX GmbH and Co.KG, Sinoma Science and Technology Co. Ltd., Taiwan Glass Ind. Corp., Tencom Ltd. are a few of the key vendors in the Fiberglassfor Aerospace Industry market.

              APAC will register the highest growth rate of 36% among the other regions. Therefore, the Fiberglassfor Aerospace Industry market in APAC is expected to garner significant business opportunities for the vendors during the forecast period.

              US, Canada, China, Japan, Germany

              • Need for cabin retrofitting seats to enhance passenger comfortModern airline operators are keen on investing in cabin retrofitting to maintain a consistent brand image and capture the lucrative business traveler consumer segment. The need for cabin retrofitting is driven by the consumer demand for reliable cabin connectivity is the driving factor this market.
              • personalized entertainment systems is the driving factor this market.
              • hands-free commands is the driving factor this market.
              • micro cabin environments is the driving factor this market.
              • cabin air quality is the driving factor this market.
              • medical care is the driving factor this market.
              • and self-cleaning and anti-bacterial materials. The rising focus on passenger comfort has also resulted in airline operators spending on cabin modernization programs to offer comfortable seats is the driving factor this market.
              • large overhead bins is the driving factor this market.
              • and custom thematic experiences to passengers at an affordable price. Airline operators are striving to achieve a balance between cost and aesthetics. Fiberglass is an excellent airplane seat material that provides a defined seat structure. During the last decade is the driving factor this market.
              • a large number of commercial jetliners underwent some sort of cabin modernization is the driving factor this market.
              • ranging from the replacement of older seats with new ones to the introducing of completely redesigned cabins. For instance is the driving factor this market.
              • American Airlines is engaged in a modernization plan to standardize its fleet. It includes stripping out the main cabin economy seats and replacing them with premium economy seats that are wide and offer more legroom. As these seats command higher fares than economy seats is the driving factor this market.
              • the airline is enabled to offer customers superior levels of service. Moreover is the driving factor this market.
              • the need to differentiate the service levels offered within different classes provided by airline operators adds to the level of personalization in aircraft cabins. The seats made from fiberglass are 30% lighter than the steel seats is the driving factor this market.
              • and the installation will help the airline cut fuel costs. Thus is the driving factor this market.
              • the increasing usage of fiberglass for retrofitting seats in aircraft is expected to drive the global fiberglass market for aerospace industry growth during the forecast period. is the driving factor this market.

              The Fiberglassfor Aerospace Industry market vendors should focus on grabbing business opportunities from the Structural parts segment as it accounted for the largest market share in the base year.