Field Force Automation Market Analysis North America, Europe, APAC, Middle East and Africa, South America - US, China, UK, Germany, Japan - Size and Forecast 2024-2028

Field Force Automation Market Analysis North America, Europe, APAC, Middle East and Africa, South America - US, China, UK, Germany, Japan - Size and Forecast 2024-2028

Published: Jul 2024 166 Pages SKU: IRTNTR75551

Market Overview at a Glance

$3.49 B
Market Opportunity
22%
CAGR
17.75
YoY growth 2023-2024(%)

Field Force Automation Market Size 2024-2028

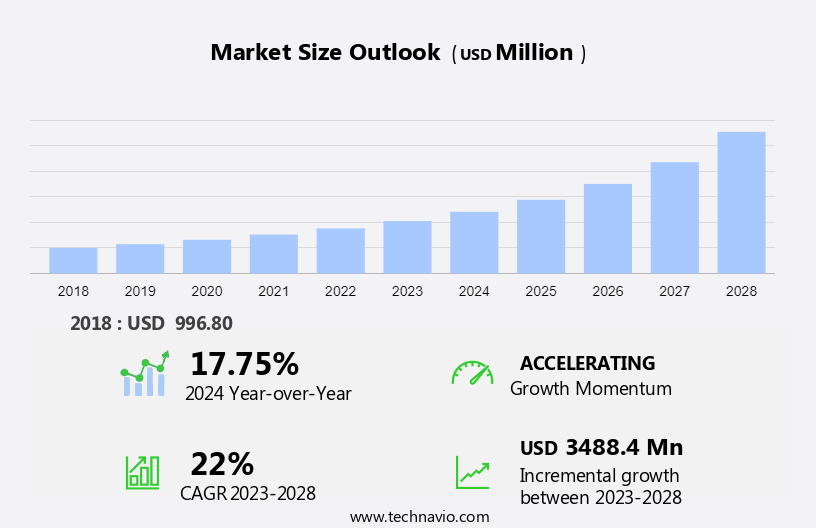
The field force automation market size is forecast to increase by USD 3.49 billion at a CAGR of 22% between 2023 and 2028.

  • The market is experiencing significant growth due to several key trends. The increasing demand for field force automation in Customer Relationship Management (CRM) is a major driving factor, as businesses seek to streamline operations and improve customer engagement. The IT and telecom sector, transportation and logistics, construction, real estate, and other sectors are leveraging field force automation solutions to enhance productivity and efficiency. Additionally, the strong growth of the IT industry is fueling the adoption of advanced technologies, such as mobile devices and cloud computing, which are essential for field force automation solutions. However, data privacy and security concerns associated with field force automation are challenges that must be addressed to ensure the successful implementation of these systems. Overall, the market is expected to continue its growth trajectory as businesses recognize the benefits of automating their field operations.

What will be the Size of the Field Force Automation Market During the Forecast Period?

Field Force Automation Market Size

 Request Free Sample

  • The market is experiencing significant growth due to the increasing adoption of mobile internet penetration, cloud computing, IoT, AI, and communication technologies in various industries. Field forces, comprising technicians and head office staff, are increasingly using handheld wireless devices for automated scheduling, worker dispatching, daily reporting, mobile workforce monitoring, tracking, and real-time communication. Real-time data exchange and error reduction are key benefits of field force automation, enabling businesses to streamline operations and improve customer service.
  • Moreover, connected devices and IoT are driving the adoption of field force automation, providing real-time data access and enabling proactive problem-solving. AI is being integrated into field force automation solutions to enhance predictive maintenance and improve decision-making capabilities. Overall, the market is poised for strong growth, offering significant opportunities for businesses to optimize operations and enhance customer satisfaction.

How is this Field Force Automation Industry segmented and which is the largest segment?

The field force automation industry research report provides comprehensive data (region-wise segment analysis), with forecasts and estimates in "USD billion" for the period 2024-2028, as well as historical data from 2018-2022 for the following segments.
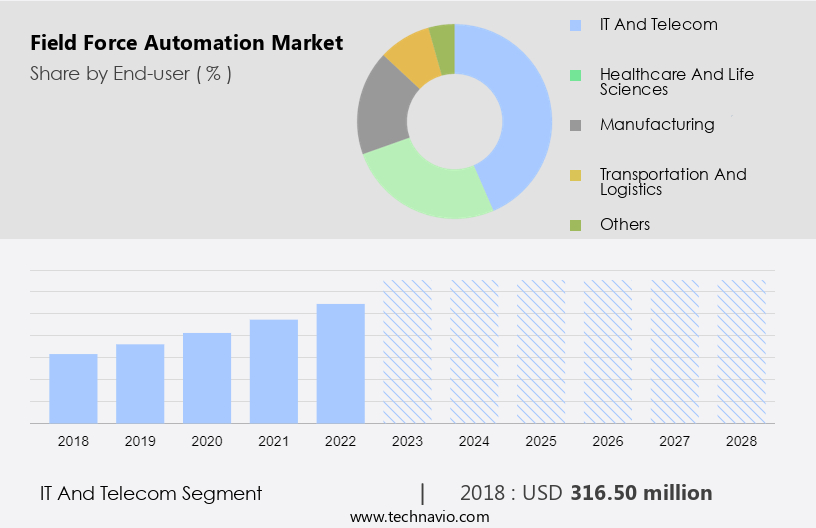
  • End-user
    • IT and telecom
    • Healthcare and life sciences
    • Manufacturing
    • Transportation and logistics
    • Others
  • Deployment
    • On-premises
    • Cloud-based
  • Geography
    • North America
      • US
    • Europe
      • Germany
      • UK
    • APAC
      • China
      • Japan
    • Middle East and Africa
    • South America

By End-user Insights

  • The IT and telecom segment is estimated to witness significant growth during the forecast period.

Field Force Automation (FFA) refers to the implementation of technology solutions to automate and optimize the activities of field-based workers in various industries. With the increasing penetration of mobile internet and the adoption of cloud computing, FFA has gained significant traction in sectors such as transportation and logistics, construction, real estate, and IT and telecom. FFA platforms enable businesses to manage their dispersed workforce effectively, enabling real-time communication and access to critical information. In the IT and telecom industry, FFA plays a pivotal role in enhancing operational efficiency, customer service, and workforce productivity. Field technicians and engineers can access work orders, customer information, and task details on their handheld wireless devices, eliminating the need for manual paperwork and reducing administrative overhead.

Field Force Automation Market Size

Get a glance at the Field Force Automation Industry report of share of various segments Request Free Sample

The IT and telecom segment was valued at USD 316.50 million in 2018 and showed a gradual increase during the forecast period.

Regional Analysis

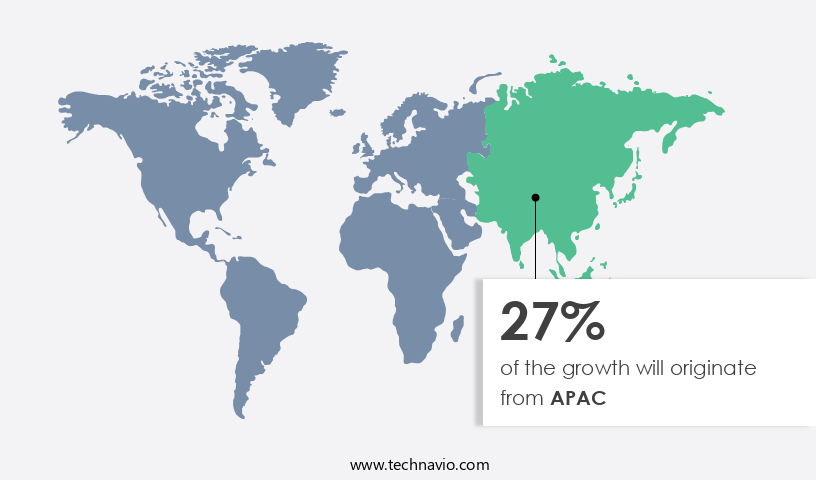
  • APAC is estimated to contribute 27% to the growth of the global market during the forecast period.

Technavio's analysts have elaborately explained the regional trends and drivers that shape the market during the forecast period.

Field Force Automation Market Share by Geography

For more insights on the market share of various regions, Request Free Sample

The market is witnessing significant growth due to the digitalization of processes in various industries, particularly in fast-moving consumer goods (FMCG), manufacturing, energy and utilities, and large enterprises. This automation enables efficient stock tracking, sales order management, and real-time communication between field forces and organizations. Mobile devices, such as smartphones and tablets, are being increasingly used to automate scheduling, dispatching, and daily reporting for field crews. Cloud-based and on-premises solutions offer organizations of all sizes the flexibility to access computing resources and manage their mobile workforces more effectively. Large manufacturing companies are leveraging IoT sensors, actuators, and alerts to monitor physical assets and minimize downtime on manufacturing floors.

Market Dynamics

Our researchers analyzed the data with 2023 as the base year, along with the key drivers, trends, and challenges. A holistic analysis of drivers will help companies refine their marketing strategies to gain a competitive advantage.

What are the key market drivers leading to the rise In the adoption of Field Force Automation Industry?

Rising demand for field force automation in CRM is the key driver of the market.

  • Field Force Automation (FFA) is a vital solution In the IT and Telecom sector, particularly in industries such as transportation and logistics, construction, real estate, and multinationals, to boost workforce productivity and enhance business operations. FFA leverages mobile internet penetration, cloud computing, Internet of Things (IoT), Artificial Intelligence (AI), and connected devices to streamline workflows and improve communication between head office staff and field executives. Cloud-based solutions, including Field Service Management, Enterprise Resource Planning, and Customer Relationship Management systems, offer advanced capabilities such as real-time data analysis, automatic schedules, attendance management, workforce monitoring, and sales automation. Solutions like Oracle Field Service Cloud integrate with CRM systems, providing technicians with access to customer data in real-time, enabling more informed and personalized interactions.
  • In addition, FFA also incorporates ML, robotics, computer vision, and cyberattack protection to ensure accurate data analysis and secure information transmission. Handheld wireless devices enable real-time data entry, reducing errors and improving field executive performance. Overall, FFA empowers businesses to optimize their workflows, improve customer engagement, and enhance operational efficiency.

What are the market trends shaping the Field Force Automation Industry?

strong growth of IT industry is the upcoming market trend.

  • The market is witnessing significant growth due to the advancements in technology, particularly In the IT sector. With the increasing mobile internet penetration and the adoption of cloud computing, connected devices, and IoT, field force automation solutions have become more sophisticated. AI, ML, robotics, computer vision, and advanced analytics are being integrated into these solutions to enhance workforce productivity and efficiency. The transportation and logistics, construction, real estate, and other industries are leveraging these technologies to streamline business operations, improve communication between head office staff and technicians, and optimize workflows. Cloud-based solutions offer real-time data analysis, predictive maintenance, and automatic schedules, while attendance management and workforce monitoring provide greater control and accuracy.
  • In addition, the use of handheld wireless devices enables on-the-go access to data and automates workflows, reducing errors and improving field executive performance. The integration of cybersecurity measures ensures data security, making these solutions a valuable investment for multinationals and businesses of all sizes.

What challenges does the Field Force Automation Industry face during its growth?

Data privacy and security concerns associated with field force automation is a key challenge affecting the industry growth.

  • The Field Force Automation (FFA) market is witnessing significant growth due to the increasing adoption of mobile internet penetration, cloud computing, Internet of Things (IoT), Artificial Intelligence (AI), and connected devices in various industries such as IT and Telecom, transportation and logistics, construction, and real estate. FFA solutions offer advanced capabilities like sales automation, field service management, enterprise resource planning, and customer relationship management through cloud-based solutions. These solutions enable real-time communication and data analysis, improving workforce productivity and performance. FFA solutions also incorporate technologies like ML, robotics, computer vision, and cyberattack protection. Handheld wireless devices enable technicians and head office staff to access automatic schedules, attendance management, workforce monitoring, and advanced analytics in real-time.
  • However, data privacy and security concerns are crucial considerations when implementing FFA solutions. Sensitive customer data, including personal information, financial details, and contact information, must be protected from unauthorized access. Encryption protocols are essential to secure data transmission and prevent interception and misuse. Organizations must adhere to applicable data protection and privacy regulations, such as GDPR and CCPA, to ensure compliance.

Exclusive Customer Landscape

The field force automation market forecasting report includes the adoption lifecycle of the market, covering from the innovator's stage to the laggard's stage. It focuses on adoption rates in different regions based on penetration. Furthermore, the field force automation market report also includes key purchase criteria and drivers of price sensitivity to help companies evaluate and develop their market growth analysis strategies.
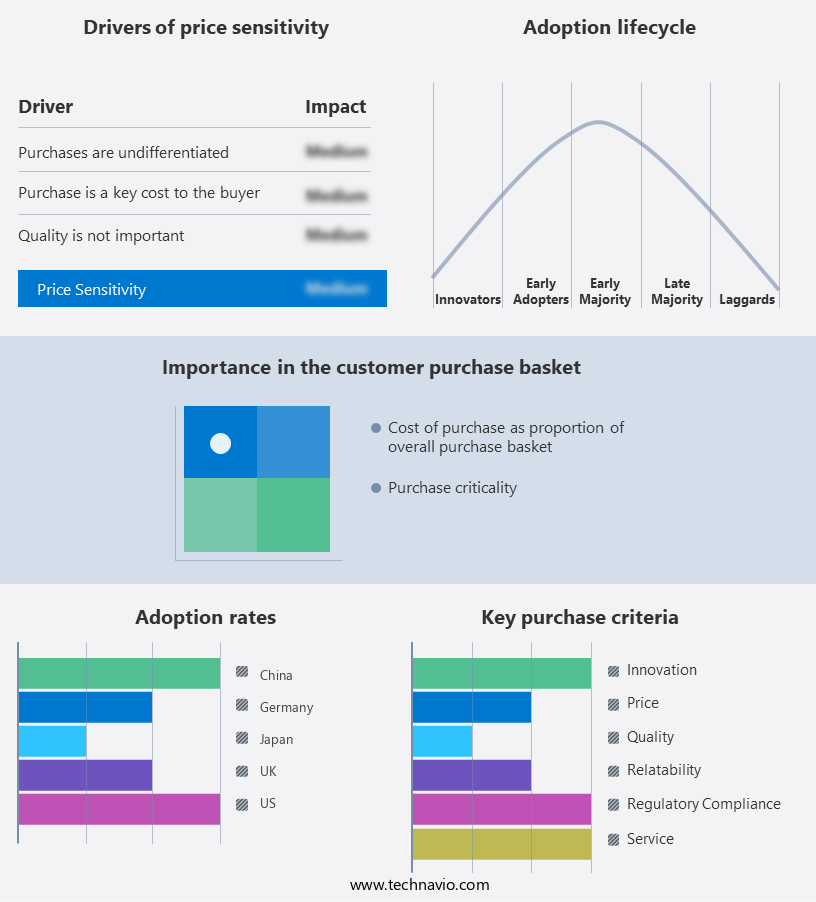
Field Force Automation Market Share by Geography

 Customer Landscape

Key Companies & Market Insights

Companies are implementing various strategies, such as strategic alliances, field force automation market forecast, partnerships, mergers and acquisitions, geographical expansion, and product/service launches, to enhance their presence In the industry.

The industry research and growth report includes detailed analyses of the competitive landscape of the market and information about key companies, including:

  • Abuyo Inc.
  • Accruent
  • Acumatica Inc.
  • BT Group Plc
  • Channelplay Ltd.
  • FieldEZ
  • Folio3 Software Inc.
  • IFS World Operations AB
  • Kloudq Technologies Ltd.
  • MACmobile Pty Ltd.
  • MarketXpander Services Pvt. Ltd.
  • Microsoft Corp.
  • Nimap Infotech
  • Oracle Corp.
  • PTC Inc.
  • Salesforce Inc.
  • SAP SE
  • SPEC India
  • Trimble Inc.
  • Vasista Enterprise Solutions Pvt. Ltd.

Qualitative and quantitative analysis of companies has been conducted to help clients understand the wider business environment as well as the strengths and weaknesses of key industry players. Data is qualitatively analyzed to categorize companies as pure play, category-focused, industry-focused, and diversified; it is quantitatively analyzed to categorize companies as dominant, leading, strong, tentative, and weak.

Research Analyst Overview

Field Force Automation (FFA) is a critical business solution that has gained significant traction in various industries due to the increasing adoption of mobile internet penetration, cloud computing, Internet of Things (IoT), and advanced technologies like AI, ML, robotics, computer vision, and cyberattacks. FFA is transforming IT and telecom, transportation and logistics, construction, real estate, and multinationals by automating sales, workforce productivity, and business operations. FFA solutions enable real-time communication between head office staff and technicians through cloud-based sales automation solutions, field service management, enterprise resource planning, and customer relationship management. These solutions are essential for managing connected devices and ensuring error-free execution of tasks.

In addition, handheld wireless devices are the primary tool for field executives, enabling automatic schedules, attendance management, workforce monitoring, and advanced analytics. AI solutions offer data analysis and workflow automation, enhancing business efficiency and productivity. ML algorithms help in predictive maintenance, while robotics and computer vision provide automated inspections and error detection. Cyberattacks pose a significant challenge to FFA adoption, necessitating strong security measures. Cloud solutions offer scalability, flexibility, and cost savings, making them a preferred choice for businesses. Overall, FFA is revolutionizing business operations by automating workflows, enhancing workforce performance, and improving customer satisfaction.

Market Scope

Report Coverage

Details

Page number

166

Base year

2023

Historic period

2018-2022

Forecast period

2024-2028

Growth momentum & CAGR

Accelerate at a CAGR of 22%

Market growth 2024-2028

USD 3.49 billion

Market structure

Fragmented

YoY growth 2023-2024(%)

17.75

Key countries

US, China, UK, Germany, and Japan

Competitive landscape

Leading Companies, market growth and forecasting , Market Positioning of Companies, Competitive Strategies, and Industry Risks

Request Free Sample

What are the Key Data Covered in this Field Force Automation Market Research and Growth Report?

  • CAGR of the Field Force Automation industry during the forecast period
  • Detailed information on factors that will drive the growth and forecasting between 2024 and 2028
  • Precise estimation of the size of the market and its contribution of the industry in focus to the parent market
  • Accurate predictions about upcoming growth and trends and changes in consumer behaviour
  • Growth of the market across North America, Europe, APAC, Middle East and Africa, and South America
  • Thorough analysis of the market's competitive landscape and detailed information about companies
  • Comprehensive analysis of factors that will challenge the field force automation market growth of industry companies

We can help! Our analysts can customize this field force automation market research report to meet your requirements.

Get in touch

1 Executive Summary

  • 1.1 Market overview
    • Executive Summary - Chart on Market Overview
    • Executive Summary - Data Table on Market Overview
    • Executive Summary - Chart on Global Market Characteristics
    • Executive Summary - Chart on Market by Geography
    • Executive Summary - Chart on Market Segmentation by End-user
    • Executive Summary - Chart on Market Segmentation by Deployment
    • Executive Summary - Chart on Incremental Growth
    • Executive Summary - Data Table on Incremental Growth
    • Executive Summary - Chart on Company Market Positioning

2 Market Landscape

  • 2.1 Market ecosystem
    • Parent Market
    • Data Table on - Parent Market
  • 2.2 Market characteristics
    • Market characteristics analysis
  • 2.3 Value chain analysis
    • Value Chain Analysis

3 Market Sizing

  • 3.1 Market definition
    • Offerings of companies included in the market definition
  • 3.2 Market segment analysis
    • Market segments
  • 3.3 Market size 2023
    • 3.4 Market outlook: Forecast for 2023-2028
      • Chart on Global - Market size and forecast 2023-2028 ($ million)
      • Data Table on Global - Market size and forecast 2023-2028 ($ million)
      • Chart on Global Market: Year-over-year growth 2023-2028 (%)
      • Data Table on Global Market: Year-over-year growth 2023-2028 (%)

    4 Historic Market Size

    • 4.1 Global Field Force Automation Market 2018 - 2022
      • Historic Market Size - Data Table on Global Field Force Automation Market 2018 - 2022 ($ million)
    • 4.2 End-user segment analysis 2018 - 2022
      • Historic Market Size - End-user Segment 2018 - 2022 ($ million)
    • 4.3 Deployment segment analysis 2018 - 2022
      • Historic Market Size - Deployment Segment 2018 - 2022 ($ million)
    • 4.4 Geography segment analysis 2018 - 2022
      • Historic Market Size - Geography Segment 2018 - 2022 ($ million)
    • 4.5 Country segment analysis 2018 - 2022
      • Historic Market Size - Country Segment 2018 - 2022 ($ million)

    5 Five Forces Analysis

    • 5.1 Five forces summary
      • Five forces analysis - Comparison between 2023 and 2028
    • 5.2 Bargaining power of buyers
      • Bargaining power of buyers - Impact of key factors 2023 and 2028
    • 5.3 Bargaining power of suppliers
      • Bargaining power of suppliers - Impact of key factors in 2023 and 2028
    • 5.4 Threat of new entrants
      • Threat of new entrants - Impact of key factors in 2023 and 2028
    • 5.5 Threat of substitutes
      • Threat of substitutes - Impact of key factors in 2023 and 2028
    • 5.6 Threat of rivalry
      • Threat of rivalry - Impact of key factors in 2023 and 2028
    • 5.7 Market condition
      • Chart on Market condition - Five forces 2023 and 2028

    6 Market Segmentation by End-user

    • 6.1 Market segments
      • Chart on End-user - Market share 2023-2028 (%)
      • Data Table on End-user - Market share 2023-2028 (%)
    • 6.2 Comparison by End-user
      • Chart on Comparison by End-user
      • Data Table on Comparison by End-user
    • 6.3 IT and telecom - Market size and forecast 2023-2028
      • Chart on IT and telecom - Market size and forecast 2023-2028 ($ million)
      • Data Table on IT and telecom - Market size and forecast 2023-2028 ($ million)
      • Chart on IT and telecom - Year-over-year growth 2023-2028 (%)
      • Data Table on IT and telecom - Year-over-year growth 2023-2028 (%)
    • 6.4 Healthcare and life sciences - Market size and forecast 2023-2028
      • Chart on Healthcare and life sciences - Market size and forecast 2023-2028 ($ million)
      • Data Table on Healthcare and life sciences - Market size and forecast 2023-2028 ($ million)
      • Chart on Healthcare and life sciences - Year-over-year growth 2023-2028 (%)
      • Data Table on Healthcare and life sciences - Year-over-year growth 2023-2028 (%)
    • 6.5 Manufacturing - Market size and forecast 2023-2028
      • Chart on Manufacturing - Market size and forecast 2023-2028 ($ million)
      • Data Table on Manufacturing - Market size and forecast 2023-2028 ($ million)
      • Chart on Manufacturing - Year-over-year growth 2023-2028 (%)
      • Data Table on Manufacturing - Year-over-year growth 2023-2028 (%)
    • 6.6 Transportation and logistics - Market size and forecast 2023-2028
      • Chart on Transportation and logistics - Market size and forecast 2023-2028 ($ million)
      • Data Table on Transportation and logistics - Market size and forecast 2023-2028 ($ million)
      • Chart on Transportation and logistics - Year-over-year growth 2023-2028 (%)
      • Data Table on Transportation and logistics - Year-over-year growth 2023-2028 (%)
    • 6.7 Others - Market size and forecast 2023-2028
      • Chart on Others - Market size and forecast 2023-2028 ($ million)
      • Data Table on Others - Market size and forecast 2023-2028 ($ million)
      • Chart on Others - Year-over-year growth 2023-2028 (%)
      • Data Table on Others - Year-over-year growth 2023-2028 (%)
    • 6.8 Market opportunity by End-user
      • Market opportunity by End-user ($ million)
      • Data Table on Market opportunity by End-user ($ million)

    7 Market Segmentation by Deployment

    • 7.1 Market segments
      • Chart on Deployment - Market share 2023-2028 (%)
      • Data Table on Deployment - Market share 2023-2028 (%)
    • 7.2 Comparison by Deployment
      • Chart on Comparison by Deployment
      • Data Table on Comparison by Deployment
    • 7.3 On-premises - Market size and forecast 2023-2028
      • Chart on On-premises - Market size and forecast 2023-2028 ($ million)
      • Data Table on On-premises - Market size and forecast 2023-2028 ($ million)
      • Chart on On-premises - Year-over-year growth 2023-2028 (%)
      • Data Table on On-premises - Year-over-year growth 2023-2028 (%)
    • 7.4 Cloud-based - Market size and forecast 2023-2028
      • Chart on Cloud-based - Market size and forecast 2023-2028 ($ million)
      • Data Table on Cloud-based - Market size and forecast 2023-2028 ($ million)
      • Chart on Cloud-based - Year-over-year growth 2023-2028 (%)
      • Data Table on Cloud-based - Year-over-year growth 2023-2028 (%)
    • 7.5 Market opportunity by Deployment
      • Market opportunity by Deployment ($ million)
      • Data Table on Market opportunity by Deployment ($ million)

    8 Customer Landscape

    • 8.1 Customer landscape overview
      • Analysis of price sensitivity, lifecycle, customer purchase basket, adoption rates, and purchase criteria

    9 Geographic Landscape

    • 9.1 Geographic segmentation
      • Chart on Market share by geography 2023-2028 (%)
      • Data Table on Market share by geography 2023-2028 (%)
    • 9.2 Geographic comparison
      • Chart on Geographic comparison
      • Data Table on Geographic comparison
    • 9.3 North America - Market size and forecast 2023-2028
      • Chart on North America - Market size and forecast 2023-2028 ($ million)
      • Data Table on North America - Market size and forecast 2023-2028 ($ million)
      • Chart on North America - Year-over-year growth 2023-2028 (%)
      • Data Table on North America - Year-over-year growth 2023-2028 (%)
    • 9.4 Europe - Market size and forecast 2023-2028
      • Chart on Europe - Market size and forecast 2023-2028 ($ million)
      • Data Table on Europe - Market size and forecast 2023-2028 ($ million)
      • Chart on Europe - Year-over-year growth 2023-2028 (%)
      • Data Table on Europe - Year-over-year growth 2023-2028 (%)
    • 9.5 APAC - Market size and forecast 2023-2028
      • Chart on APAC - Market size and forecast 2023-2028 ($ million)
      • Data Table on APAC - Market size and forecast 2023-2028 ($ million)
      • Chart on APAC - Year-over-year growth 2023-2028 (%)
      • Data Table on APAC - Year-over-year growth 2023-2028 (%)
    • 9.6 Middle East and Africa - Market size and forecast 2023-2028
      • Chart on Middle East and Africa - Market size and forecast 2023-2028 ($ million)
      • Data Table on Middle East and Africa - Market size and forecast 2023-2028 ($ million)
      • Chart on Middle East and Africa - Year-over-year growth 2023-2028 (%)
      • Data Table on Middle East and Africa - Year-over-year growth 2023-2028 (%)
    • 9.7 South America - Market size and forecast 2023-2028
      • Chart on South America - Market size and forecast 2023-2028 ($ million)
      • Data Table on South America - Market size and forecast 2023-2028 ($ million)
      • Chart on South America - Year-over-year growth 2023-2028 (%)
      • Data Table on South America - Year-over-year growth 2023-2028 (%)
    • 9.8 US - Market size and forecast 2023-2028
      • Chart on US - Market size and forecast 2023-2028 ($ million)
      • Data Table on US - Market size and forecast 2023-2028 ($ million)
      • Chart on US - Year-over-year growth 2023-2028 (%)
      • Data Table on US - Year-over-year growth 2023-2028 (%)
    • 9.9 China - Market size and forecast 2023-2028
      • Chart on China - Market size and forecast 2023-2028 ($ million)
      • Data Table on China - Market size and forecast 2023-2028 ($ million)
      • Chart on China - Year-over-year growth 2023-2028 (%)
      • Data Table on China - Year-over-year growth 2023-2028 (%)
    • 9.10 UK - Market size and forecast 2023-2028
      • Chart on UK - Market size and forecast 2023-2028 ($ million)
      • Data Table on UK - Market size and forecast 2023-2028 ($ million)
      • Chart on UK - Year-over-year growth 2023-2028 (%)
      • Data Table on UK - Year-over-year growth 2023-2028 (%)
    • 9.11 Germany - Market size and forecast 2023-2028
      • Chart on Germany - Market size and forecast 2023-2028 ($ million)
      • Data Table on Germany - Market size and forecast 2023-2028 ($ million)
      • Chart on Germany - Year-over-year growth 2023-2028 (%)
      • Data Table on Germany - Year-over-year growth 2023-2028 (%)
    • 9.12 Japan - Market size and forecast 2023-2028
      • Chart on Japan - Market size and forecast 2023-2028 ($ million)
      • Data Table on Japan - Market size and forecast 2023-2028 ($ million)
      • Chart on Japan - Year-over-year growth 2023-2028 (%)
      • Data Table on Japan - Year-over-year growth 2023-2028 (%)
    • 9.13 Market opportunity by geography
      • Market opportunity by geography ($ million)
      • Data Tables on Market opportunity by geography ($ million)

    10 Drivers, Challenges, and Opportunity/Restraints

    • 10.1 Market drivers
      • 10.2 Market challenges
        • 10.3 Impact of drivers and challenges
          • Impact of drivers and challenges in 2023 and 2028
        • 10.4 Market opportunities/restraints

          11 Competitive Landscape

          • 11.1 Overview
            • 11.2 Competitive Landscape
              • Overview on criticality of inputs and factors of differentiation
            • 11.3 Landscape disruption
              • Overview on factors of disruption
            • 11.4 Industry risks
              • Impact of key risks on business

            12 Competitive Analysis

            • 12.1 Companies profiled
              • Companies covered
            • 12.2 Market positioning of companies
              • Matrix on companies position and classification
            • 12.3 Accruent
              • Accruent - Overview
              • Accruent - Product / Service
              • Accruent - Key offerings
            • 12.4 Acumatica Inc.
              • Acumatica Inc. - Overview
              • Acumatica Inc. - Product / Service
              • Acumatica Inc. - Key news
              • Acumatica Inc. - Key offerings
            • 12.5 BT Group Plc
              • BT Group Plc - Overview
              • BT Group Plc - Business segments
              • BT Group Plc - Key offerings
              • BT Group Plc - Segment focus
            • 12.6 Channelplay Ltd.
              • Channelplay Ltd. - Overview
              • Channelplay Ltd. - Product / Service
              • Channelplay Ltd. - Key offerings
            • 12.7 FieldEZ
              • FieldEZ - Overview
              • FieldEZ - Product / Service
              • FieldEZ - Key offerings
            • 12.8 Folio3 Software Inc.
              • Folio3 Software Inc. - Overview
              • Folio3 Software Inc. - Product / Service
              • Folio3 Software Inc. - Key offerings
            • 12.9 MarketXpander Services Pvt. Ltd.
              • MarketXpander Services Pvt. Ltd. - Overview
              • MarketXpander Services Pvt. Ltd. - Product / Service
              • MarketXpander Services Pvt. Ltd. - Key offerings
            • 12.10 Microsoft Corp.
              • Microsoft Corp. - Overview
              • Microsoft Corp. - Business segments
              • Microsoft Corp. - Key news
              • Microsoft Corp. - Key offerings
              • Microsoft Corp. - Segment focus
            • 12.11 Nimap Infotech
              • Nimap Infotech - Overview
              • Nimap Infotech - Product / Service
              • Nimap Infotech - Key offerings
            • 12.12 Oracle Corp.
              • Oracle Corp. - Overview
              • Oracle Corp. - Business segments
              • Oracle Corp. - Key news
              • Oracle Corp. - Key offerings
              • Oracle Corp. - Segment focus
            • 12.13 PTC Inc.
              • PTC Inc. - Overview
              • PTC Inc. - Business segments
              • PTC Inc. - Key news
              • PTC Inc. - Key offerings
              • PTC Inc. - Segment focus
            • 12.14 Salesforce Inc.
              • Salesforce Inc. - Overview
              • Salesforce Inc. - Product / Service
              • Salesforce Inc. - Key news
              • Salesforce Inc. - Key offerings
            • 12.15 SAP SE
              • SAP SE - Overview
              • SAP SE - Business segments
              • SAP SE - Key news
              • SAP SE - Key offerings
              • SAP SE - Segment focus
            • 12.16 SPEC INDIA
              • SPEC INDIA - Overview
              • SPEC INDIA - Product / Service
              • SPEC INDIA - Key offerings
            • 12.17 Trimble Inc.
              • Trimble Inc. - Overview
              • Trimble Inc. - Business segments
              • Trimble Inc. - Key news
              • Trimble Inc. - Key offerings
              • Trimble Inc. - Segment focus

            13 Appendix

            • 13.1 Scope of the report
              • 13.2 Inclusions and exclusions checklist
                • Inclusions checklist
                • Exclusions checklist
              • 13.3 Currency conversion rates for US$
                • Currency conversion rates for US$
              • 13.4 Research methodology
                • Research methodology
              • 13.5 Data procurement
                • Information sources
              • 13.6 Data validation
                • Data validation
              • 13.7 Validation techniques employed for market sizing
                • Validation techniques employed for market sizing
              • 13.8 Data synthesis
                • Data synthesis
              • 13.9 360 degree market analysis
                • 360 degree market analysis
              • 13.10 List of abbreviations
                • List of abbreviations

              Research Methodology

              Technavio presents a detailed picture of the market by way of study, synthesis, and summation of data from multiple sources. The analysts have presented the various facets of the market with a particular focus on identifying the key industry influencers. The data thus presented is comprehensive, reliable, and the result of extensive research, both primary and secondary.

              INFORMATION SOURCES

              Primary sources

              • Manufacturers and suppliers
              • Channel partners
              • Industry experts
              • Strategic decision makers

              Secondary sources

              • Industry journals and periodicals
              • Government data
              • Financial reports of key industry players
              • Historical data
              • Press releases

              DATA ANALYSIS

              Data Synthesis

              • Collation of data
              • Estimation of key figures
              • Analysis of derived insights

              Data Validation

              • Triangulation with data models
              • Reference against proprietary databases
              • Corroboration with industry experts

              REPORT WRITING

              Qualitative

              • Market drivers
              • Market challenges
              • Market trends
              • Five forces analysis

              Quantitative

              • Market size and forecast
              • Market segmentation
              • Geographical insights
              • Competitive landscape

              Interested in this report?

              Get your sample now to see our research methodology and insights!

              Download Now

              Frequently Asked Questions

              Field Force Automation market growth will increase by $ 3488.4 mn during 2024-2028.

              The Field Force Automation market is expected to grow at a CAGR of 22% during 2024-2028.

              Field Force Automation market is segmented by End-user( IT and telecom, Healthcare and life sciences, Manufacturing, Transportation and logistics, Others) Deployment( On-premises, Cloud-based)

              Abuyo Inc., Accruent, Acumatica Inc., BT Group Plc, Channelplay Ltd., FieldEZ, Folio3 Software Inc., IFS World Operations AB, Kloudq Technologies Ltd., MACmobile Pty Ltd., MarketXpander Services Pvt. Ltd., Microsoft Corp., Nimap Infotech, Oracle Corp., PTC Inc., Salesforce Inc., SAP SE, SPEC INDIA, Trimble Inc., Vasista Enterprise Solutions Pvt. Ltd. are a few of the key vendors in the Field Force Automation market.

              APAC will register the highest growth rate of 27% among the other regions. Therefore, the Field Force Automation market in APAC is expected to garner significant business opportunities for the vendors during the forecast period.

              US, China, UK, Germany, Japan

              • Rising demand for field force automation in CRMFFA plays a crucial role in enhancing customer relationship management (CRM) by providing the necessary tools and capabilities to effectively manage field operations and interactions with customers. FFA enables field representatives to have access to real-time customer data is the driving factor this market.
              • including contact information is the driving factor this market.
              • purchase history is the driving factor this market.
              • preferences is the driving factor this market.
              • and previous interactions. This empowers them to have more personalized and informed conversations with customers is the driving factor this market.
              • resulting in enhanced customer engagement and satisfaction. For instance is the driving factor this market.
              • Oracle Field Service Cloud is a cloud-based FFA solution that integrates with Oracle CRM systems. It offers advanced capabilities for intelligent scheduling is the driving factor this market.
              • route optimization is the driving factor this market.
              • dispatch management is the driving factor this market.
              • mobile access is the driving factor this market.
              • and real-time visibility into field operations. Oracle Field Service Cloud enables businesses to optimize their service delivery is the driving factor this market.
              • minimize response times is the driving factor this market.
              • and improve field workforce efficiency. FFA solutions often integrate seamlessly with CRM systems is the driving factor this market.
              • allowing for seamless data synchronization and information sharing between the field and office teams. This integration ensures that all customer-related activities and interactions are accurately recorded and tracked within the CRM is the driving factor this market.
              • providing a holistic view of customer interactions and enabling better-informed decision-making. Thus is the driving factor this market.
              • integration with CRM will positively impact the growth of the global market in focus during the forecast period. is the driving factor this market.

              The Field Force Automation market vendors should focus on grabbing business opportunities from the IT and telecom segment as it accounted for the largest market share in the base year.
              RIA - Research AI Assistant
              Ask RIA