Filling Equipment Market Size 2024-2028
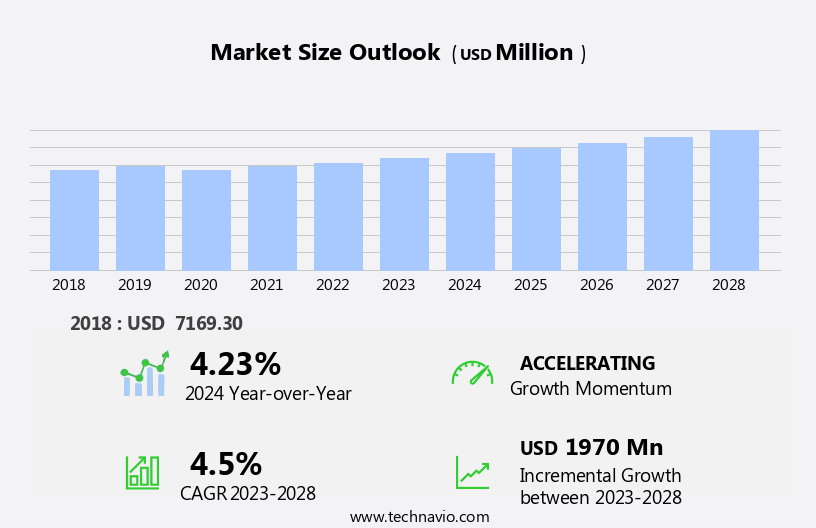
The filling equipment market size is forecast to increase by USD 1.97 billion, at a CAGR of 4.5% between 2023 and 2028.
- The market is experiencing significant growth, driven by the expanding petrochemical and chemical industries in key Asian Pacific countries. This sector's upsurge creates a substantial demand for advanced filling equipment to meet production requirements. In parallel, the US market witnesses an increase in domestic shipments of packaging machinery, further fueling market expansion. However, this market landscape is not without challenges. Hygiene and safety concerns regarding machinery parts are becoming increasingly important, necessitating stringent regulations and quality standards. Companies must invest in research and development to address these issues and ensure their offerings meet the evolving demands of consumers and regulatory bodies.
- Navigating these market dynamics requires strategic planning and a focus on innovation to capitalize on growth opportunities and effectively manage challenges.
What will be the Size of the Filling Equipment Market during the forecast period?
Explore in-depth regional segment analysis with market size data - historical 2018-2022 and forecasts 2024-2028 - in the full report.
Request Free Sample
The market continues to evolve, driven by advancements in technology and increasing demand across various sectors. Output rate optimization and quality control systems are key focus areas, with data acquisition systems and operator interface design playing integral roles. Error detection mechanisms ensure fill level accuracy, while pouch filling systems and gravimetric filling processes streamline production. Bottle filling machinery and can filling equipment undergo automation, reducing changeover time and enhancing material handling efficiency. Volumetric filling methods and precision filling control enable consistent product quality. Filling line efficiency is further boosted through cartoning machine integration and production line monitoring. Sanitation remains a priority, with filling line sanitation and CIP cleaning systems ensuring hygiene standards.
Safety interlocks systems and emergency stop mechanisms safeguard operators and equipment. High-speed filling lines and conveyor belt systems increase productivity, while level sensing technology and filling head design optimize performance. Weight measurement sensors and automation control software facilitate remote diagnostics capabilities, enabling proactive maintenance and reducing downtime. Nozzle sealing mechanisms and powder filling technology cater to diverse product needs. Container filling systems and liquid filling equipment cater to a wide range of industries, with expectations for industry growth remaining robust at 5% annually. A notable example of market dynamism is a leading food manufacturer reducing filler changeover time by 30% through automation and error detection system integration.
This enhancement not only boosted productivity but also improved product quality and customer satisfaction.
How is this Filling Equipment Industry segmented?
The filling equipment industry research report provides comprehensive data (region-wise segment analysis), with forecasts and estimates in "USD million" for the period 2024-2028, as well as historical data from 2018-2022 for the following segments.
- End-user
- Food and beverage
- Pharmaceutical
- Chemicals and petrochemicals
- Others
- Geography
- North America
- US
- Europe
- Germany
- Italy
- APAC
- China
- Japan
- Rest of World (ROW)
- North America
By End-user Insights
The food and beverage segment is estimated to witness significant growth during the forecast period.
The market is primarily driven by the food industry, which held a significant market share in 2023. The increasing urbanization and health consciousness among consumers, coupled with rising disposable incomes, have fueled the demand for healthy and ready-to-eat food. This trend is expected to continue, leading to a surge in the sales of filling equipment used in the food and beverage sector. The global food packaging machinery industry is projected to expand at a steady pace during the forecast period, with APAC being the major contributor. Advancements in technology have significantly influenced the market dynamics. For instance, output rate optimization, quality control systems, and data acquisition systems have become essential components of modern filling equipment.
Operator interface design and error detection mechanisms ensure efficient production and minimize downtime. Filling machine automation, changeover time reduction, and remote diagnostics capabilities have further streamlined operations. Filling equipment manufacturers have also focused on improving fill level accuracy through volumetric and gravimetric filling methods. Precision filling control, emergency stop mechanisms, and high-speed filling lines cater to the increasing demand for faster production. Additionally, product handling systems, automation control software, production line monitoring, and level sensing technology have become crucial for maintaining packaging line efficiency and filling line sanitation. Can filling equipment, material handling efficiency, and container filling systems have also gained significant attention in the market.
CIP cleaning systems, nozzle sealing mechanisms, and safety interlocks systems ensure the hygiene and safety of the filling process. Powder filling technology has emerged as a popular solution for various industries, including pharmaceuticals and food. According to a recent study, The market is expected to grow by over 5% annually during the forecast period. This growth is attributed to the increasing demand for automated and efficient filling solutions across various industries.
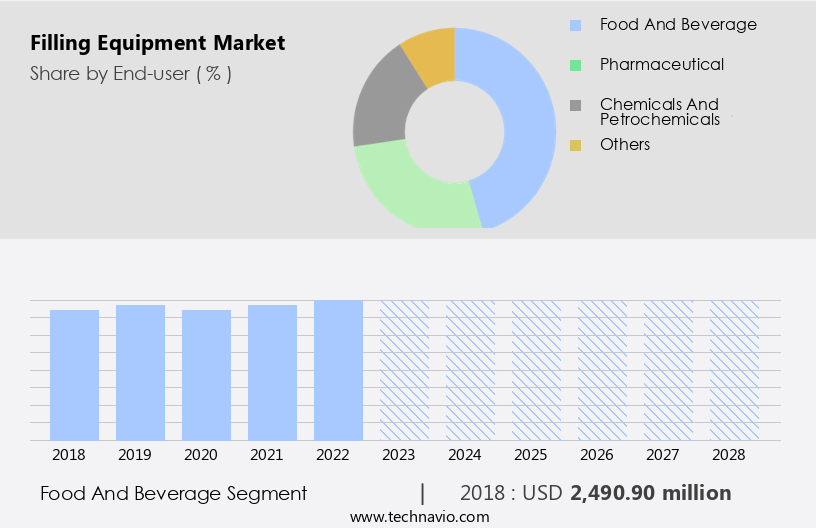
The Food and beverage segment was valued at USD 2.49 billion in 2018 and showed a gradual increase during the forecast period.
Regional Analysis
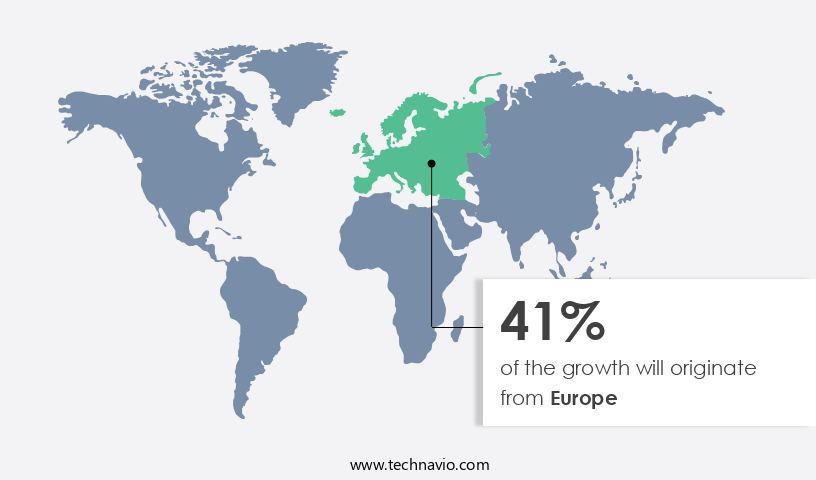
Europe is estimated to contribute 41% to the growth of the global market during the forecast period. Technavio's analysts have elaborately explained the regional trends and drivers that shape the market during the forecast period.
The beverage market in APAC is experiencing significant growth, driven by increasing health awareness and consumer preference for functional beverages like dairy drinks and sports and performance drinks. Factors such as a growing population, rising disposable incomes, and increasing global temperatures are contributing to the demand for non-alcoholic beverages, including carbonated soft drinks (CSDs), juices and concentrates, ready-to-drink (RTD) tea and coffee, and functional drinks. In 2021, China witnessed a steady growth in the beverage sector, with functional drinks and juices being the fastest-growing segments. To meet the rising demand and ensure product quality, filling equipment manufacturers are focusing on output rate optimization and error detection mechanisms.
Advanced data acquisition systems and operator interface designs facilitate real-time monitoring and control, enabling efficient production lines. Filling machine automation and changeover time reduction are essential for maintaining packaging line efficiency and reducing downtime. Fill level accuracy is crucial for ensuring product consistency and customer satisfaction. Pouch filling systems and volumetric filling methods are gaining popularity due to their flexibility and cost-effectiveness. Liquid filling equipment, including bottle filling machinery and can filling equipment, requires precision filling control and emergency stop mechanisms for safety. Gravimetric filling processes and container filling systems are essential for handling various types of beverages and containers.
Material handling efficiency and conveyor belt systems are vital for maintaining a smooth production flow. Remote diagnostics capabilities and automation control software enable predictive maintenance and real-time production line monitoring. Filling line sanitation and CIP cleaning systems are crucial for maintaining product quality and ensuring food safety. Level sensing technology and filling head design are essential for accurate filling and minimizing product waste. Powder filling technology and nozzle sealing mechanisms are important for handling powders and other non-liquid beverages. The beverage industry is expected to grow by over 5% annually during the forecast period, driven by increasing consumer demand and technological advancements in filling equipment.
Companies are investing in advanced filling systems to improve production efficiency, reduce costs, and meet evolving consumer preferences.
Market Dynamics
Our researchers analyzed the data with 2023 as the base year, along with the key drivers, trends, and challenges. A holistic analysis of drivers will help companies refine their marketing strategies to gain a competitive advantage.
The market is experiencing significant growth due to the increasing demand for automated and efficient production processes in various industries. Volumetric filler accuracy testing methods are crucial in ensuring product consistency and quality, making them a key focus in the market. In the realm of high-speed liquid filling lines, design optimization is essential to maximize throughput and minimize waste. Powder filling machines require meticulous hopper design to prevent product contamination and maintain precision filling control for viscous liquids. Automated container filling systems are increasingly integrated into production lines to streamline processes and reduce labor costs. Advanced filling equipment maintenance scheduling and real-time production monitoring using SCADA systems enable predictive maintenance and efficient filling line changeover procedures. Improving filling line sanitation protocols is another critical factor in maintaining product quality and ensuring regulatory compliance. Optimizing filling machine output rate for various products is a significant consideration for manufacturers, with advanced level sensing technology for filling machines playing a key role. Integration of filling equipment with packaging machinery and design considerations for improved filling equipment accessibility are also essential aspects of the market. Reducing downtime through effective maintenance strategies and implementing safety protocols on filling equipment are essential for ensuring operational efficiency and employee safety. The filling system market caters to various industries, including pharmaceuticals, food, and chemicals, with specialized equipment designed for each sector. Filling equipment for cosmetics and industrial applications also forms a significant portion of the market. Overall, the market is driven by the need for increased productivity, improved product quality, and regulatory compliance.
What are the key market drivers leading to the rise in the adoption of Filling Equipment Industry?
- The petrochemical and chemical industries' expansion in leading Asian Pacific countries serve as the primary catalyst for market growth.
- The market experiences significant growth due to the expanding petrochemical and chemical industries. These industries, particularly in regions like India, witness robust expansion driven by increased demand from sectors such as process, manufacturing, and agriculture. Petrochemical and chemical plants encompass a wide range of facilities, including methanol, ethylene, and fertilizer plants. In these facilities, filling equipment plays a crucial role, facilitating fluid transfer between processes in the chemical industry. Despite economic challenges, including high debt levels and overcapacity, China remains a dominant force in the petrochemical market, both in production and consumption. China's leading position in the global chemical industry is evident, with the country being among the largest contributors to the production and consumption of base chemicals.
- For instance, the demand for polyethylene in China grew by 7% in 2020, underscoring the market's resilience and potential for growth. The market is poised to benefit from this industry expansion, with industry experts anticipating a 5% annual growth rate in the coming years.
What are the market trends shaping the Filling Equipment Industry?
- The rising trend in the United States involves an increase in domestic shipments of packaging machinery. This development signifies a significant market movement within the industry.
- The US packaging machinery market is experiencing significant growth, driven primarily by the food and beverage industry. Approximately 60% of the market expansion is attributed to this sector. Factors fueling the growth of the beverage market in the US include population growth, urbanization, and the emergence of a larger middle class. The demand for packaging machinery is increasing due to the need for labeling, decorating and coding, and case handling equipment.
- The pharmaceutical and beverage industries are the major contributors to the US packaging machinery market, with the pharmaceutical sector projected to expand at the fastest rate in 2022, followed closely by the beverage industry.
What challenges does the Filling Equipment Industry face during its growth?
- The hygiene and safety concerns associated with machinery parts represent a significant challenge to the industry's growth, necessitating continuous efforts to ensure compliance with stringent regulations and standards.
- Packaging equipment plays a crucial role in preserving the quality and extending the shelf life of various consumer products, particularly in the beverage and food industries. To meet stringent hygiene standards, manufacturers prioritize equipment with features such as easy cleaning and sanitary processing. For instance, an auto-drain option is essential to prevent microbial growth from residual liquids and contamination from leftover cleaning fluids.
- The packaging process must also ensure airtight seals to protect the product from contamination. The global packaging equipment market is expected to grow by 5% annually, driven by increasing consumer demand for convenient and safe packaging solutions.
Exclusive Customer Landscape
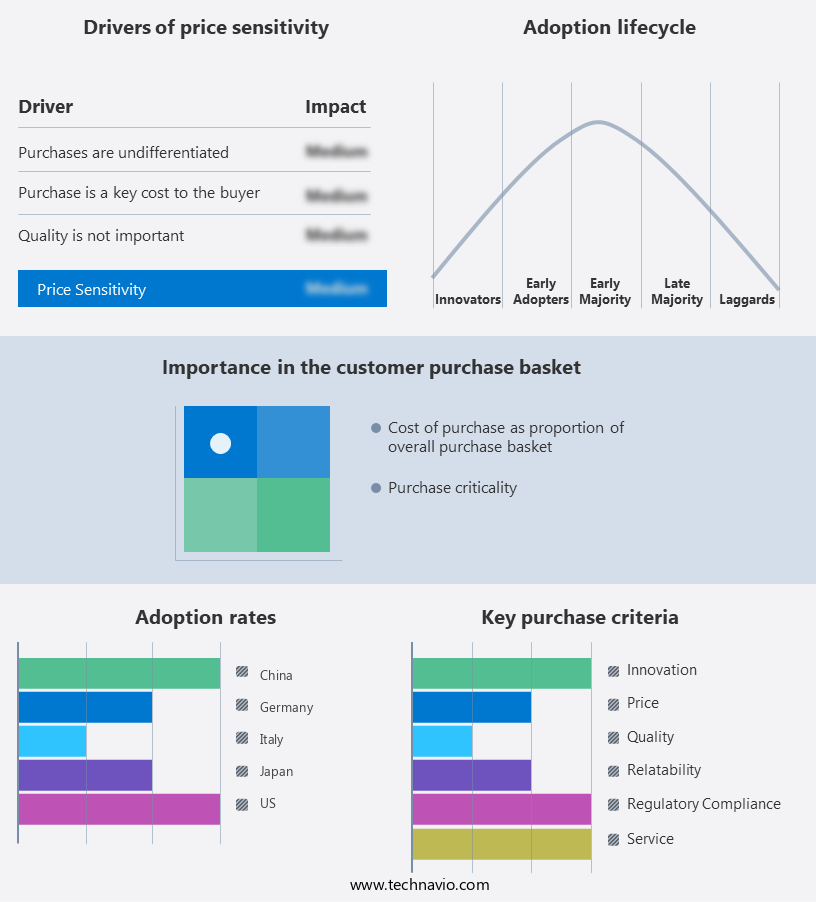
The filling equipment market forecasting report includes the adoption lifecycle of the market, covering from the innovator's stage to the laggard's stage. It focuses on adoption rates in different regions based on penetration. Furthermore, the filling equipment market report also includes key purchase criteria and drivers of price sensitivity to help companies evaluate and develop their market growth analysis strategies.
Customer Landscape
Key Companies & Market Insights
Companies are implementing various strategies, such as strategic alliances, filling equipment market forecast, partnerships, mergers and acquisitions, geographical expansion, and product/service launches, to enhance their presence in the industry.
ACASI Machinery Inc. - The company specializes in providing advanced volumetric and weigh filling solutions through its Masterfil product line.
The industry research and growth report includes detailed analyses of the competitive landscape of the market and information about key companies, including:
- ACASI Machinery Inc.
- Adelphi Holdings Ltd. Inc.
- Aetnagroup S.p.A
- Barry Wehmiller Group Inc.
- Coesia SpA
- E PAK Machinery Inc.
- Feige FILLING GmbH
- Filamatic
- FILLING EQUIPMENT Co. Inc.
- GEA Group AG
- John Bean Technologies Corp.
- Krones AG
- Marchesini Group Spa
- Rapak
- Ronchi Mario SpA
- Shanghai Dahe Packing Machinery Co. Ltd.
- Shanghai Xingfei Packaging Machinery Co. Ltd.
- Syntegon Technology GmbH
- Tetra Pak Group
- Wenzhou Runli Machinery Co. Ltd
Qualitative and quantitative analysis of companies has been conducted to help clients understand the wider business environment as well as the strengths and weaknesses of key industry players. Data is qualitatively analyzed to categorize companies as pure play, category-focused, industry-focused, and diversified; it is quantitatively analyzed to categorize companies as dominant, leading, strong, tentative, and weak.
Recent Development and News in Filling Equipment Market
- In January 2024, Tetra Pak, a leading food processing and packaging solutions company, introduced its new filling equipment line, the Tetra Pak Filling Machine Series C, designed for high-speed processing of various beverages and food products (Tetra Pak Press Release, 2024). This innovative equipment offers improved efficiency and sustainability, making it a significant advancement in the market.
- In March 2024, Schneider Electric, a global energy management and automation solutions provider, announced a strategic partnership with Krones, a leading supplier of filling and packaging technology for the beverage industry. The collaboration aims to integrate Schneider Electric's EcoStruxure platform with Krones' filling equipment, enhancing the efficiency and connectivity of beverage production lines (Schneider Electric Press Release, 2024).
- In May 2024, Bosch Packaging Technology, a leading supplier of process and packaging technology, completed the acquisition of SIG Combibloc, a Swiss company specializing in aseptic carton packaging systems. The acquisition strengthened Bosch's position in the market, expanding its product portfolio and enhancing its presence in the carton packaging sector (Bosch Press Release, 2024).
- In January 2025, the European Union (EU) approved new regulations on single-use plastics, including a ban on certain single-use plastic items and a requirement for companies to ensure at least 25% of their plastic packaging is reusable or recyclable by 2025. This regulatory shift is expected to drive demand for filling equipment that supports the production of reusable and recyclable packaging (European Commission Press Release, 2025).
Research Analyst Overview
- The market for filling equipment continues to evolve, driven by advancements in technology and the diverse needs of various industries. Net weight fillers and piston filling machines are commonly used in the food and beverage sector, while auger fillers and gross weight fillers dominate the chemical industry. Process validation techniques and human-machine interfaces ensure product quality and regulatory compliance. SCADA systems and performance monitoring dashboards facilitate energy efficiency and process optimization. For instance, the implementation of a predictive maintenance system in a food processing plant led to a 20% reduction in downtime and increased production efficiency. The industry is expected to grow at a steady pace, with estimates suggesting a 5% annual increase in demand for filling equipment over the next five years.
- This growth is attributed to the continuous adoption of automation, increasing focus on product traceability, and the need for filling equipment that adheres to stringent food safety standards. Moreover, the integration of technologies such as flow meters, servo motors, and PLC control systems enhances the capabilities of filling equipment, enabling waste reduction strategies and capacity planning tools. Label application systems and code marking systems ensure accurate and efficient product identification, while filling equipment maintenance and production scheduling software optimize overall operations.
Dive into Technavio's robust research methodology, blending expert interviews, extensive data synthesis, and validated models for unparalleled Filling Equipment Market insights. See full methodology.
|
Market Scope |
|
|
Report Coverage |
Details |
|
Page number |
147 |
|
Base year |
2023 |
|
Historic period |
2018-2022 |
|
Forecast period |
2024-2028 |
|
Growth momentum & CAGR |
Accelerate at a CAGR of 4.5% |
|
Market growth 2024-2028 |
USD 1970 million |
|
Market structure |
Fragmented |
|
YoY growth 2023-2024(%) |
4.23 |
|
Key countries |
China, US, Germany, Italy, and Japan |
|
Competitive landscape |
Leading Companies, Market Positioning of Companies, Competitive Strategies, and Industry Risks |
What are the Key Data Covered in this Filling Equipment Market Research and Growth Report?
- CAGR of the Filling Equipment industry during the forecast period
- Detailed information on factors that will drive the growth and forecasting between 2024 and 2028
- Precise estimation of the size of the market and its contribution of the industry in focus to the parent market
- Accurate predictions about upcoming growth and trends and changes in consumer behaviour
- Growth of the market across APAC, Europe, North America, South America, and Middle East and Africa
- Thorough analysis of the market's competitive landscape and detailed information about companies
- Comprehensive analysis of factors that will challenge the filling equipment market growth of industry companies
We can help! Our analysts can customize this filling equipment market research report to meet your requirements.
 RIA -
RIA - 
