Fine Arts Logistics Market Analysis, Size, and Forecast 2026-2030: North America (US, Canada, and Mexico), Europe (UK, Germany, and France), APAC (China, Japan, and India), South America (Brazil and Argentina), Middle East and Africa (UAE, Saudi Arabia, and South Africa), and Rest of World (ROW)

Fine Arts Logistics Market Analysis, Size, and Forecast 2026-2030:
North America (US, Canada, and Mexico), Europe (UK, Germany, and France), APAC (China, Japan, and India), South America (Brazil and Argentina), Middle East and Africa (UAE, Saudi Arabia, and South Africa), and Rest of World (ROW)

Published: Mar 2026 307 Pages SKU: IRTNTR74012

Market Overview at a Glance

$970.8 Mn
Market Opportunity
4.4%
CAGR 2025 - 2030
44.2%
North America Growth
$1.68 B
Art dealers and galleries segment 2024

Fine Arts Logistics Market Size 2026-2030

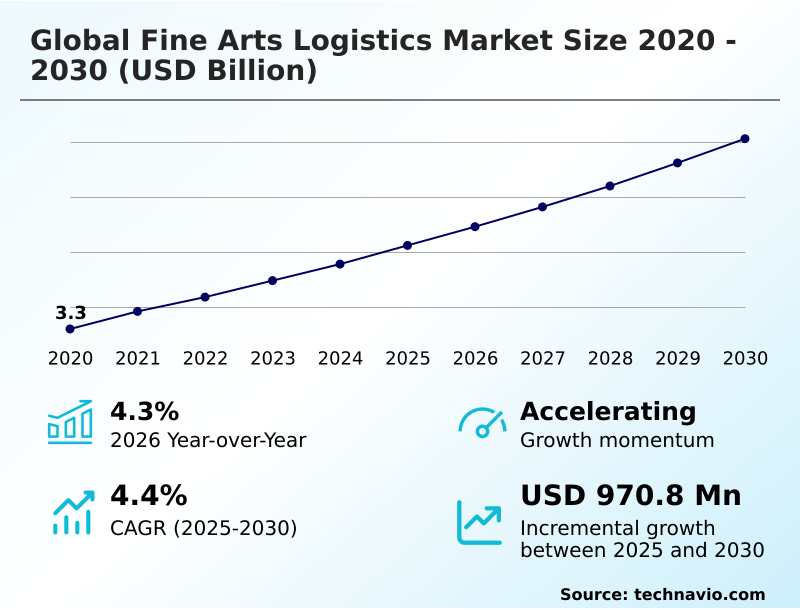
The fine arts logistics market size is valued to increase by USD 970.8 million, at a CAGR of 4.4% from 2025 to 2030. Implementation of complex trade policies and surging demand for integrated customs brokerage will drive the fine arts logistics market.

Major Market Trends & Insights

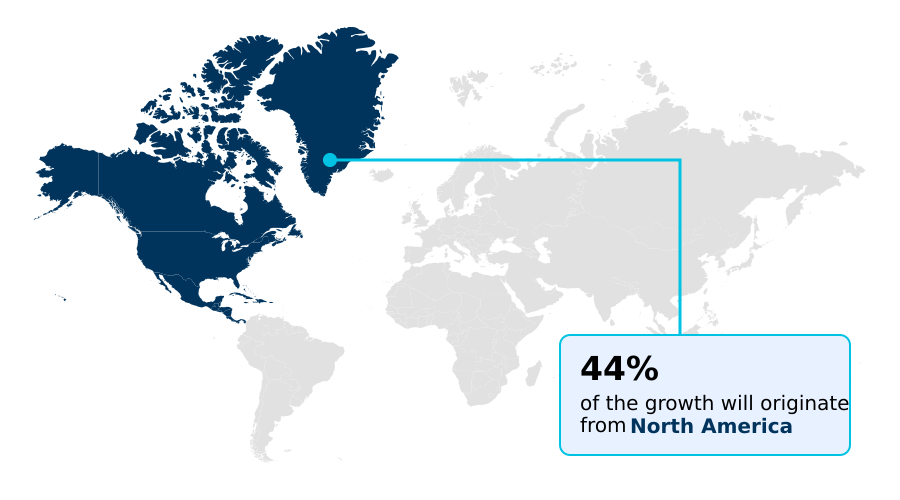
  • North America dominated the market and accounted for a 44.2% growth during the forecast period.
  • By End-user - Art dealers and galleries segment was valued at USD 1.68 billion in 2024
  • By Type - Transportation segment accounted for the largest market revenue share in 2024

Market Size & Forecast

  • Market Opportunities: USD 1.72 billion
  • Market Future Opportunities: USD 970.8 million
  • CAGR from 2025 to 2030 : 4.4%

Market Summary

  • The fine arts logistics market is undergoing a profound evolution, driven by the financialization of art and the globalization of cultural exhibitions. This necessitates a shift from basic transport to comprehensive, high-value service chains. Specialized providers now function as supply chain architects, offering solutions that include climate-controlled shipping, hyper-secure warehousing, and expert legal compliance navigation.
  • A key business scenario involves a gallery orchestrating a multi-city exhibition tour for a major artist. It relies on a single logistics partner to manage everything from museum-grade crating and air-ride suspension vehicles to complex customs brokerage and time-critical exhibition logistics.
  • By leveraging blockchain-based provenance and real-time IoT tracking, the gallery ensures an unbroken chain-of-custody documentation, satisfying fine art insurance underwriting requirements and facilitating seamless white-glove installation at each venue. This integrated approach, which includes the use of freeport facilities for tax-advantaged storage, is becoming the standard for protecting and managing high-value cultural assets in a complex global landscape.

What will be the Size of the Fine Arts Logistics Market during the forecast period?

Get Key Insights on Market Forecast (PDF) Request Free Sample

How is the Fine Arts Logistics Market Segmented?

The fine arts logistics industry research report provides comprehensive data (region-wise segment analysis), with forecasts and estimates in "USD million" for the period 2026-2030, as well as historical data from 2020-2024 for the following segments.
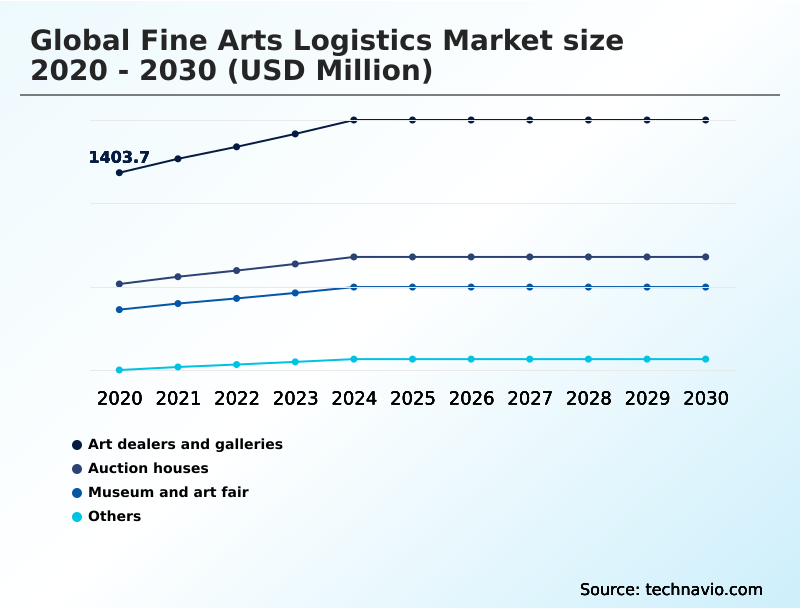
  • End-user
    • Art dealers and galleries
    • Auction houses
    • Museum and art fair
    • Others
  • Type
    • Transportation
    • Storage
    • Packaging
    • Others
  • Product type
    • Paintings
    • Sculptures
    • Antiques
    • Photography
    • Others
  • Geography
    • North America
      • US
      • Canada
      • Mexico
    • Europe
      • UK
      • Germany
      • France
    • APAC
      • China
      • Japan
      • India
    • South America
      • Brazil
      • Argentina
    • Middle East and Africa
      • UAE
      • Saudi Arabia
      • South Africa
    • Rest of World (ROW)

By End-user Insights

The art dealers and galleries segment is estimated to witness significant growth during the forecast period.

The art dealers and galleries segment is a primary driver for the fine arts logistics market, with entities ranging from boutique dealers to multinational franchises requiring specialized transportation and storage.

The globalization of the commercial art sector necessitates sophisticated international freight forwarding and expert customs clearance to move high-value pieces across borders.

A critical shift is the integration of e-commerce, which has transformed operational needs, demanding direct-to-consumer shipping solutions that maintain stringent environmental controls. Supporting this, providers offer end-to-end services including bespoke crating and white-glove installation.

This pivot to digital has improved efficiency, with some galleries increasing their e-commerce fulfillment speed fivefold by synchronizing inventory and shipping, significantly reducing manual handling errors and enhancing client satisfaction.

Request Free Sample

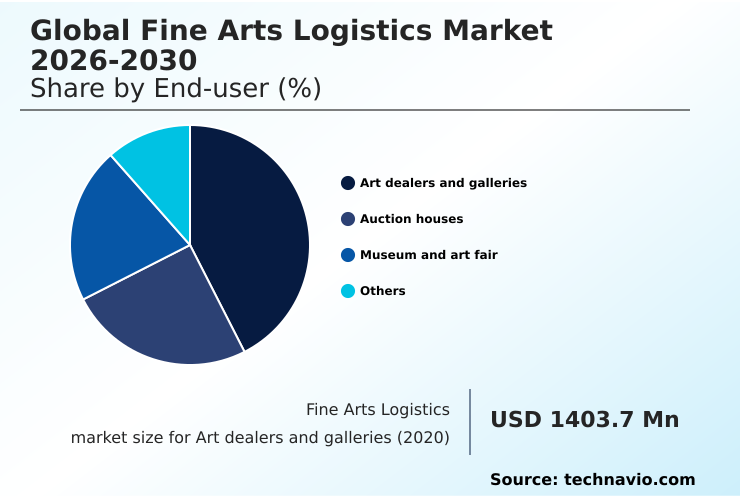
The Art dealers and galleries segment was valued at USD 1.68 billion in 2024 and showed a gradual increase during the forecast period.

Request Free Sample

Regional Analysis

North America is estimated to contribute 44.2% to the growth of the global market during the forecast period.Technavio’s analysts have elaborately explained the regional trends and drivers that shape the market during the forecast period.

See How Fine Arts Logistics Market Demand is Rising in North America Request Free Sample

The geographic landscape of the market is defined by a dichotomy between established and emerging hubs.

North America accounts for over 44% of the market's incremental growth, driven by its dense concentration of collectors and institutions demanding sophisticated solutions like air-ride suspension vehicles and specialized customs brokerage services.

In contrast, APAC is the fastest-growing region, where the primary challenge is mitigating extreme environmental conditions. Here, logistics providers deploying advanced climate control systems have been shown to reduce humidity-related damage to sensitive artworks by over 60%.

This investment in technology, including vibration-dampening technology and sustainable logistics practices, is critical for serving new institutional art hubs and managing time-critical exhibition logistics, ensuring the region’s successful integration into the global art trade and securing its position as a major center for art commerce.

Market Dynamics

Our researchers analyzed the data with 2025 as the base year, along with the key drivers, trends, and challenges. A holistic analysis of drivers will help companies refine their marketing strategies to gain a competitive advantage.

  • Navigating the fine arts logistics market requires a deep understanding of its intricate cost structures and operational demands. The cost of climate-controlled art transport is a primary consideration for collectors and institutions, who must balance expense against the risk of irreparable damage.
  • Best practices for packing paintings for shipping, which involve multi-layered, climate-buffered casing, differ significantly from the engineering required for how to ship large sculptures internationally, a process often involving custom rigging and specialized flatbed transit. The financial strategy extends to storage, where the tax implications of freeport art storage are making these facilities integral for high-value portfolio management.
  • Concurrently, a push for environmental responsibility is promoting sustainable alternatives to wooden art crates, with some reusable solutions reducing packaging costs by up to 25% over a three-year cycle compared to single-use options. This shift aligns with evolving insurance requirements for museum loans, which increasingly scrutinize the entire logistics chain.
  • These factors compound the existing challenges in cross-border art logistics, where using IoT for tracking valuable artwork and understanding environmental controls for photographic art storage are becoming standard expectations. Furthermore, navigating logistics for major events like Art Basel Qatar demands a level of precision and technological integration that defines the top tier of the industry.

What are the key market drivers leading to the rise in the adoption of Fine Arts Logistics Industry?

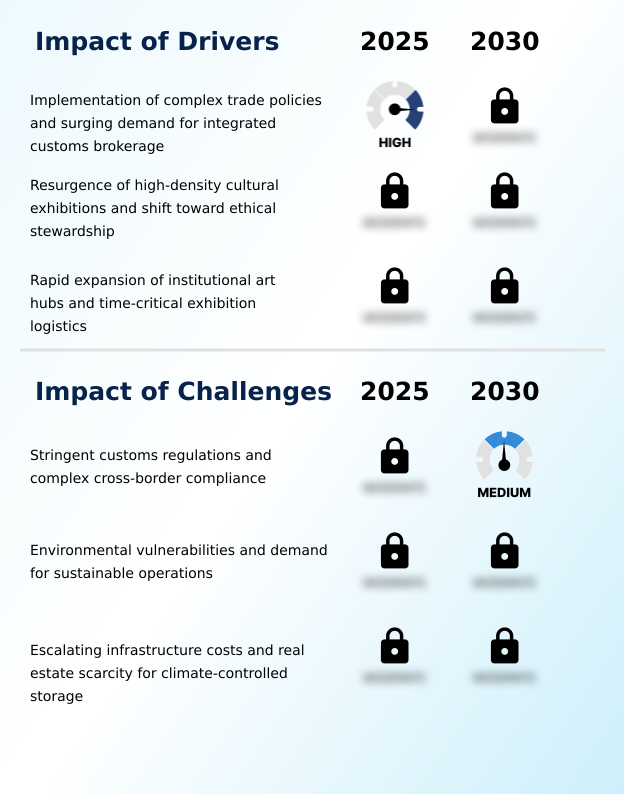
  • The implementation of complex trade policies is a key market driver, fueling surging demand for integrated customs brokerage solutions.

  • Market growth is propelled by the convergence of regulatory complexity, cultural expansion, and institutional demand.
  • The implementation of complex international trade policies has created an urgent need for integrated customs brokerage services, where specialized providers can reduce tariff-related penalties by more than 95%.
  • Simultaneously, a global resurgence of high-density cultural exhibitions and art fairs fuels demand for flawless, time-critical exhibition logistics, including museum-grade crating and white-glove installation.
  • This is particularly evident in emerging economic regions, where the demand for specialized exhibition logistics has grown by 50% in recent years.
  • This rapid expansion of institutional art hubs, especially in APAC, compels logistics organizations to scale resources and deliver unparalleled precision to support the globalization of the fine art trade through services like monumental sculpture rigging and secure art storage solutions.

What are the market trends shaping the Fine Arts Logistics Industry?

  • The integration of advanced digitalization and the Internet of Things (IoT) for real-time tracking is a transformative trend, enhancing transparency and security throughout the fine art supply chain.

  • The market is being reshaped by three dominant trends: digitalization, sustainability, and infrastructural innovation. Advanced digitalization, including IoT tracking and blockchain-based provenance verification, provides unprecedented transparency. This technology can expedite customs clearance by up to 40% by offering immutable chain-of-custody documentation.
  • Secondly, a profound shift towards decarbonization and sustainable art handling practices is compelling providers to adopt reusable packaging materials, with some solutions reducing packaging waste by over 85%. This push for sustainable logistics is transforming operational models. Finally, the proliferation of elite, airport-adjacent freeport facilities meets the demand for hyper-secure, tax-advantaged art investment storage.
  • These hubs are becoming autonomous ecosystems, offering services like on-site conservation and private viewing rooms, thereby streamlining the global art trade and ensuring the meticulous preservation of priceless assets.

What challenges does the Fine Arts Logistics Industry face during its growth?

  • Stringent customs regulations and the complexities of cross-border compliance present a primary challenge to the industry's growth.

  • The market confronts significant operational and financial challenges. Stringent customs regulations and complex cross-border compliance demand substantial investment in legal expertise and technology, as even minor errors can lead to costly delays. Balancing the intensive energy needs of art preservation with sustainability mandates presents another hurdle; constructing a single climate-controlled storage facility can cost 200% more than a standard warehouse.
  • Furthermore, the operational expenses for fine art insurance underwriting, specialized packaging, and advanced security, coupled with real estate scarcity in global art hubs, continue to escalate.
  • The energy consumption required for active climate control in these facilities can account for up to 70% of operational costs, creating a profound paradox for firms striving to meet both preservation standards and environmental targets. These pressures are compelling consolidation and strategic partnerships to share the financial burden of infrastructure development.

Exclusive Technavio Analysis on Customer Landscape

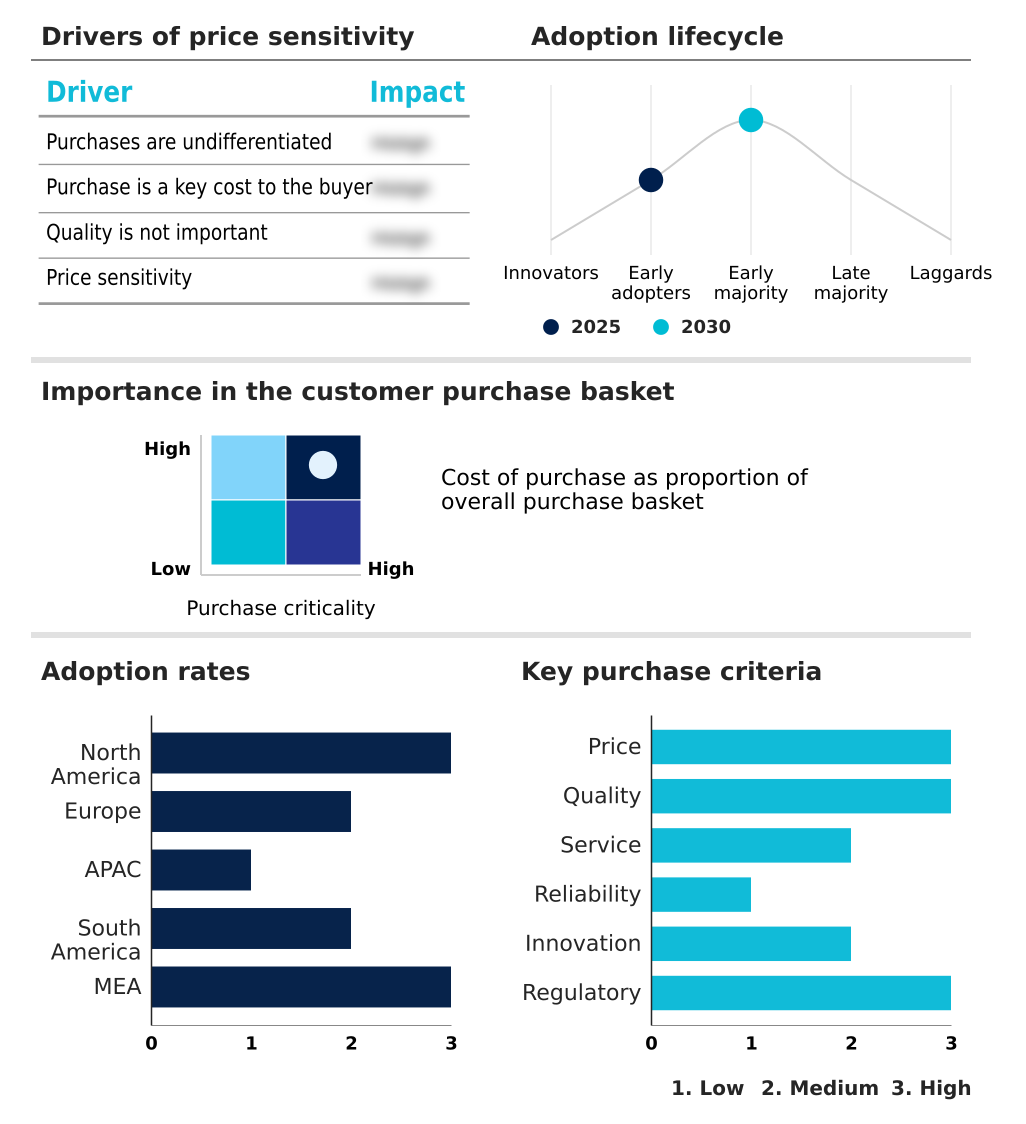
The fine arts logistics market forecasting report includes the adoption lifecycle of the market, covering from the innovator’s stage to the laggard’s stage. It focuses on adoption rates in different regions based on penetration. Furthermore, the fine arts logistics market report also includes key purchase criteria and drivers of price sensitivity to help companies evaluate and develop their market growth analysis strategies.

Customer Landscape of Fine Arts Logistics Industry

Competitive Landscape

Companies are implementing various strategies, such as strategic alliances, fine arts logistics market forecast, partnerships, mergers and acquisitions, geographical expansion, and product/service launches, to enhance their presence in the industry.

Artex Art Services s.r.o. - Technology-driven platforms enhance operational efficiency by streamlining global shipping, customs management, and insurance for high-value artworks and collectibles.

The industry research and growth report includes detailed analyses of the competitive landscape of the market and information about key companies, including:

  • Artex Art Services s.r.o.
  • Atelier 4 Inc.
  • Bovis Group
  • Cadogan Tate Group Ltd
  • Constantine Ltd
  • CONVELIO SAS
  • Crozier Fine Arts Inc.
  • Dietl International Services Inc.
  • DSV AS
  • Gander and White Shipping Ltd
  • hasenkamp Holding GmbH
  • KunstTrans Holding GmbH
  • Masterpiece International Ltd
  • Momart Ltd
  • Mtec Fine Art Ltd.
  • Poul Schou AS
  • Rock it Cargo USA LLC
  • uShip Inc.
  • Yamato Transport Co. Ltd.

Qualitative and quantitative analysis of companies has been conducted to help clients understand the wider business environment as well as the strengths and weaknesses of key industry players. Data is qualitatively analyzed to categorize companies as pure play, category-focused, industry-focused, and diversified; it is quantitatively analyzed to categorize companies as dominant, leading, strong, tentative, and weak.

Recent Development and News in Fine arts logistics market

  • In August 2025, Hasenkamp Group acquired a minority stake in the Scandinavian specialist logistics company MTAB to expand high-quality specialized logistics capabilities for sensitive cultural goods across Northern Europe.
  • In April 2025, Convelio expanded its integrated customs and compliance ecosystem in the United States to help clients navigate new import tariffs, providing insulated transit solutions to bypass freight industry delays.
  • In March 2025, Adexin introduced a suite of software solutions integrating artificial intelligence, blockchain, and IoT sensors to streamline logistics, tracking, and security for the North American art transport sector.
  • In April 2025, the Airport Authority Hong Kong formalized plans to integrate a massive, standalone fine art storage facility into its Skytopia airport city to attract global family offices and support the trading of private art collections.

Dive into Technavio’s robust research methodology, blending expert interviews, extensive data synthesis, and validated models for unparalleled Fine Arts Logistics Market insights. See full methodology.

Market Scope
Page number 307
Base year 2025
Historic period 2020-2024
Forecast period 2026-2030
Growth momentum & CAGR Accelerate at a CAGR of 4.4%
Market growth 2026-2030 USD 970.8 million
Market structure Fragmented
YoY growth 2025-2026(%) 4.3%
Key countries US, Canada, Mexico, UK, Germany, France, Italy, Switzerland, The Netherlands, China, Japan, India, South Korea, Singapore, Australia, Brazil, Argentina, Chile, UAE, Saudi Arabia, South Africa, Israel and Qatar
Competitive landscape Leading Companies, Market Positioning of Companies, Competitive Strategies, and Industry Risks

Request Free Sample

Research Analyst Overview

  • The fine arts logistics market is maturing into a highly sophisticated sector where operational excellence is intrinsically linked to technological adoption and infrastructure investment. The core service of climate-controlled shipping is now table stakes; competitive differentiation is achieved through integrated offerings like museum-grade crating, expert customs brokerage, and flawless white-glove installation.
  • A pivotal trend influencing boardroom decisions on capital expenditure is the convergence of sustainability and technology. For instance, investments in IoT tracking systems, which can reduce asset misplacement incidents by over 90%, are often paired with the adoption of reusable packaging materials as part of a broader sustainable logistics strategy.
  • This requires advanced infrastructure, from freeport facilities with geothermal heating to air-ride suspension vehicles and fleets that support vibration-dampening technology. Ensuring security through biometric security controls and providing transparent chain-of-custody documentation via blockchain-based provenance are no longer niche offerings but central to managing risk and meeting the demands of time-critical exhibition logistics in a globalized art economy.

What are the Key Data Covered in this Fine Arts Logistics Market Research and Growth Report?

  • What is the expected growth of the Fine Arts Logistics Market between 2026 and 2030?

    • USD 970.8 million, at a CAGR of 4.4%

  • What segmentation does the market report cover?

    • The report is segmented by End-user (Art dealers and galleries, Auction houses, Museum and art fair, and Others), Type (Transportation, Storage, Packaging, and Others), Product Type (Paintings, Sculptures, Antiques, Photography, and Others) and Geography (North America, Europe, APAC, South America, Middle East and Africa)

  • Which regions are analyzed in the report?

    • North America, Europe, APAC, South America and Middle East and Africa

  • What are the key growth drivers and market challenges?

    • Implementation of complex trade policies and surging demand for integrated customs brokerage, Stringent customs regulations and complex cross-border compliance

  • Who are the major players in the Fine Arts Logistics Market?

    • Artex Art Services s.r.o., Atelier 4 Inc., Bovis Group, Cadogan Tate Group Ltd, Constantine Ltd, CONVELIO SAS, Crozier Fine Arts Inc., Dietl International Services Inc., DSV AS, Gander and White Shipping Ltd, hasenkamp Holding GmbH, KunstTrans Holding GmbH, Masterpiece International Ltd, Momart Ltd, Mtec Fine Art Ltd., Poul Schou AS, Rock it Cargo USA LLC, uShip Inc. and Yamato Transport Co. Ltd.

Market Research Insights

  • Market dynamics are increasingly shaped by a focus on risk mitigation and efficiency, where the adoption of digital condition reporting has reduced insurance disputes by over 30%. Comprehensive secure art storage solutions are pivotal, as is sophisticated exhibition logistics management to support global art fairs.
  • For private collector services, the emphasis is on discretion and flawless execution, while museum loan logistics demand impeccable provenance records. Specialized packing protocols, which can decrease transit damage incidents by up to 95% compared to standard freight, are crucial for both auction house logistics and international art shipping.
  • Furthermore, effective gallery inventory management systems provide the transparency needed for art investment storage, with many clients now requiring full customs compliance for art as part of any end-to-end service.

We can help! Our analysts can customize this fine arts logistics market research report to meet your requirements.

Get in touch

1. Executive Summary

1.1 Market overview

Executive Summary - Chart on Market Overview
Executive Summary - Data Table on Market Overview
Executive Summary - Chart on Global Market Characteristics
Executive Summary - Chart on Market by Geography
Executive Summary - Chart on Market Segmentation by End-user
Executive Summary - Chart on Market Segmentation by Type
Executive Summary - Chart on Market Segmentation by Product Type
Executive Summary - Chart on Incremental Growth
Executive Summary - Data Table on Incremental Growth
Executive Summary - Chart on Company Market Positioning

2. Technavio Analysis

2.1 Analysis of price sensitivity, lifecycle, customer purchase basket, adoption rates, and purchase criteria

2.2 Criticality of inputs and Factors of differentiation

Chart on Overview on criticality of inputs and factors of differentiation

2.3 Factors of disruption

Chart on Overview on factors of disruption

2.4 Impact of drivers and challenges

Chart on Impact of drivers and challenges in 2025 and 2030

3. Market Landscape

3.1 Market ecosystem

Chart on Parent Market
Data Table on - Parent Market

3.2 Market characteristics

Chart on Market characteristics analysis

3.3 Value chain analysis

Chart on Value chain analysis

4. Market Sizing

4.1 Market definition

Data Table on Offerings of companies included in the market definition

4.2 Market segment analysis

Market segments

4.3 Market size 2025

4.4 Market outlook: Forecast for 2025-2030

Chart on Global - Market size and forecast 2025-2030 ($ million)
Data Table on Global - Market size and forecast 2025-2030 ($ million)
Chart on Global Market: Year-over-year growth 2025-2030 (%)
Data Table on Global Market: Year-over-year growth 2025-2030 (%)

5. Historic Market Size

5.1 Global Fine Arts Logistics Market 2020 - 2024

Historic Market Size - Data Table on Global Fine Arts Logistics Market 2020 - 2024 ($ million)

5.2 End-user segment analysis 2020 - 2024

Historic Market Size - End-user Segment 2020 - 2024 ($ million)

5.3 Type segment analysis 2020 - 2024

Historic Market Size - Type Segment 2020 - 2024 ($ million)

5.4 Product Type segment analysis 2020 - 2024

Historic Market Size - Product Type Segment 2020 - 2024 ($ million)

5.5 Geography segment analysis 2020 - 2024

Historic Market Size - Geography Segment 2020 - 2024 ($ million)

5.6 Country segment analysis 2020 - 2024

Historic Market Size - Country Segment 2020 - 2024 ($ million)

6. Qualitative Analysis

6.1 Impact of AI on the Global Fine Arts Logistics Market

6.2 Impact of geopolitical conflict on Global Fine Arts Logistics Market

7. Five Forces Analysis

7.1 Five forces summary

Five forces analysis - Comparison between 2025 and 2030

7.2 Bargaining power of buyers

Bargaining power of buyers - Impact of key factors 2025 and 2030

7.3 Bargaining power of suppliers

Bargaining power of suppliers - Impact of key factors in 2025 and 2030

7.4 Threat of new entrants

Threat of new entrants - Impact of key factors in 2025 and 2030

7.5 Threat of substitutes

Threat of substitutes - Impact of key factors in 2025 and 2030

7.6 Threat of rivalry

Threat of rivalry - Impact of key factors in 2025 and 2030

7.7 Market condition

Chart on Market condition - Five forces 2025 and 2030

8. Market Segmentation by End-user

8.1 Market segments

Chart on End-user - Market share 2025-2030 (%)
Data Table on End-user - Market share 2025-2030 (%)

8.2 Comparison by End-user

Chart on Comparison by End-user
Data Table on Comparison by End-user

8.3 Art dealers and galleries - Market size and forecast 2025-2030

Chart on Art dealers and galleries - Market size and forecast 2025-2030 ($ million)
Data Table on Art dealers and galleries - Market size and forecast 2025-2030 ($ million)
Chart on Art dealers and galleries - Year-over-year growth 2025-2030 (%)
Data Table on Art dealers and galleries - Year-over-year growth 2025-2030 (%)

8.4 Auction houses - Market size and forecast 2025-2030

Chart on Auction houses - Market size and forecast 2025-2030 ($ million)
Data Table on Auction houses - Market size and forecast 2025-2030 ($ million)
Chart on Auction houses - Year-over-year growth 2025-2030 (%)
Data Table on Auction houses - Year-over-year growth 2025-2030 (%)

8.5 Museum and art fair - Market size and forecast 2025-2030

Chart on Museum and art fair - Market size and forecast 2025-2030 ($ million)
Data Table on Museum and art fair - Market size and forecast 2025-2030 ($ million)
Chart on Museum and art fair - Year-over-year growth 2025-2030 (%)
Data Table on Museum and art fair - Year-over-year growth 2025-2030 (%)

8.6 Others - Market size and forecast 2025-2030

Chart on Others - Market size and forecast 2025-2030 ($ million)
Data Table on Others - Market size and forecast 2025-2030 ($ million)
Chart on Others - Year-over-year growth 2025-2030 (%)
Data Table on Others - Year-over-year growth 2025-2030 (%)

8.7 Market opportunity by End-user

Market opportunity by End-user ($ million)
Data Table on Market opportunity by End-user ($ million)

9. Market Segmentation by Type

9.1 Market segments

Chart on Type - Market share 2025-2030 (%)
Data Table on Type - Market share 2025-2030 (%)

9.2 Comparison by Type

Chart on Comparison by Type
Data Table on Comparison by Type

9.3 Transportation - Market size and forecast 2025-2030

Chart on Transportation - Market size and forecast 2025-2030 ($ million)
Data Table on Transportation - Market size and forecast 2025-2030 ($ million)
Chart on Transportation - Year-over-year growth 2025-2030 (%)
Data Table on Transportation - Year-over-year growth 2025-2030 (%)

9.4 Storage - Market size and forecast 2025-2030

Chart on Storage - Market size and forecast 2025-2030 ($ million)
Data Table on Storage - Market size and forecast 2025-2030 ($ million)
Chart on Storage - Year-over-year growth 2025-2030 (%)
Data Table on Storage - Year-over-year growth 2025-2030 (%)

9.5 Packaging - Market size and forecast 2025-2030

Chart on Packaging - Market size and forecast 2025-2030 ($ million)
Data Table on Packaging - Market size and forecast 2025-2030 ($ million)
Chart on Packaging - Year-over-year growth 2025-2030 (%)
Data Table on Packaging - Year-over-year growth 2025-2030 (%)

9.6 Others - Market size and forecast 2025-2030

Chart on Others - Market size and forecast 2025-2030 ($ million)
Data Table on Others - Market size and forecast 2025-2030 ($ million)
Chart on Others - Year-over-year growth 2025-2030 (%)
Data Table on Others - Year-over-year growth 2025-2030 (%)

9.7 Market opportunity by Type

Market opportunity by Type ($ million)
Data Table on Market opportunity by Type ($ million)

10. Market Segmentation by Product Type

10.1 Market segments

Chart on Product Type - Market share 2025-2030 (%)
Data Table on Product Type - Market share 2025-2030 (%)

10.2 Comparison by Product Type

Chart on Comparison by Product Type
Data Table on Comparison by Product Type

10.3 Paintings - Market size and forecast 2025-2030

Chart on Paintings - Market size and forecast 2025-2030 ($ million)
Data Table on Paintings - Market size and forecast 2025-2030 ($ million)
Chart on Paintings - Year-over-year growth 2025-2030 (%)
Data Table on Paintings - Year-over-year growth 2025-2030 (%)

10.4 Sculptures - Market size and forecast 2025-2030

Chart on Sculptures - Market size and forecast 2025-2030 ($ million)
Data Table on Sculptures - Market size and forecast 2025-2030 ($ million)
Chart on Sculptures - Year-over-year growth 2025-2030 (%)
Data Table on Sculptures - Year-over-year growth 2025-2030 (%)

10.5 Antiques - Market size and forecast 2025-2030

Chart on Antiques - Market size and forecast 2025-2030 ($ million)
Data Table on Antiques - Market size and forecast 2025-2030 ($ million)
Chart on Antiques - Year-over-year growth 2025-2030 (%)
Data Table on Antiques - Year-over-year growth 2025-2030 (%)

10.6 Photography - Market size and forecast 2025-2030

Chart on Photography - Market size and forecast 2025-2030 ($ million)
Data Table on Photography - Market size and forecast 2025-2030 ($ million)
Chart on Photography - Year-over-year growth 2025-2030 (%)
Data Table on Photography - Year-over-year growth 2025-2030 (%)

10.7 Others - Market size and forecast 2025-2030

Chart on Others - Market size and forecast 2025-2030 ($ million)
Data Table on Others - Market size and forecast 2025-2030 ($ million)
Chart on Others - Year-over-year growth 2025-2030 (%)
Data Table on Others - Year-over-year growth 2025-2030 (%)

10.8 Market opportunity by Product Type

Market opportunity by Product Type ($ million)
Data Table on Market opportunity by Product Type ($ million)

11. Customer Landscape

11.1 Customer landscape overview

Analysis of price sensitivity, lifecycle, customer purchase basket, adoption rates, and purchase criteria

12. Geographic Landscape

12.1 Geographic segmentation

Chart on Market share by geography 2025-2030 (%)
Data Table on Market share by geography 2025-2030 (%)

12.2 Geographic comparison

Chart on Geographic comparison
Data Table on Geographic comparison

12.3 North America - Market size and forecast 2025-2030

Chart on North America - Market size and forecast 2025-2030 ($ million)
Data Table on North America - Market size and forecast 2025-2030 ($ million)
Chart on North America - Year-over-year growth 2025-2030 (%)
Data Table on North America - Year-over-year growth 2025-2030 (%)
Chart on Regional Comparison - North America
Data Table on Regional Comparison - North America

12.3.1 US - Market size and forecast 2025-2030

Chart on US - Market size and forecast 2025-2030 ($ million)
Data Table on US - Market size and forecast 2025-2030 ($ million)
Chart on US - Year-over-year growth 2025-2030 (%)
Data Table on US - Year-over-year growth 2025-2030 (%)

12.3.2 Canada - Market size and forecast 2025-2030

Chart on Canada - Market size and forecast 2025-2030 ($ million)
Data Table on Canada - Market size and forecast 2025-2030 ($ million)
Chart on Canada - Year-over-year growth 2025-2030 (%)
Data Table on Canada - Year-over-year growth 2025-2030 (%)

12.3.3 Mexico - Market size and forecast 2025-2030

Chart on Mexico - Market size and forecast 2025-2030 ($ million)
Data Table on Mexico - Market size and forecast 2025-2030 ($ million)
Chart on Mexico - Year-over-year growth 2025-2030 (%)
Data Table on Mexico - Year-over-year growth 2025-2030 (%)

12.4 Europe - Market size and forecast 2025-2030

Chart on Europe - Market size and forecast 2025-2030 ($ million)
Data Table on Europe - Market size and forecast 2025-2030 ($ million)
Chart on Europe - Year-over-year growth 2025-2030 (%)
Data Table on Europe - Year-over-year growth 2025-2030 (%)
Chart on Regional Comparison - Europe
Data Table on Regional Comparison - Europe

12.4.1 UK - Market size and forecast 2025-2030

Chart on UK - Market size and forecast 2025-2030 ($ million)
Data Table on UK - Market size and forecast 2025-2030 ($ million)
Chart on UK - Year-over-year growth 2025-2030 (%)
Data Table on UK - Year-over-year growth 2025-2030 (%)

12.4.2 Germany - Market size and forecast 2025-2030

Chart on Germany - Market size and forecast 2025-2030 ($ million)
Data Table on Germany - Market size and forecast 2025-2030 ($ million)
Chart on Germany - Year-over-year growth 2025-2030 (%)
Data Table on Germany - Year-over-year growth 2025-2030 (%)

12.4.3 France - Market size and forecast 2025-2030

Chart on France - Market size and forecast 2025-2030 ($ million)
Data Table on France - Market size and forecast 2025-2030 ($ million)
Chart on France - Year-over-year growth 2025-2030 (%)
Data Table on France - Year-over-year growth 2025-2030 (%)

12.4.4 Italy - Market size and forecast 2025-2030

Chart on Italy - Market size and forecast 2025-2030 ($ million)
Data Table on Italy - Market size and forecast 2025-2030 ($ million)
Chart on Italy - Year-over-year growth 2025-2030 (%)
Data Table on Italy - Year-over-year growth 2025-2030 (%)

12.4.5 Switzerland - Market size and forecast 2025-2030

Chart on Switzerland - Market size and forecast 2025-2030 ($ million)
Data Table on Switzerland - Market size and forecast 2025-2030 ($ million)
Chart on Switzerland - Year-over-year growth 2025-2030 (%)
Data Table on Switzerland - Year-over-year growth 2025-2030 (%)

12.4.6 The Netherlands - Market size and forecast 2025-2030

Chart on The Netherlands - Market size and forecast 2025-2030 ($ million)
Data Table on The Netherlands - Market size and forecast 2025-2030 ($ million)
Chart on The Netherlands - Year-over-year growth 2025-2030 (%)
Data Table on The Netherlands - Year-over-year growth 2025-2030 (%)

12.5 APAC - Market size and forecast 2025-2030

Chart on APAC - Market size and forecast 2025-2030 ($ million)
Data Table on APAC - Market size and forecast 2025-2030 ($ million)
Chart on APAC - Year-over-year growth 2025-2030 (%)
Data Table on APAC - Year-over-year growth 2025-2030 (%)
Chart on Regional Comparison - APAC
Data Table on Regional Comparison - APAC

12.5.1 China - Market size and forecast 2025-2030

Chart on China - Market size and forecast 2025-2030 ($ million)
Data Table on China - Market size and forecast 2025-2030 ($ million)
Chart on China - Year-over-year growth 2025-2030 (%)
Data Table on China - Year-over-year growth 2025-2030 (%)

12.5.2 Japan - Market size and forecast 2025-2030

Chart on Japan - Market size and forecast 2025-2030 ($ million)
Data Table on Japan - Market size and forecast 2025-2030 ($ million)
Chart on Japan - Year-over-year growth 2025-2030 (%)
Data Table on Japan - Year-over-year growth 2025-2030 (%)

12.5.3 India - Market size and forecast 2025-2030

Chart on India - Market size and forecast 2025-2030 ($ million)
Data Table on India - Market size and forecast 2025-2030 ($ million)
Chart on India - Year-over-year growth 2025-2030 (%)
Data Table on India - Year-over-year growth 2025-2030 (%)

12.5.4 South Korea - Market size and forecast 2025-2030

Chart on South Korea - Market size and forecast 2025-2030 ($ million)
Data Table on South Korea - Market size and forecast 2025-2030 ($ million)
Chart on South Korea - Year-over-year growth 2025-2030 (%)
Data Table on South Korea - Year-over-year growth 2025-2030 (%)

12.5.5 Singapore - Market size and forecast 2025-2030

Chart on Singapore - Market size and forecast 2025-2030 ($ million)
Data Table on Singapore - Market size and forecast 2025-2030 ($ million)
Chart on Singapore - Year-over-year growth 2025-2030 (%)
Data Table on Singapore - Year-over-year growth 2025-2030 (%)

12.5.6 Australia - Market size and forecast 2025-2030

Chart on Australia - Market size and forecast 2025-2030 ($ million)
Data Table on Australia - Market size and forecast 2025-2030 ($ million)
Chart on Australia - Year-over-year growth 2025-2030 (%)
Data Table on Australia - Year-over-year growth 2025-2030 (%)

12.6 South America - Market size and forecast 2025-2030

Chart on South America - Market size and forecast 2025-2030 ($ million)
Data Table on South America - Market size and forecast 2025-2030 ($ million)
Chart on South America - Year-over-year growth 2025-2030 (%)
Data Table on South America - Year-over-year growth 2025-2030 (%)
Chart on Regional Comparison - South America
Data Table on Regional Comparison - South America

12.6.1 Brazil - Market size and forecast 2025-2030

Chart on Brazil - Market size and forecast 2025-2030 ($ million)
Data Table on Brazil - Market size and forecast 2025-2030 ($ million)
Chart on Brazil - Year-over-year growth 2025-2030 (%)
Data Table on Brazil - Year-over-year growth 2025-2030 (%)

12.6.2 Argentina - Market size and forecast 2025-2030

Chart on Argentina - Market size and forecast 2025-2030 ($ million)
Data Table on Argentina - Market size and forecast 2025-2030 ($ million)
Chart on Argentina - Year-over-year growth 2025-2030 (%)
Data Table on Argentina - Year-over-year growth 2025-2030 (%)

12.6.3 Chile - Market size and forecast 2025-2030

Chart on Chile - Market size and forecast 2025-2030 ($ million)
Data Table on Chile - Market size and forecast 2025-2030 ($ million)
Chart on Chile - Year-over-year growth 2025-2030 (%)
Data Table on Chile - Year-over-year growth 2025-2030 (%)

12.7 Middle East and Africa - Market size and forecast 2025-2030

Chart on Middle East and Africa - Market size and forecast 2025-2030 ($ million)
Data Table on Middle East and Africa - Market size and forecast 2025-2030 ($ million)
Chart on Middle East and Africa - Year-over-year growth 2025-2030 (%)
Data Table on Middle East and Africa - Year-over-year growth 2025-2030 (%)
Chart on Regional Comparison - Middle East and Africa
Data Table on Regional Comparison - Middle East and Africa

12.7.1 UAE - Market size and forecast 2025-2030

Chart on UAE - Market size and forecast 2025-2030 ($ million)
Data Table on UAE - Market size and forecast 2025-2030 ($ million)
Chart on UAE - Year-over-year growth 2025-2030 (%)
Data Table on UAE - Year-over-year growth 2025-2030 (%)

12.7.2 Saudi Arabia - Market size and forecast 2025-2030

Chart on Saudi Arabia - Market size and forecast 2025-2030 ($ million)
Data Table on Saudi Arabia - Market size and forecast 2025-2030 ($ million)
Chart on Saudi Arabia - Year-over-year growth 2025-2030 (%)
Data Table on Saudi Arabia - Year-over-year growth 2025-2030 (%)

12.7.3 South Africa - Market size and forecast 2025-2030

Chart on South Africa - Market size and forecast 2025-2030 ($ million)
Data Table on South Africa - Market size and forecast 2025-2030 ($ million)
Chart on South Africa - Year-over-year growth 2025-2030 (%)
Data Table on South Africa - Year-over-year growth 2025-2030 (%)

12.7.4 Israel - Market size and forecast 2025-2030

Chart on Israel - Market size and forecast 2025-2030 ($ million)
Data Table on Israel - Market size and forecast 2025-2030 ($ million)
Chart on Israel - Year-over-year growth 2025-2030 (%)
Data Table on Israel - Year-over-year growth 2025-2030 (%)

12.7.5 Qatar - Market size and forecast 2025-2030

Chart on Qatar - Market size and forecast 2025-2030 ($ million)
Data Table on Qatar - Market size and forecast 2025-2030 ($ million)
Chart on Qatar - Year-over-year growth 2025-2030 (%)
Data Table on Qatar - Year-over-year growth 2025-2030 (%)

12.8 Market opportunity by geography

Market opportunity by geography ($ million)
Data Tables on Market opportunity by geography ($ million)

13. Drivers, Challenges, and Opportunity

13.1 Market drivers

Implementation of complex trade policies and surging demand for integrated customs brokerage
Resurgence of high-density cultural exhibitions and shift toward ethical stewardship
Rapid expansion of institutional art hubs and time-critical exhibition logistics

13.2 Market challenges

Stringent customs regulations and complex cross-border compliance
Environmental vulnerabilities and demand for sustainable operations
Escalating infrastructure costs and real estate scarcity for climate-controlled storage

13.3 Impact of drivers and challenges

Impact of drivers and challenges in 2025 and 2030

13.4 Market opportunities

Advanced digitalization and IoT tracking
Decarbonization and sustainable art handling practices
Proliferation of elite airport-adjacent freeports

14. Competitive Landscape

14.1 Overview

14.2

Overview on criticality of inputs and factors of differentiation

14.3 Landscape disruption

Overview on factors of disruption

14.4 Industry risks

Impact of key risks on business

15. Competitive Analysis

15.1 Companies profiled

Companies covered

15.2 Company ranking index

15.3 Market positioning of companies

Matrix on companies position and classification

15.4 Artex Art Services s.r.o.

Artex Art Services s.r.o. - Overview
Artex Art Services s.r.o. - Product / Service
Artex Art Services s.r.o. - Key offerings
SWOT

15.5 Bovis Group

Bovis Group - Overview
Bovis Group - Product / Service
Bovis Group - Key offerings
SWOT

15.6 Cadogan Tate Group Ltd

Cadogan Tate Group Ltd - Overview
Cadogan Tate Group Ltd - Product / Service
Cadogan Tate Group Ltd - Key offerings
SWOT

15.7 Constantine Ltd

Constantine Ltd - Overview
Constantine Ltd - Product / Service
Constantine Ltd - Key offerings
SWOT

15.8 CONVELIO SAS

CONVELIO SAS - Overview
CONVELIO SAS - Product / Service
CONVELIO SAS - Key offerings
SWOT

15.9 Crozier Fine Arts Inc.

Crozier Fine Arts Inc. - Overview
Crozier Fine Arts Inc. - Product / Service
Crozier Fine Arts Inc. - Key offerings
SWOT

15.10 Dietl International Services Inc.

Dietl International Services Inc. - Overview
Dietl International Services Inc. - Product / Service
Dietl International Services Inc. - Key offerings
SWOT

15.11 DSV AS

DSV AS - Overview
DSV AS - Business segments
DSV AS - Key offerings
DSV AS - Segment focus
SWOT

15.12 Gander and White Shipping Ltd

Gander and White Shipping Ltd - Overview
Gander and White Shipping Ltd - Product / Service
Gander and White Shipping Ltd - Key offerings
SWOT

15.13 hasenkamp Holding GmbH

hasenkamp Holding GmbH - Overview
hasenkamp Holding GmbH - Product / Service
hasenkamp Holding GmbH - Key offerings
SWOT

15.14 Masterpiece International Ltd

Masterpiece International Ltd - Overview
Masterpiece International Ltd - Product / Service
Masterpiece International Ltd - Key offerings
SWOT

15.15 Poul Schou AS

Poul Schou AS - Overview
Poul Schou AS - Product / Service
Poul Schou AS - Key offerings
SWOT

15.16 Rock it Cargo USA LLC

Rock it Cargo USA LLC - Overview
Rock it Cargo USA LLC - Product / Service
Rock it Cargo USA LLC - Key offerings
SWOT

15.17 uShip Inc.

uShip Inc. - Overview
uShip Inc. - Product / Service
uShip Inc. - Key offerings
SWOT

15.18 Yamato Transport Co. Ltd.

Yamato Transport Co. Ltd. - Overview
Yamato Transport Co. Ltd. - Product / Service
Yamato Transport Co. Ltd. - Key offerings
SWOT

16. Appendix

16.1 Scope of the report

Market definition
Objectives
Notes and caveats

16.2 Inclusions and exclusions checklist

Inclusions checklist
Exclusions checklist

16.3 Currency conversion rates for US$

16.4 Research methodology

16.5 Data procurement

Information sources

16.6 Data validation

16.7 Validation techniques employed for market sizing

16.8 Data synthesis

16.9 360 degree market analysis

16.10 List of abbreviations

Research Methodology

Technavio presents a detailed picture of the market by way of study, synthesis, and summation of data from multiple sources. The analysts have presented the various facets of the market with a particular focus on identifying the key industry influencers. The data thus presented is comprehensive, reliable, and the result of extensive research, both primary and secondary.

INFORMATION SOURCES

Primary sources

  • Manufacturers and suppliers
  • Channel partners
  • Industry experts
  • Strategic decision makers

Secondary sources

  • Industry journals and periodicals
  • Government data
  • Financial reports of key industry players
  • Historical data
  • Press releases

DATA ANALYSIS

Data Synthesis

  • Collation of data
  • Estimation of key figures
  • Analysis of derived insights

Data Validation

  • Triangulation with data models
  • Reference against proprietary databases
  • Corroboration with industry experts

REPORT WRITING

Qualitative

  • Market drivers
  • Market challenges
  • Market trends
  • Five forces analysis

Quantitative

  • Market size and forecast
  • Market segmentation
  • Geographical insights
  • Competitive landscape

Interested in this report?

Get your sample now to see our research methodology and insights!

Download Now

Frequently Asked Questions

Fine Arts Logistics market growth will increase by USD 970.8 million during 2026-2030.

The Fine Arts Logistics market is expected to grow at a CAGR of 4.4% during 2026-2030.

Fine Arts Logistics market is segmented by End-user (Art dealers and galleries, Auction houses, Museum and art fair, Others) Type (Transportation, Storage, Packaging, Others) Product type (Paintings, Sculptures, Antiques, Photography, Others)

Artex Art Services s.r.o., Atelier 4 Inc., Bovis Group, Cadogan Tate Group Ltd, Constantine Ltd, CONVELIO SAS, Crozier Fine Arts Inc., Dietl International Services Inc., DSV AS, Gander and White Shipping Ltd, hasenkamp Holding GmbH, KunstTrans Holding GmbH, Masterpiece International Ltd, Momart Ltd, Mtec Fine Art Ltd., Poul Schou AS, Rock it Cargo USA LLC, uShip Inc., Yamato Transport Co. Ltd. are a few of the key vendors in the Fine Arts Logistics market.

North America will register the highest growth rate of 44.2% among the other regions. Therefore, the Fine Arts Logistics market in North America is expected to garner significant business opportunities for the vendors during the forecast period.

US, Canada, Mexico, UK, Germany, France, Italy, Switzerland, The Netherlands, China, Japan, India, South Korea, Singapore, Australia, Brazil, Argentina, Chile, UAE, Saudi Arabia, South Africa, Israel, Qatar

  • Implementation of complex trade policies and surging demand for integrated customs brokerage is the driving factor this market.

The Fine Arts Logistics market vendors should focus on grabbing business opportunities from the End-user segment as it accounted for the largest market share in the base year.
RIA - Research AI Assistant
Ask RIA