Fish Sauce Market Analysis, Size, and Forecast 2026-2030: APAC (China, Japan, and India), Europe (UK, Germany, and France), North America (US, Canada, and Mexico), Middle East and Africa (Saudi Arabia, UAE, and South Africa), South America (Brazil and Argentina), and Rest of World (ROW)

Fish Sauce Market Analysis, Size, and Forecast 2026-2030:
APAC (China, Japan, and India), Europe (UK, Germany, and France), North America (US, Canada, and Mexico), Middle East and Africa (Saudi Arabia, UAE, and South Africa), South America (Brazil and Argentina), and Rest of World (ROW)

Published: Apr 2026 326 Pages SKU: IRTNTR72569

Market Overview at a Glance

$1.38 B
Market Opportunity
7.5%
CAGR 2025 - 2030
83.4%
APAC Growth
$2.25 B
Industrial fish sauce segment 2024

Fish Sauce Market Size 2026-2030

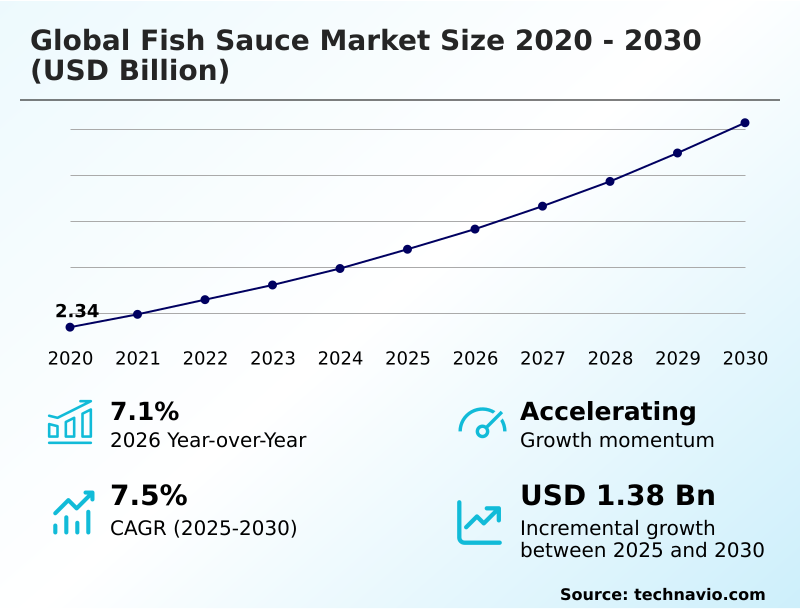
The fish sauce market size is valued to increase by USD 1.38 billion, at a CAGR of 7.5% from 2025 to 2030. Increasing global popularity of southeast Asian culinary traditions will drive the fish sauce market.

Major Market Trends & Insights

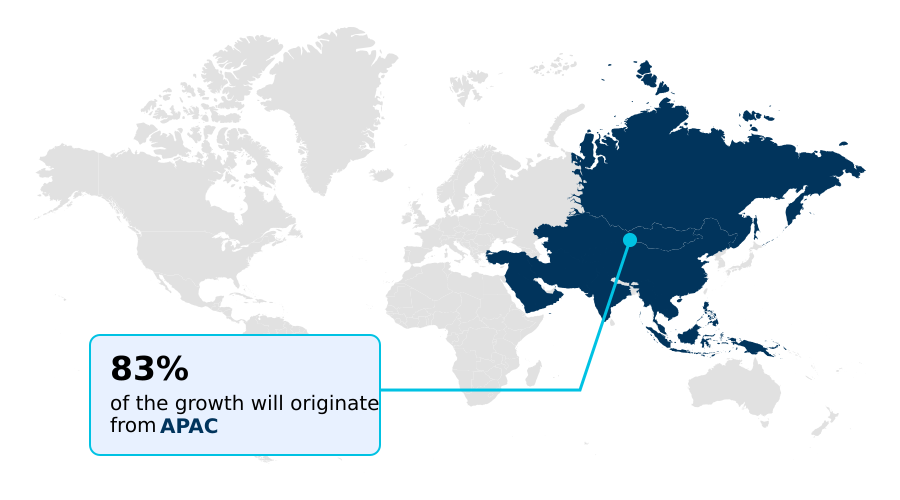
  • APAC dominated the market and accounted for a 83.4% growth during the forecast period.
  • By Product - Industrial fish sauce segment was valued at USD 2.25 billion in 2024
  • By Distribution Channel - Offline segment accounted for the largest market revenue share in 2024

Market Size & Forecast

  • Market Opportunities: USD 2.23 billion
  • Market Future Opportunities: USD 1.38 billion
  • CAGR from 2025 to 2030 : 7.5%

Market Summary

  • The fish sauce market is undergoing a significant transformation, driven by a confluence of culinary globalization and heightened consumer consciousness. The core of the market revolves around two production philosophies: traditional fermentation methods, which emphasize natural protein breakdown and a complex amino acid profile, and industrial-scale enzymatic hydrolysis, designed for consistency and volume.
  • A primary driver is the rising demand from Western markets for authentic flavor replication in home cooking, moving the condiment from niche to mainstream. This trend is coupled with the clean label movement, pushing for minimal, natural ingredients and salt content reduction. However, producers face considerable challenges.
  • For instance, a food manufacturer aiming to launch a new line of clean-label frozen meals must navigate complex import-export regulations and secure a supply chain that guarantees sustainable sourcing certification and digital traceability systems. This scenario highlights the operational tension between scaling production and meeting stringent quality control metrics, supply chain transparency, and evolving food safety standards.
  • The industry's future hinges on balancing artisanal heritage with technological innovation to meet diverse consumer expectations for both premium product positioning and affordability.

What will be the Size of the Fish Sauce Market during the forecast period?

Get Key Insights on Market Forecast (PDF) Request Free Sample

How is the Fish Sauce Market Segmented?

The fish sauce industry research report provides comprehensive data (region-wise segment analysis), with forecasts and estimates in "USD million" for the period 2026-2030, as well as historical data from 2020-2024 for the following segments.

  • Product
    • Industrial fish sauce
    • Traditional fish sauce
  • Distribution channel
    • Offline
    • Online
  • Product type
    • Mass
    • Premium
  • End-user
    • Food manufacturers
    • Retail and food service
  • Type
    • Anchovy
    • Mackerel
    • Squid
    • Shrimp
    • Others
  • Geography
    • APAC
      • China
      • Japan
      • India
    • Europe
      • UK
      • Germany
      • France
    • North America
      • US
      • Canada
      • Mexico
    • Middle East and Africa
      • Saudi Arabia
      • UAE
      • South Africa
    • South America
      • Brazil
      • Argentina
    • Rest of World (ROW)

By Product Insights

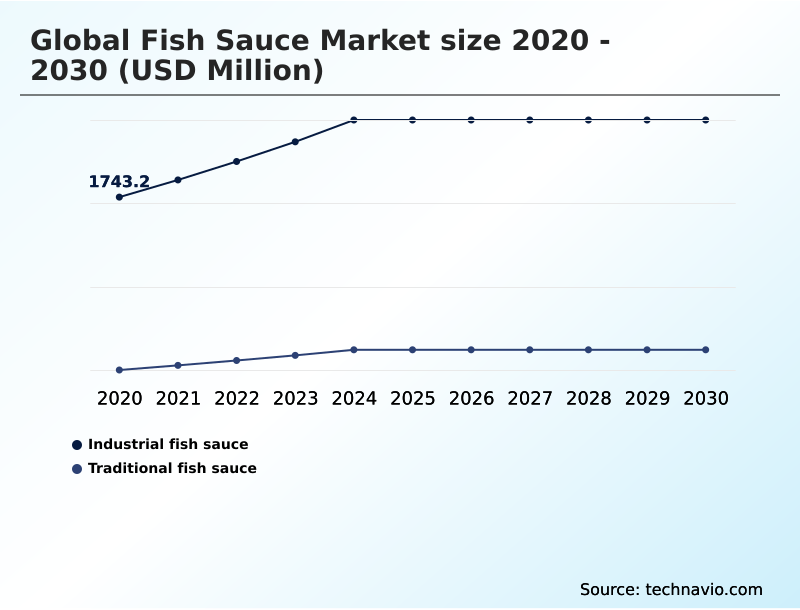
The industrial fish sauce segment is estimated to witness significant growth during the forecast period.

The industrial fish sauce segment is defined by mass production, leveraging accelerated fermentation and enzymatic processes to ensure product consistency for global food manufacturers.

This approach, centered on liquid seasoning production and flavor enhancement, allows for scalability in the food service and retail distribution sectors. Industrial formulations often serve as a cost-effective food processing aid, meeting high-volume demands for ready-to-eat meals.

Adherence to food safety standards and the use of natural preservatives are critical, as producers balance efficiency with consumer health awareness.

Investments in automation have improved quality control metrics, with some facilities reporting a 15% increase in batch-to-batch flavor profile consistency, a key factor for the gourmet food sector and direct-to-consumer sales.

Request Free Sample

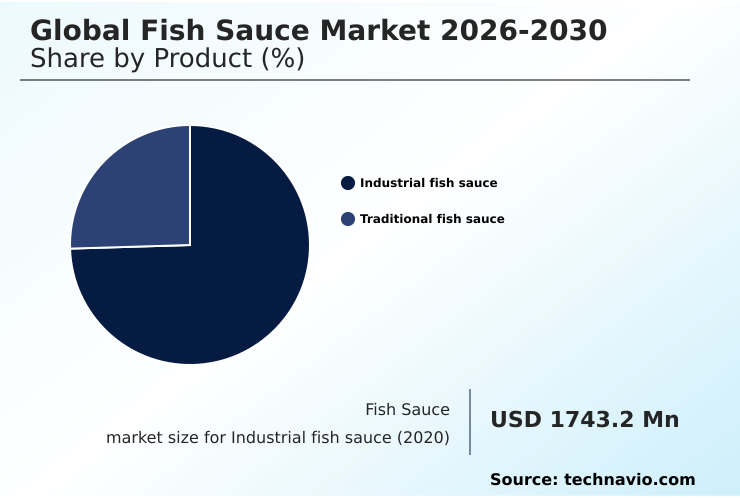
The Industrial fish sauce segment was valued at USD 2.25 billion in 2024 and showed a gradual increase during the forecast period.

Request Free Sample

Regional Analysis

APAC is estimated to contribute 83.4% to the growth of the global market during the forecast period.Technavio’s analysts have elaborately explained the regional trends and drivers that shape the market during the forecast period.

See How Fish Sauce Market Demand is Rising in APAC Request Free Sample

The geographic landscape of the fish sauce market is predominantly anchored in the APAC region, which maintains the largest market share due to deep-rooted culinary traditions and high production volumes.

However, the fastest growth is observed in South America and Europe, with growth rates of 8.2% and 7.8% respectively, outpacing North America's 6.6%.

This expansion is driven by the global adoption of Southeast Asian cuisine and the rising demand for authentic condiments. European markets, in particular, show a strong preference for premium, artisanal products with verifiable supply chain transparency and clean label ingredients.

In North America, the focus is on integrating fish sauce into mainstream food service applications and retail.

This regional diversification requires producers to adapt, as firms targeting the European Union have seen a 25% higher compliance cost related to stringent import-export regulations compared to other regions, impacting overall production strategy.

Market Dynamics

Our researchers analyzed the data with 2025 as the base year, along with the key drivers, trends, and challenges. A holistic analysis of drivers will help companies refine their marketing strategies to gain a competitive advantage.

  • The global fish sauce market 2026-2030 is evolving through focused innovation and adherence to stringent quality standards. Understanding the best practices for traditional fish sauce fermentation is now a competitive differentiator, as producers aim to deliver authentic umami-rich fish sauce for food service and retail.
  • The impact of anchovy quality on fish sauce flavor remains a critical research area, directly influencing the final product's complexity. Concurrently, there is a significant push toward developing technology for reducing sodium in fish sauce, positioning it as a fish sauce as a natural msg replacement.
  • This aligns with the demand for fish sauce in clean label food manufacturing, where transparency is key. The sustainable sourcing impact on fish sauce market is reshaping supply chains, with an emphasis on regulatory compliance for fish sauce exports.
  • From a technical standpoint, challenges in industrial fish sauce production are being met with advanced methods for fish sauce flavor profile analysis. This addresses the traditional vs industrial fish sauce production debate by enhancing quality.
  • As a result, companies adopting advanced fish sauce shelf life extension techniques and quality metrics for premium fish sauce evaluation report up to a 15% lower rate of product spoilage compared to those using conventional methods. This shift allows for the development of high protein fish sauce for nutritional products and broader use in fish sauce in western culinary applications.

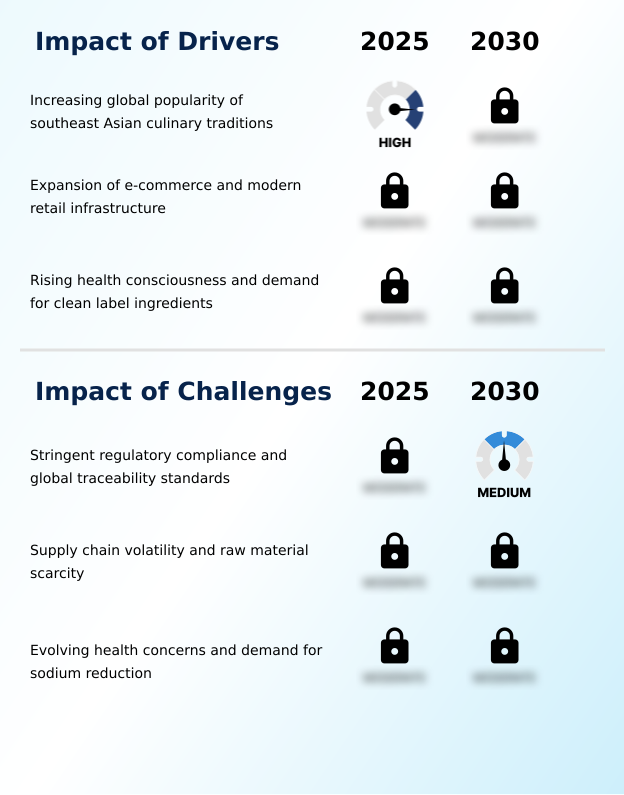
What are the key market drivers leading to the rise in the adoption of Fish Sauce Industry?

  • The increasing global popularity of Southeast Asian culinary traditions is a primary driver for the market's expansion.

  • The primary driver of market expansion is the mainstream adoption of Southeast Asian flavors in Western culinary scenes, which has led to a 30% increase in demand from the food service sector over the last two years.
  • This cultural shift necessitates scalable liquid seasoning production, pushing innovation in accelerated fermentation and enzymatic hydrolysis to maintain a consistent amino acid profile.
  • Furthermore, the growing consumer health awareness has fueled demand for natural umami concentration, positioning fish sauce as a clean-label alternative to synthetic flavor enhancers. This trend has been particularly beneficial for producers emphasizing traditional fermentation methods.
  • E-commerce platforms have also played a crucial role, expanding market access by 40% for artisanal producers who previously faced retail distribution barriers, allowing them to capitalize on the demand for authentic flavor replication.

What are the market trends shaping the Fish Sauce Industry?

  • The rise of digital traceability and sustainable sourcing is a significant trend, compelling manufacturers to provide verifiable proof of responsible practices from catch to final product.

  • Market trends are increasingly shaped by the push for premiumization and supply chain transparency. The adoption of digital traceability systems is becoming a key differentiator, with companies leveraging this technology reporting a 20% higher success rate in securing contracts with major retailers in North America and Europe. This move toward verifiable sustainable fishing practices is resonating with consumers.
  • Simultaneously, the focus on clean label ingredients and artisanal production techniques is driving demand for products that utilize a traditional barrel aging process and single-origin anchovies. This has resulted in a 15% average price premium for brands that can effectively communicate their commitment to natural protein breakdown and high-protein content without artificial additives.
  • The market is bifurcating, with distinct opportunities in both mass-market and high-end segments.

What challenges does the Fish Sauce Industry face during its growth?

  • Stringent regulatory compliance and the lack of unified global traceability standards present a key challenge affecting industry growth.

  • Significant challenges in the market stem from regulatory and operational complexities. Adhering to varied international food safety standards and import-export regulations adds an estimated 15% to operational costs for exporters. The mandate for salt content reduction presents a technical hurdle, as salt is crucial for traditional fermentation control.
  • Innovations in this area that maintain shelf stability are still in early stages. Furthermore, raw material sourcing is subject to volatility from climate change, impacting anchovy fermentation yields and costs. Producers have reported price fluctuations of up to 25% for raw materials in a single season.
  • Ensuring supply chain transparency through effective sensory panel testing and managing volatile compound analysis across batches remains a persistent operational challenge, particularly for smaller-scale producers trying to compete with industrial giants.

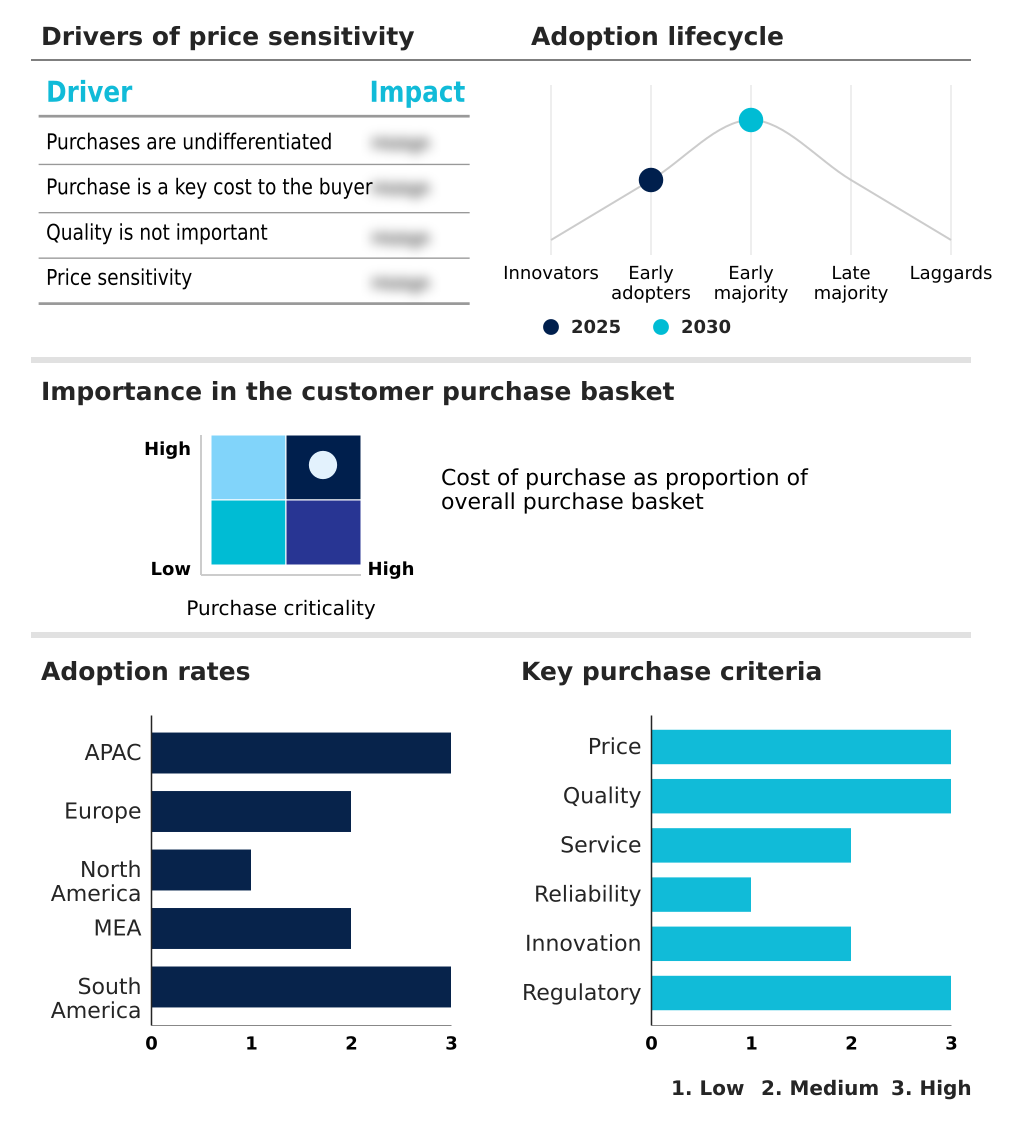
Exclusive Technavio Analysis on Customer Landscape

The fish sauce market forecasting report includes the adoption lifecycle of the market, covering from the innovator’s stage to the laggard’s stage. It focuses on adoption rates in different regions based on penetration. Furthermore, the fish sauce market report also includes key purchase criteria and drivers of price sensitivity to help companies evaluate and develop their market growth analysis strategies.

Customer Landscape of Fish Sauce Industry

Competitive Landscape

Companies are implementing various strategies, such as strategic alliances, fish sauce market forecast, partnerships, mergers and acquisitions, geographical expansion, and product/service launches, to enhance their presence in the industry.

Blue Elephant International - Key offerings include premium Thai ingredients and sauces, featuring a range of curry pastes, cooking sets, and seasoning sauces designed for authentic culinary experiences.

The industry research and growth report includes detailed analyses of the competitive landscape of the market and information about key companies, including:

  • Blue Elephant International
  • California Fish Sauce
  • Fish Sauce Thai Co. Ltd.
  • Halcyon Proteins Pty. Ltd.
  • Hung Thanh Co., Ltd.
  • Kimlan Foods Co. Ltd.
  • Knorr
  • Mae Sri Pty Ltd.
  • Masan Group
  • Mega Chef Co. Ltd.
  • Nestle SA
  • Pantainorasingh Manufacturer
  • Phu Nhi Fish Sauce
  • Pichai Fish Sauce Co. Ltd.
  • Rayong Fish Sauce Industry Co. Ltd.
  • Roland Foods LLC
  • Rungroj Fish Sauce Co. Ltd.
  • Thai Fishsauce Factory Co. Ltd.
  • Real Thai Co. Ltd.
  • Viet Phu Inc.

Qualitative and quantitative analysis of companies has been conducted to help clients understand the wider business environment as well as the strengths and weaknesses of key industry players. Data is qualitatively analyzed to categorize companies as pure play, category-focused, industry-focused, and diversified; it is quantitatively analyzed to categorize companies as dominant, leading, strong, tentative, and weak.

Recent Development and News in Fish sauce market

  • In May 2025, Squid Brand launched Volcano Fish Sauce at Thaifex-Anuga Asia 2025, a strategic move targeting premium, high-intensity flavor markets for global export.
  • In August 2025, Phichai Fish Sauce introduced a powdered fish sauce, offering a low-sodium, high-protein alternative for convenient use in processed food applications.
  • In June 2025, Marine Resources Development, a Thai company, invested in automated fermentation processes to improve production efficiency and the consistency of its fish sauce output.
  • In March 2025, Phu Quoc Fish Sauce Manufacturer Hung Thanh was recognized for enhancing its certified production capabilities, including HACCP and quality standard compliance, to support export expansion.

Dive into Technavio’s robust research methodology, blending expert interviews, extensive data synthesis, and validated models for unparalleled Fish Sauce Market insights. See full methodology.

Market Scope
Page number 326
Base year 2025
Historic period 2020-2024
Forecast period 2026-2030
Growth momentum & CAGR Accelerate at a CAGR of 7.5%
Market growth 2026-2030 USD 1384.1 million
Market structure Fragmented
YoY growth 2025-2026(%) 7.1%
Key countries China, Thailand, Vietnam, Japan, India, Indonesia, UK, Germany, France, Italy, Spain, The Netherlands, US, Canada, Mexico, Saudi Arabia, UAE, South Africa, Turkey, Egypt, Brazil, Argentina and Chile
Competitive landscape Leading Companies, Market Positioning of Companies, Competitive Strategies, and Industry Risks

Request Free Sample

Research Analyst Overview

  • The fish sauce market is characterized by a fundamental tension between heritage and modernization. At its core, the industry's trajectory is shaped by the mastery of fermentation control, enzymatic hydrolysis, and protein breakdown to achieve a desirable amino acid profile and umami concentration.
  • While traditional fermentation methods and barrel aging processes deliver complexity, the sector is increasingly adopting accelerated fermentation and other enzymatic processes to meet volume demands. A key boardroom focus is navigating the dual pressures of consumer demand for salt content reduction and the technical necessity of salt as a natural preservative.
  • This challenge requires significant investment in analyzing volatile compounds to maintain sensory profiles. For instance, companies that have integrated advanced digital traceability systems for raw material sourcing have demonstrated a 25% improvement in securing sustainable fishing practices certification, a critical factor for entry into premium international markets.
  • Success depends on balancing the appeal of single-origin anchovies and clean label ingredients with the economic realities of liquid seasoning production, all while adhering to rigorous food safety standards and quality control metrics to deliver high-protein content with supply chain transparency.

What are the Key Data Covered in this Fish Sauce Market Research and Growth Report?

  • What is the expected growth of the Fish Sauce Market between 2026 and 2030?

    • USD 1.38 billion, at a CAGR of 7.5%

  • What segmentation does the market report cover?

    • The report is segmented by Product (Industrial fish sauce, and Traditional fish sauce), Distribution Channel (Offline, and Online), Product Type (Mass, and Premium), End-user (Food manufacturers, and Retail and food service), Type (Anchovy, Mackerel, Squid, Shrimp, and Others) and Geography (APAC, Europe, North America, Middle East and Africa, South America)

  • Which regions are analyzed in the report?

    • APAC, Europe, North America, Middle East and Africa and South America

  • What are the key growth drivers and market challenges?

    • Increasing global popularity of southeast Asian culinary traditions, Stringent regulatory compliance and global traceability standards

  • Who are the major players in the Fish Sauce Market?

    • Blue Elephant International, California Fish Sauce, Fish Sauce Thai Co. Ltd., Halcyon Proteins Pty. Ltd., Hung Thanh Co., Ltd., Kimlan Foods Co. Ltd., Knorr, Mae Sri Pty Ltd., Masan Group, Mega Chef Co. Ltd., Nestle SA, Pantainorasingh Manufacturer, Phu Nhi Fish Sauce, Pichai Fish Sauce Co. Ltd., Rayong Fish Sauce Industry Co. Ltd., Roland Foods LLC, Rungroj Fish Sauce Co. Ltd., Thai Fishsauce Factory Co. Ltd., Real Thai Co. Ltd. and Viet Phu Inc.

Market Research Insights

  • The market's dynamism is underscored by a strategic shift towards premium product positioning, driven by consumer health awareness and demand for authentic flavor replication. Artisanal production techniques and unique condiment production are gaining traction, with a focus on flavor complexity development and umami taste perception.
  • This has led to improved supply chain logistics for the gourmet food sector, facilitating direct-to-consumer sales. Food service applications are expanding, demanding high-heat stability and allergen-free formulation. This evolution in the ethnic food market is supported by food-grade packaging and sustainable sourcing certification.
  • Companies leveraging these trends have reported a 15% increase in shelf stability for premium lines and a 20% improvement in supply chain efficiency. Furthermore, enhanced retail distribution strategies have helped brands achieve a 10% greater market penetration in new regions, solidifying the role of fish sauce as a versatile savory seasoning and culinary ingredient beyond its traditional uses.
  • The focus on nutritional profile and food processing aid capabilities continues to shape innovation.

We can help! Our analysts can customize this fish sauce market research report to meet your requirements.

Get in touch

1. Executive Summary

1.1 Market overview

Executive Summary - Chart on Market Overview
Executive Summary - Data Table on Market Overview
Executive Summary - Chart on Global Market Characteristics
Executive Summary - Chart on Market by Geography
Executive Summary - Chart on Market Segmentation by Product
Executive Summary - Chart on Market Segmentation by Distribution Channel
Executive Summary - Chart on Market Segmentation by Product Type
Executive Summary - Chart on Market Segmentation by End-user
Executive Summary - Chart on Market Segmentation by Type
Executive Summary - Chart on Incremental Growth
Executive Summary - Data Table on Incremental Growth
Executive Summary - Chart on Company Market Positioning

2. Technavio Analysis

2.1 Analysis of price sensitivity, lifecycle, customer purchase basket, adoption rates, and purchase criteria

2.2 Criticality of inputs and Factors of differentiation

Chart on Overview on criticality of inputs and factors of differentiation

2.3 Factors of disruption

Chart on Overview on factors of disruption

2.4 Impact of drivers and challenges

Chart on Impact of drivers and challenges in 2025 and 2030

3. Market Landscape

3.1 Market ecosystem

Chart on Parent Market
Data Table on - Parent Market

3.2 Market characteristics

Chart on Market characteristics analysis

3.3 Value chain analysis

Chart on Value chain analysis

4. Market Sizing

4.1 Market definition

Data Table on Offerings of companies included in the market definition

4.2 Market segment analysis

Market segments

4.3 Market size 2025

4.4 Market outlook: Forecast for 2025-2030

Chart on Global - Market size and forecast 2025-2030 ($ million)
Data Table on Global - Market size and forecast 2025-2030 ($ million)
Chart on Global Market: Year-over-year growth 2025-2030 (%)
Data Table on Global Market: Year-over-year growth 2025-2030 (%)

5. Historic Market Size

5.1 Global Fish Sauce Market 2020 - 2024

Historic Market Size - Data Table on Global Fish Sauce Market 2020 - 2024 ($ million)

5.2 Product segment analysis 2020 - 2024

Historic Market Size - Product Segment 2020 - 2024 ($ million)

5.3 Distribution Channel segment analysis 2020 - 2024

Historic Market Size - Distribution Channel Segment 2020 - 2024 ($ million)

5.4 Product Type segment analysis 2020 - 2024

Historic Market Size - Product Type Segment 2020 - 2024 ($ million)

5.5 End-user segment analysis 2020 - 2024

Historic Market Size - End-user Segment 2020 - 2024 ($ million)

5.6 Type segment analysis 2020 - 2024

Historic Market Size - Type Segment 2020 - 2024 ($ million)

5.7 Geography segment analysis 2020 - 2024

Historic Market Size - Geography Segment 2020 - 2024 ($ million)

5.8 Country segment analysis 2020 - 2024

Historic Market Size - Country Segment 2020 - 2024 ($ million)

6. Qualitative Analysis

6.1 Impact of AI on global fish sauce market

6.2 Impact of geopolitical conflicts on global fish sauce market

7. Five Forces Analysis

7.1 Five forces summary

Five forces analysis - Comparison between 2025 and 2030

7.2 Bargaining power of buyers

Bargaining power of buyers - Impact of key factors 2025 and 2030

7.3 Bargaining power of suppliers

Bargaining power of suppliers - Impact of key factors in 2025 and 2030

7.4 Threat of new entrants

Threat of new entrants - Impact of key factors in 2025 and 2030

7.5 Threat of substitutes

Threat of substitutes - Impact of key factors in 2025 and 2030

7.6 Threat of rivalry

Threat of rivalry - Impact of key factors in 2025 and 2030

7.7 Market condition

Chart on Market condition - Five forces 2025 and 2030

8. Market Segmentation by Product

8.1 Market segments

Chart on Product - Market share 2025-2030 (%)
Data Table on Product - Market share 2025-2030 (%)

8.2 Comparison by Product

Chart on Comparison by Product
Data Table on Comparison by Product

8.3 Industrial fish sauce - Market size and forecast 2025-2030

Chart on Industrial fish sauce - Market size and forecast 2025-2030 ($ million)
Data Table on Industrial fish sauce - Market size and forecast 2025-2030 ($ million)
Chart on Industrial fish sauce - Year-over-year growth 2025-2030 (%)
Data Table on Industrial fish sauce - Year-over-year growth 2025-2030 (%)

8.4 Traditional fish sauce - Market size and forecast 2025-2030

Chart on Traditional fish sauce - Market size and forecast 2025-2030 ($ million)
Data Table on Traditional fish sauce - Market size and forecast 2025-2030 ($ million)
Chart on Traditional fish sauce - Year-over-year growth 2025-2030 (%)
Data Table on Traditional fish sauce - Year-over-year growth 2025-2030 (%)

8.5 Market opportunity by Product

Market opportunity by Product ($ million)
Data Table on Market opportunity by Product ($ million)

9. Market Segmentation by Distribution Channel

9.1 Market segments

Chart on Distribution Channel - Market share 2025-2030 (%)
Data Table on Distribution Channel - Market share 2025-2030 (%)

9.2 Comparison by Distribution Channel

Chart on Comparison by Distribution Channel
Data Table on Comparison by Distribution Channel

9.3 Offline - Market size and forecast 2025-2030

Chart on Offline - Market size and forecast 2025-2030 ($ million)
Data Table on Offline - Market size and forecast 2025-2030 ($ million)
Chart on Offline - Year-over-year growth 2025-2030 (%)
Data Table on Offline - Year-over-year growth 2025-2030 (%)

9.4 Online - Market size and forecast 2025-2030

Chart on Online - Market size and forecast 2025-2030 ($ million)
Data Table on Online - Market size and forecast 2025-2030 ($ million)
Chart on Online - Year-over-year growth 2025-2030 (%)
Data Table on Online - Year-over-year growth 2025-2030 (%)

9.5 Market opportunity by Distribution Channel

Market opportunity by Distribution Channel ($ million)
Data Table on Market opportunity by Distribution Channel ($ million)

10. Market Segmentation by Product Type

10.1 Market segments

Chart on Product Type - Market share 2025-2030 (%)
Data Table on Product Type - Market share 2025-2030 (%)

10.2 Comparison by Product Type

Chart on Comparison by Product Type
Data Table on Comparison by Product Type

10.3 Mass - Market size and forecast 2025-2030

Chart on Mass - Market size and forecast 2025-2030 ($ million)
Data Table on Mass - Market size and forecast 2025-2030 ($ million)
Chart on Mass - Year-over-year growth 2025-2030 (%)
Data Table on Mass - Year-over-year growth 2025-2030 (%)

10.4 Premium - Market size and forecast 2025-2030

Chart on Premium - Market size and forecast 2025-2030 ($ million)
Data Table on Premium - Market size and forecast 2025-2030 ($ million)
Chart on Premium - Year-over-year growth 2025-2030 (%)
Data Table on Premium - Year-over-year growth 2025-2030 (%)

10.5 Market opportunity by Product Type

Market opportunity by Product Type ($ million)
Data Table on Market opportunity by Product Type ($ million)

11. Market Segmentation by End-user

11.1 Market segments

Chart on End-user - Market share 2025-2030 (%)
Data Table on End-user - Market share 2025-2030 (%)

11.2 Comparison by End-user

Chart on Comparison by End-user
Data Table on Comparison by End-user

11.3 Food manufacturers - Market size and forecast 2025-2030

Chart on Food manufacturers - Market size and forecast 2025-2030 ($ million)
Data Table on Food manufacturers - Market size and forecast 2025-2030 ($ million)
Chart on Food manufacturers - Year-over-year growth 2025-2030 (%)
Data Table on Food manufacturers - Year-over-year growth 2025-2030 (%)

11.4 Retail and food service - Market size and forecast 2025-2030

Chart on Retail and food service - Market size and forecast 2025-2030 ($ million)
Data Table on Retail and food service - Market size and forecast 2025-2030 ($ million)
Chart on Retail and food service - Year-over-year growth 2025-2030 (%)
Data Table on Retail and food service - Year-over-year growth 2025-2030 (%)

11.5 Market opportunity by End-user

Market opportunity by End-user ($ million)
Data Table on Market opportunity by End-user ($ million)

12. Market Segmentation by Type

12.1 Market segments

Chart on Type - Market share 2025-2030 (%)
Data Table on Type - Market share 2025-2030 (%)

12.2 Comparison by Type

Chart on Comparison by Type
Data Table on Comparison by Type

12.3 Anchovy - Market size and forecast 2025-2030

Chart on Anchovy - Market size and forecast 2025-2030 ($ million)
Data Table on Anchovy - Market size and forecast 2025-2030 ($ million)
Chart on Anchovy - Year-over-year growth 2025-2030 (%)
Data Table on Anchovy - Year-over-year growth 2025-2030 (%)

12.4 Mackerel - Market size and forecast 2025-2030

Chart on Mackerel - Market size and forecast 2025-2030 ($ million)
Data Table on Mackerel - Market size and forecast 2025-2030 ($ million)
Chart on Mackerel - Year-over-year growth 2025-2030 (%)
Data Table on Mackerel - Year-over-year growth 2025-2030 (%)

12.5 Squid - Market size and forecast 2025-2030

Chart on Squid - Market size and forecast 2025-2030 ($ million)
Data Table on Squid - Market size and forecast 2025-2030 ($ million)
Chart on Squid - Year-over-year growth 2025-2030 (%)
Data Table on Squid - Year-over-year growth 2025-2030 (%)

12.6 Shrimp - Market size and forecast 2025-2030

Chart on Shrimp - Market size and forecast 2025-2030 ($ million)
Data Table on Shrimp - Market size and forecast 2025-2030 ($ million)
Chart on Shrimp - Year-over-year growth 2025-2030 (%)
Data Table on Shrimp - Year-over-year growth 2025-2030 (%)

12.7 Others - Market size and forecast 2025-2030

Chart on Others - Market size and forecast 2025-2030 ($ million)
Data Table on Others - Market size and forecast 2025-2030 ($ million)
Chart on Others - Year-over-year growth 2025-2030 (%)
Data Table on Others - Year-over-year growth 2025-2030 (%)

12.8 Market opportunity by Type

Market opportunity by Type ($ million)
Data Table on Market opportunity by Type ($ million)

13. Customer Landscape

13.1 Customer landscape overview

Analysis of price sensitivity, lifecycle, customer purchase basket, adoption rates, and purchase criteria

14. Geographic Landscape

14.1 Geographic segmentation

Chart on Market share by geography 2025-2030 (%)
Data Table on Market share by geography 2025-2030 (%)

14.2 Geographic comparison

Chart on Geographic comparison
Data Table on Geographic comparison

14.3 APAC - Market size and forecast 2025-2030

Chart on APAC - Market size and forecast 2025-2030 ($ million)
Data Table on APAC - Market size and forecast 2025-2030 ($ million)
Chart on APAC - Year-over-year growth 2025-2030 (%)
Data Table on APAC - Year-over-year growth 2025-2030 (%)
Chart on Regional Comparison - APAC
Data Table on Regional Comparison - APAC

14.3.1 China - Market size and forecast 2025-2030

Chart on China - Market size and forecast 2025-2030 ($ million)
Data Table on China - Market size and forecast 2025-2030 ($ million)
Chart on China - Year-over-year growth 2025-2030 (%)
Data Table on China - Year-over-year growth 2025-2030 (%)

14.3.2 Thailand - Market size and forecast 2025-2030

Chart on Thailand - Market size and forecast 2025-2030 ($ million)
Data Table on Thailand - Market size and forecast 2025-2030 ($ million)
Chart on Thailand - Year-over-year growth 2025-2030 (%)
Data Table on Thailand - Year-over-year growth 2025-2030 (%)

14.3.3 Vietnam - Market size and forecast 2025-2030

Chart on Vietnam - Market size and forecast 2025-2030 ($ million)
Data Table on Vietnam - Market size and forecast 2025-2030 ($ million)
Chart on Vietnam - Year-over-year growth 2025-2030 (%)
Data Table on Vietnam - Year-over-year growth 2025-2030 (%)

14.3.4 Japan - Market size and forecast 2025-2030

Chart on Japan - Market size and forecast 2025-2030 ($ million)
Data Table on Japan - Market size and forecast 2025-2030 ($ million)
Chart on Japan - Year-over-year growth 2025-2030 (%)
Data Table on Japan - Year-over-year growth 2025-2030 (%)

14.3.5 India - Market size and forecast 2025-2030

Chart on India - Market size and forecast 2025-2030 ($ million)
Data Table on India - Market size and forecast 2025-2030 ($ million)
Chart on India - Year-over-year growth 2025-2030 (%)
Data Table on India - Year-over-year growth 2025-2030 (%)

14.3.6 Indonesia - Market size and forecast 2025-2030

Chart on Indonesia - Market size and forecast 2025-2030 ($ million)
Data Table on Indonesia - Market size and forecast 2025-2030 ($ million)
Chart on Indonesia - Year-over-year growth 2025-2030 (%)
Data Table on Indonesia - Year-over-year growth 2025-2030 (%)

14.4 Europe - Market size and forecast 2025-2030

Chart on Europe - Market size and forecast 2025-2030 ($ million)
Data Table on Europe - Market size and forecast 2025-2030 ($ million)
Chart on Europe - Year-over-year growth 2025-2030 (%)
Data Table on Europe - Year-over-year growth 2025-2030 (%)
Chart on Regional Comparison - Europe
Data Table on Regional Comparison - Europe

14.4.1 UK - Market size and forecast 2025-2030

Chart on UK - Market size and forecast 2025-2030 ($ million)
Data Table on UK - Market size and forecast 2025-2030 ($ million)
Chart on UK - Year-over-year growth 2025-2030 (%)
Data Table on UK - Year-over-year growth 2025-2030 (%)

14.4.2 Germany - Market size and forecast 2025-2030

Chart on Germany - Market size and forecast 2025-2030 ($ million)
Data Table on Germany - Market size and forecast 2025-2030 ($ million)
Chart on Germany - Year-over-year growth 2025-2030 (%)
Data Table on Germany - Year-over-year growth 2025-2030 (%)

14.4.3 France - Market size and forecast 2025-2030

Chart on France - Market size and forecast 2025-2030 ($ million)
Data Table on France - Market size and forecast 2025-2030 ($ million)
Chart on France - Year-over-year growth 2025-2030 (%)
Data Table on France - Year-over-year growth 2025-2030 (%)

14.4.4 Italy - Market size and forecast 2025-2030

Chart on Italy - Market size and forecast 2025-2030 ($ million)
Data Table on Italy - Market size and forecast 2025-2030 ($ million)
Chart on Italy - Year-over-year growth 2025-2030 (%)
Data Table on Italy - Year-over-year growth 2025-2030 (%)

14.4.5 Spain - Market size and forecast 2025-2030

Chart on Spain - Market size and forecast 2025-2030 ($ million)
Data Table on Spain - Market size and forecast 2025-2030 ($ million)
Chart on Spain - Year-over-year growth 2025-2030 (%)
Data Table on Spain - Year-over-year growth 2025-2030 (%)

14.4.6 The Netherlands - Market size and forecast 2025-2030

Chart on The Netherlands - Market size and forecast 2025-2030 ($ million)
Data Table on The Netherlands - Market size and forecast 2025-2030 ($ million)
Chart on The Netherlands - Year-over-year growth 2025-2030 (%)
Data Table on The Netherlands - Year-over-year growth 2025-2030 (%)

14.5 North America - Market size and forecast 2025-2030

Chart on North America - Market size and forecast 2025-2030 ($ million)
Data Table on North America - Market size and forecast 2025-2030 ($ million)
Chart on North America - Year-over-year growth 2025-2030 (%)
Data Table on North America - Year-over-year growth 2025-2030 (%)
Chart on Regional Comparison - North America
Data Table on Regional Comparison - North America

14.5.1 US - Market size and forecast 2025-2030

Chart on US - Market size and forecast 2025-2030 ($ million)
Data Table on US - Market size and forecast 2025-2030 ($ million)
Chart on US - Year-over-year growth 2025-2030 (%)
Data Table on US - Year-over-year growth 2025-2030 (%)

14.5.2 Canada - Market size and forecast 2025-2030

Chart on Canada - Market size and forecast 2025-2030 ($ million)
Data Table on Canada - Market size and forecast 2025-2030 ($ million)
Chart on Canada - Year-over-year growth 2025-2030 (%)
Data Table on Canada - Year-over-year growth 2025-2030 (%)

14.5.3 Mexico - Market size and forecast 2025-2030

Chart on Mexico - Market size and forecast 2025-2030 ($ million)
Data Table on Mexico - Market size and forecast 2025-2030 ($ million)
Chart on Mexico - Year-over-year growth 2025-2030 (%)
Data Table on Mexico - Year-over-year growth 2025-2030 (%)

14.6 Middle East and Africa - Market size and forecast 2025-2030

Chart on Middle East and Africa - Market size and forecast 2025-2030 ($ million)
Data Table on Middle East and Africa - Market size and forecast 2025-2030 ($ million)
Chart on Middle East and Africa - Year-over-year growth 2025-2030 (%)
Data Table on Middle East and Africa - Year-over-year growth 2025-2030 (%)
Chart on Regional Comparison - Middle East and Africa
Data Table on Regional Comparison - Middle East and Africa

14.6.1 Saudi Arabia - Market size and forecast 2025-2030

Chart on Saudi Arabia - Market size and forecast 2025-2030 ($ million)
Data Table on Saudi Arabia - Market size and forecast 2025-2030 ($ million)
Chart on Saudi Arabia - Year-over-year growth 2025-2030 (%)
Data Table on Saudi Arabia - Year-over-year growth 2025-2030 (%)

14.6.2 UAE - Market size and forecast 2025-2030

Chart on UAE - Market size and forecast 2025-2030 ($ million)
Data Table on UAE - Market size and forecast 2025-2030 ($ million)
Chart on UAE - Year-over-year growth 2025-2030 (%)
Data Table on UAE - Year-over-year growth 2025-2030 (%)

14.6.3 South Africa - Market size and forecast 2025-2030

Chart on South Africa - Market size and forecast 2025-2030 ($ million)
Data Table on South Africa - Market size and forecast 2025-2030 ($ million)
Chart on South Africa - Year-over-year growth 2025-2030 (%)
Data Table on South Africa - Year-over-year growth 2025-2030 (%)

14.6.4 Turkey - Market size and forecast 2025-2030

Chart on Turkey - Market size and forecast 2025-2030 ($ million)
Data Table on Turkey - Market size and forecast 2025-2030 ($ million)
Chart on Turkey - Year-over-year growth 2025-2030 (%)
Data Table on Turkey - Year-over-year growth 2025-2030 (%)

14.6.5 Egypt - Market size and forecast 2025-2030

Chart on Egypt - Market size and forecast 2025-2030 ($ million)
Data Table on Egypt - Market size and forecast 2025-2030 ($ million)
Chart on Egypt - Year-over-year growth 2025-2030 (%)
Data Table on Egypt - Year-over-year growth 2025-2030 (%)

14.7 South America - Market size and forecast 2025-2030

Chart on South America - Market size and forecast 2025-2030 ($ million)
Data Table on South America - Market size and forecast 2025-2030 ($ million)
Chart on South America - Year-over-year growth 2025-2030 (%)
Data Table on South America - Year-over-year growth 2025-2030 (%)
Chart on Regional Comparison - South America
Data Table on Regional Comparison - South America

14.7.1 Brazil - Market size and forecast 2025-2030

Chart on Brazil - Market size and forecast 2025-2030 ($ million)
Data Table on Brazil - Market size and forecast 2025-2030 ($ million)
Chart on Brazil - Year-over-year growth 2025-2030 (%)
Data Table on Brazil - Year-over-year growth 2025-2030 (%)

14.7.2 Argentina - Market size and forecast 2025-2030

Chart on Argentina - Market size and forecast 2025-2030 ($ million)
Data Table on Argentina - Market size and forecast 2025-2030 ($ million)
Chart on Argentina - Year-over-year growth 2025-2030 (%)
Data Table on Argentina - Year-over-year growth 2025-2030 (%)

14.7.3 Chile - Market size and forecast 2025-2030

Chart on Chile - Market size and forecast 2025-2030 ($ million)
Data Table on Chile - Market size and forecast 2025-2030 ($ million)
Chart on Chile - Year-over-year growth 2025-2030 (%)
Data Table on Chile - Year-over-year growth 2025-2030 (%)

14.8 Market opportunity by geography

Market opportunity by geography ($ million)
Data Tables on Market opportunity by geography ($ million)

15. Drivers, Challenges, and Opportunity

15.1 Market drivers

Increasing global popularity of southeast Asian culinary traditions
Expansion of e-commerce and modern retail infrastructure
Rising health consciousness and demand for clean label ingredients

15.2 Market challenges

Stringent regulatory compliance and global traceability standards
Supply chain volatility and raw material scarcity
Evolving health concerns and demand for sodium reduction

15.3 Impact of drivers and challenges

Impact of drivers and challenges in 2025 and 2030

15.4 Market opportunities

Rise of digital traceability and sustainable sourcing
Expansion of premium and artisanal condiment categories
Innovations in clean label and low sodium formulations

16. Competitive Landscape

16.1 Overview

16.2

Overview on criticality of inputs and factors of differentiation

16.3 Landscape disruption

Overview on factors of disruption

16.4 Industry risks

Impact of key risks on business

17. Competitive Analysis

17.1 Companies profiled

Companies covered

17.2 Company ranking index

17.3 Market positioning of companies

Matrix on companies position and classification

17.4 Blue Elephant International

Blue Elephant International - Overview
Blue Elephant International - Product / Service
Blue Elephant International - Key offerings
SWOT

17.5 Fish Sauce Thai Co. Ltd.

Fish Sauce Thai Co. Ltd. - Overview
Fish Sauce Thai Co. Ltd. - Product / Service
Fish Sauce Thai Co. Ltd. - Key offerings
SWOT

17.6 Halcyon Proteins Pty. Ltd.

Halcyon Proteins Pty. Ltd. - Overview
Halcyon Proteins Pty. Ltd. - Product / Service
Halcyon Proteins Pty. Ltd. - Key offerings
SWOT

17.7 Hung Thanh Co., Ltd.

Hung Thanh Co., Ltd. - Overview
Hung Thanh Co., Ltd. - Product / Service
Hung Thanh Co., Ltd. - Key offerings
SWOT

17.8 Kimlan Foods Co. Ltd.

Kimlan Foods Co. Ltd. - Overview
Kimlan Foods Co. Ltd. - Product / Service
Kimlan Foods Co. Ltd. - Key offerings
SWOT

17.9 Knorr

Knorr - Overview
Knorr - Product / Service
Knorr - Key offerings
SWOT

17.10 Mae Sri Pty Ltd.

Mae Sri Pty Ltd. - Overview
Mae Sri Pty Ltd. - Product / Service
Mae Sri Pty Ltd. - Key offerings
SWOT

17.11 Masan Group

Masan Group - Overview
Masan Group - Business segments
Masan Group - Key offerings
Masan Group - Segment focus
SWOT

17.12 Mega Chef Co. Ltd.

Mega Chef Co. Ltd. - Overview
Mega Chef Co. Ltd. - Product / Service
Mega Chef Co. Ltd. - Key offerings
SWOT

17.13 Nestle SA

Nestle SA - Overview
Nestle SA - Business segments
Nestle SA - Key news
Nestle SA - Key offerings
Nestle SA - Segment focus
SWOT

17.14 Pantainorasingh Manufacturer

Pantainorasingh Manufacturer - Overview
Pantainorasingh Manufacturer - Product / Service
Pantainorasingh Manufacturer - Key offerings
SWOT

17.15 Phu Nhi Fish Sauce

Phu Nhi Fish Sauce - Overview
Phu Nhi Fish Sauce - Product / Service
Phu Nhi Fish Sauce - Key offerings
SWOT

17.16 Pichai Fish Sauce Co. Ltd.

Pichai Fish Sauce Co. Ltd. - Overview
Pichai Fish Sauce Co. Ltd. - Product / Service
Pichai Fish Sauce Co. Ltd. - Key offerings
SWOT

17.17 Rayong Fish Sauce Industry Co. Ltd.

Rayong Fish Sauce Industry Co. Ltd. - Overview
Rayong Fish Sauce Industry Co. Ltd. - Product / Service
Rayong Fish Sauce Industry Co. Ltd. - Key offerings
SWOT

17.18 Real Thai Co. Ltd.

Real Thai Co. Ltd. - Overview
Real Thai Co. Ltd. - Product / Service
Real Thai Co. Ltd. - Key offerings
SWOT

18. Appendix

18.1 Scope of the report

Market definition
Objectives
Notes and caveats

18.2 Inclusions and exclusions checklist

Inclusions checklist
Exclusions checklist

18.3 Currency conversion rates for US$

18.4 Research methodology

18.5 Data procurement

Information sources

18.6 Data validation

18.7 Validation techniques employed for market sizing

18.8 Data synthesis

18.9 360 degree market analysis

18.10 List of abbreviations

Research Methodology

Technavio presents a detailed picture of the market by way of study, synthesis, and summation of data from multiple sources. The analysts have presented the various facets of the market with a particular focus on identifying the key industry influencers. The data thus presented is comprehensive, reliable, and the result of extensive research, both primary and secondary.

INFORMATION SOURCES

Primary sources

  • Manufacturers and suppliers
  • Channel partners
  • Industry experts
  • Strategic decision makers

Secondary sources

  • Industry journals and periodicals
  • Government data
  • Financial reports of key industry players
  • Historical data
  • Press releases

DATA ANALYSIS

Data Synthesis

  • Collation of data
  • Estimation of key figures
  • Analysis of derived insights

Data Validation

  • Triangulation with data models
  • Reference against proprietary databases
  • Corroboration with industry experts

REPORT WRITING

Qualitative

  • Market drivers
  • Market challenges
  • Market trends
  • Five forces analysis

Quantitative

  • Market size and forecast
  • Market segmentation
  • Geographical insights
  • Competitive landscape

Interested in this report?

Get your sample now to see our research methodology and insights!

Download Now

Frequently Asked Questions

Fish Sauce market growth will increase by USD 1384.1 million during 2026-2030.

The Fish Sauce market is expected to grow at a CAGR of 7.5% during 2026-2030.

Fish Sauce market is segmented by Product (Industrial fish sauce, Traditional fish sauce) Distribution channel (Offline, Online) Product type (Mass, Premium) End-user (Food manufacturers, Retail and food service) Type (Anchovy, Mackerel, Squid, Shrimp, Others)

Blue Elephant International, California Fish Sauce, Fish Sauce Thai Co. Ltd., Halcyon Proteins Pty. Ltd., Hung Thanh Co., Ltd., Kimlan Foods Co. Ltd., Knorr, Mae Sri Pty Ltd., Masan Group, Mega Chef Co. Ltd., Nestle SA, Pantainorasingh Manufacturer, Phu Nhi Fish Sauce, Pichai Fish Sauce Co. Ltd., Rayong Fish Sauce Industry Co. Ltd., Roland Foods LLC, Rungroj Fish Sauce Co. Ltd., Thai Fishsauce Factory Co. Ltd., Real Thai Co. Ltd., Viet Phu Inc. are a few of the key vendors in the Fish Sauce market.

APAC will register the highest growth rate of 83.4% among the other regions. Therefore, the Fish Sauce market in APAC is expected to garner significant business opportunities for the vendors during the forecast period.

China, Thailand, Vietnam, Japan, India, Indonesia, UK, Germany, France, Italy, Spain, The Netherlands, US, Canada, Mexico, Saudi Arabia, UAE, South Africa, Turkey, Egypt, Brazil, Argentina, Chile

  • Increasing global popularity of southeast Asian culinary traditions is the driving factor this market.

The Fish Sauce market vendors should focus on grabbing business opportunities from the Product segment as it accounted for the largest market share in the base year.
RIA - Research AI Assistant
Ask RIA