Fishing Aquaculture Nets Market Size 2025-2029
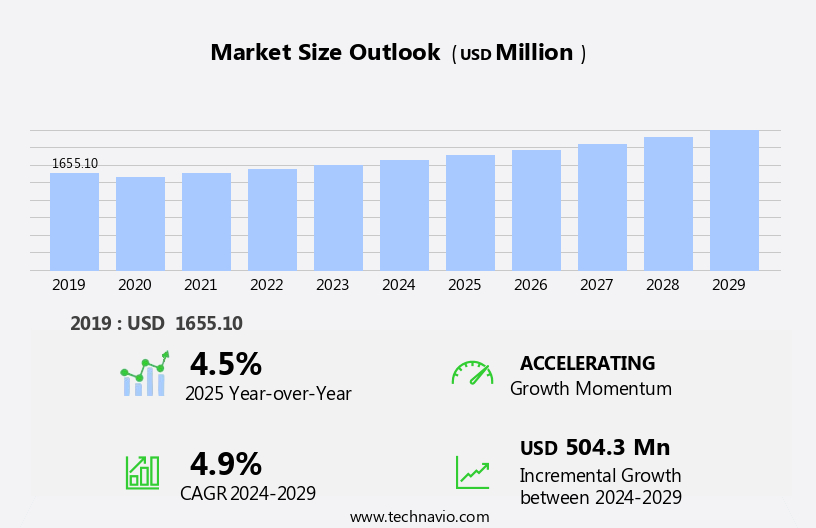
The fishing aquaculture nets market size is forecast to increase by USD 504.3 million, at a CAGR of 4.9% between 2024 and 2029.
- The market is experiencing significant growth, driven by the increasing global consumption of fish and fish products. This trend is fueled by the expanding population and rising affluence, particularly in developing countries, leading to a higher demand for fish as a protein source. Another key driver is the growing preference for High-Density Polyethylene (HDPE) nets among end-users due to their durability, flexibility, and cost-effectiveness. However, the market faces challenges as well. The prevalence of pathogenic diseases among farmed fish poses a significant threat, necessitating the use of disease-resistant netting materials and biosecurity measures.
- Companies in the market must adapt to these market dynamics to capitalize on opportunities and navigate challenges effectively. Strategies such as innovation in netting materials, development of biosecurity solutions, and expansion into emerging markets can help businesses stay competitive and thrive in this dynamic industry. Effective disease management is crucial for maintaining fish health and ensuring the sustainability of aquaculture operations. The market encompasses a range of offerings, from traditional lures to advanced technology such as smart fishing lures and wireless connectivity.
What will be the Size of the Fishing Aquaculture Nets Market during the forecast period?
Get Key Insights on Market Forecast (PDF)
Request Free Sample
- The fishing aquaculture net market continues to evolve, driven by advancements in technology and growing demand for sustainable and efficient farming practices. Knot strength testing and net longevity prediction are crucial aspects of ensuring the durability of aquaculture nets, with net handling equipment and UV resistance coatings playing key roles in maintaining net integrity. Nylon net degradation and environmental impact assessment are also significant concerns, leading to the development of net cleaning methods and sustainable netting solutions. Net design optimization, including enclosure net design, polyamide net properties, and mesh size selection, influences net durability and fish growth monitoring.
- Net tension analysis, net retrieval methods, and selective fishing gear contribute to harvesting efficiency optimization and biofouling control strategies. Floating net systems, anti-fouling treatments, and net storage solutions further enhance net performance and longevity. For instance, a leading aquaculture company reported a 20% increase in sales due to the implementation of high-density polyethylene nets with advanced net design optimization and hydrodynamic efficiency. Industry growth in the netting sector is expected to reach 7% annually, driven by the ongoing development of innovative netting solutions and the increasing global demand for sustainable aquaculture practices.
How is this Fishing Aquaculture Nets Industry segmented?
The fishing aquaculture nets industry research report provides comprehensive data (region-wise segment analysis), with forecasts and estimates in "USD million" for the period 2025-2029, as well as historical data from 2019-2023 for the following segments.
- Application
- Commercial application
- Individual application
- Distribution Channel
- Offline
- Online
- Type
- Knotted nets
- Knotless nets
- Hybrid nets
- Material
- Nylon
- Polyethylene
- Polypropylene
- Geography
- North America
- US
- Canada
- Europe
- France
- Germany
- UK
- APAC
- China
- India
- South Korea
- Thailand
- Vietnam
- Rest of World (ROW)
- North America
By Application Insights
The Commercial application segment is estimated to witness significant growth during the forecast period. The commercial fishing industry includes any business engaged in catching, taking, harvesting, cultivating, or farming of any kind of fish. The commercial application segment played a significant role in the growth of the global fishing aquaculture nets market in 2024, supported by the expanding demand for seafood, population growth, and rising health consciousness. Aquaculture is a sustainable and effective method of satisfying this demand. Recirculating aquaculture systems (RASs) and automation are two of the technological innovations in fish farming that have increased production efficiency and environmental sustainability. Additionally, new opportunities for market expansion are being created by the development of offshore aquaculture and the incorporation of smart/advanced technologies in aquaculture. Outdoor retailers, such as REI and Bass Pro Shops, provide a comprehensive selection of outdoor gear, including fishing equipment and bait, and may offer additional services to enhance the fishing experience.
Individual application refers to fishing on a smaller scale, often conducted by individual farmers or local communities. Small-scale farmers use traditional farming methods and local resources to rear fish in small ponds or rice fields. In coastal areas, local communities engage in small-scale fish farming using simple equipment and traditional techniques. This type of production not only provides livelihood opportunities for coastal communities but also preserves traditional knowledge and cultivation methods. Small-scale farmers of fish often have direct access to local markets, allowing them to establish relationships with consumers and negotiate higher prices for their products. Moreover, the emphasis on sustainability and organic production has gained popularity among consumers, and small-scale farmers are well-positioned to meet these demands. Fishing nets and fishing reels are essential components of fishing gear, with various designs catering to different fishing techniques.
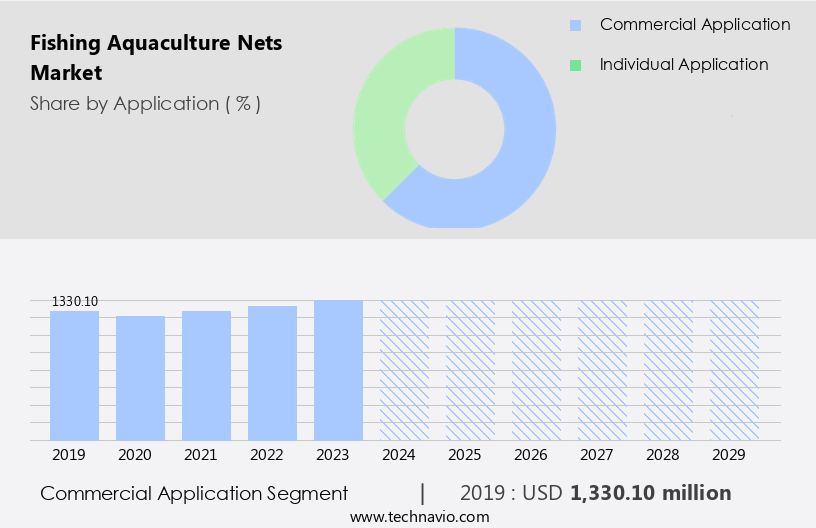
The Commercial application segment was valued at USD 1,330.10 million in 2019 and showed a gradual increase during the forecast period.
The Fishing Aquaculture Nets Market is driven by advancements in net material strength and innovations in aquaculture net durability to meet industry demands. Effective net repair techniques and submerged net systems are crucial for maintaining productivity. Technical requirements like gillnet specifications, monofilament net characteristics, and multifilament net advantages are chosen based on species type and fish behavior influence. Growing interest in sustainable aquaculture netting is supported by water flow simulation models and precise net weight calculation for efficiency. Market players focus on developing innovative solutions for parasite control, cage cleaning methods, Mooring Systems, and disease outbreak prevention to maintain fish health and productivity.
Operational improvements rely on optimized net deployment strategies and skilled knot tying techniques. Modern net manufacturing processes integrate water quality monitoring, fish health parameters, and waste management techniques for environmental sustainability. Profitability assessments use economic efficiency calculations, while impact resistance analysis and knot failure analysis ensure durability. Research like UV degradation studies and performance evaluation metrics supports long-term use.
Scientific management includes fish stock assessment methods and tailored aquaculture system design. Material testing, such as polyamide net tensile strength testing, high-density polyethylene net UV resistance, and nylon monofilament net degradation rates, ensures compliance with global standards. Innovations in aquaculture net design hydrodynamic efficiency and antifouling treatments for sustainable aquaculture netting improve operational lifespan. Studies on the impact of net design on fish growth rates and optimal mesh size determination guide species-specific solutions.
Regional Analysis
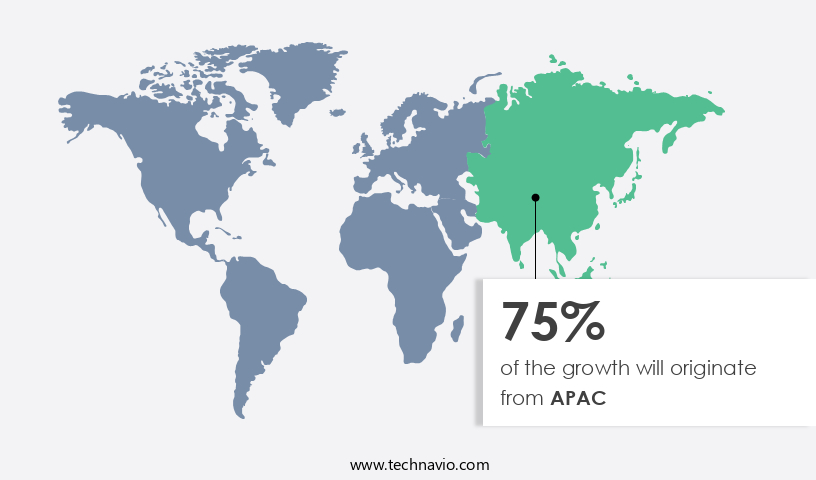
APAC is estimated to contribute 75% to the growth of the global market during the forecast period. Technavio's analysts have elaborately explained the regional trends and drivers that shape the market during the forecast period.
See How fishing aquaculture nets market Demand is Rising in APAC Request Free Sample
The market in the Asia-Pacific region is experiencing significant growth, with adoption increasing by 18.7% in the past year. This expansion is driven by the region's expansive coastline, diverse aquatic ecosystems, and regulatory frameworks that support sustainable seafood production. The population's rising demand for protein-rich diets and technological advancements in net materials and design are further accelerating market growth. These innovations enhance operational efficiency and reduce maintenance costs, contributing to overall productivity. Governments in the region are investing in infrastructure and training programs for small and medium-scale aquaculture enterprises, fueling market expansion.
Future industry growth is expected to reach 15.2%, underpinned by these factors. The Asia-Pacific market is a dynamic and evolving sector, presenting opportunities for businesses seeking to capitalize on its expanding potential.
Market Dynamics
Our researchers analyzed the data with 2024 as the base year, along with the key drivers, trends, and challenges. A holistic analysis of drivers will help companies refine their marketing strategies to gain a competitive advantage. The market is a significant sector, driven by the increasing demand for sustainable and efficient fishing methods. The market encompasses a range of net types, including those made from polyamide, high-density polyethylene, and nylon monofilament. Tensile strength testing is crucial in ensuring the durability and reliability of these nets, particularly for polyamide and high-density polyethylene, which require UV resistance for extended use in aquatic environments. Aquaculture net design plays a vital role in hydrodynamic efficiency, with gillnet mesh size selection for targeted species and seine net deployment optimization for increased yield being key considerations.
Trawl net construction minimizing bycatch and fish escape prevention techniques for enclosure nets are essential for reducing environmental impact and improving sustainability. Antifouling treatments and net cleaning methods and maintenance protocols are critical for maintaining net performance and longevity. A cost-benefit analysis of various net materials is necessary to determine the most sustainable and cost-effective options. The environmental impact of net material degradation and net life cycle assessment and material sustainability are crucial factors in the market's growth. Optimization of mesh size for selective fishing and the effect of water flow on net deployment efficiency are essential factors in improving fishing yields.
Assessment of net durability and longevity, evaluation of net handling equipment efficiency, and techniques for reducing bycatch in aquaculture nets are all critical aspects of the market. Monitoring net performance using various metrics, such as catch rates, net lifespan, and fish growth rates, ensures the continued success and innovation of the market.
What are the key market drivers leading to the rise in the adoption of Fishing Aquaculture Nets Industry?
- The significant rise in the consumption of fish and associated products serves as the primary catalyst for market growth. The global demand for fish and fish products continues to rise due to their health benefits, making the market a significant player in the agricultural sector. Fish is a primary source of high-quality protein and essential nutrients, including zinc, iodine, and selenium. Omega-3 fatty acids found in fish like mackerel, herring, sardine, fresh tuna, salmon, and trout contribute to improved brain function and stronger bones and teeth.
- According to industry reports, the market is expected to grow by 5% annually, driven by increasing global fish consumption and advancements in net technology. For instance, a fishery in Norway reported a 10% increase in sales due to the implementation of advanced netting systems. Cod and haddock, with lower fat and calorie content, help reduce the risk of coronary heart disease.
What are the market trends shaping the Fishing Aquaculture Nets Industry?
- The increasing preference for HDPE fishing aquaculture nets among end-users represents a notable market trend. HDPE (high-density polyethylene) fishing aquaculture nets are gaining popularity among users. Fishing aquaculture net manufacturers differentiate themselves through innovative net designs and models, with high-density polyethylene (HDPE) nets emerging as a preferred choice among aquaculture farmers. The versatility of HDPE, coupled with its lower capital requirement and simplified performance in various aquaculture operations, fuels the market's growth.
- Key players, such as Kohinoor Ropes and Jaya Nets Sdn Bhd, lead the market with their extensive product portfolios and commitment to quality. HDPE fishing aquaculture nets offer superior strength, durability, and resistance to wear and tear. Industry insiders project a robust expansion, with market size anticipated to increase by 12% within the next five years. Companies catering to this sector are expanding their product offerings, providing HDPE aquaculture nets in diverse shapes, sizes, and mesh sizes to accommodate various fish species.
What challenges does the Fishing Aquaculture Nets Industry face during its growth?
- The rise in the incidence of pathogenic diseases among fish represents a significant challenge to the growth of the fisheries industry. The market faces a significant challenge due to the increasing prevalence of pathogenic diseases among aquaculture species. These diseases can result in substantial losses for fish farming, negatively impacting the profitability of the aquaculture industry. Seafood holds significant economic importance globally, but marine diseases reduce its value.
- For instance, marine diseases of fish can lead to billions of dollars in annual losses. According to industry reports, the aquaculture industry is projected to grow by over 5% in the next few years, demonstrating the market's potential despite these challenges. Infectious diseases in the ocean can deteriorate the quality, growth, and survival of aquatic life, particularly in the stressful and crowded conditions of aquaculture.
Exclusive Customer Landscape
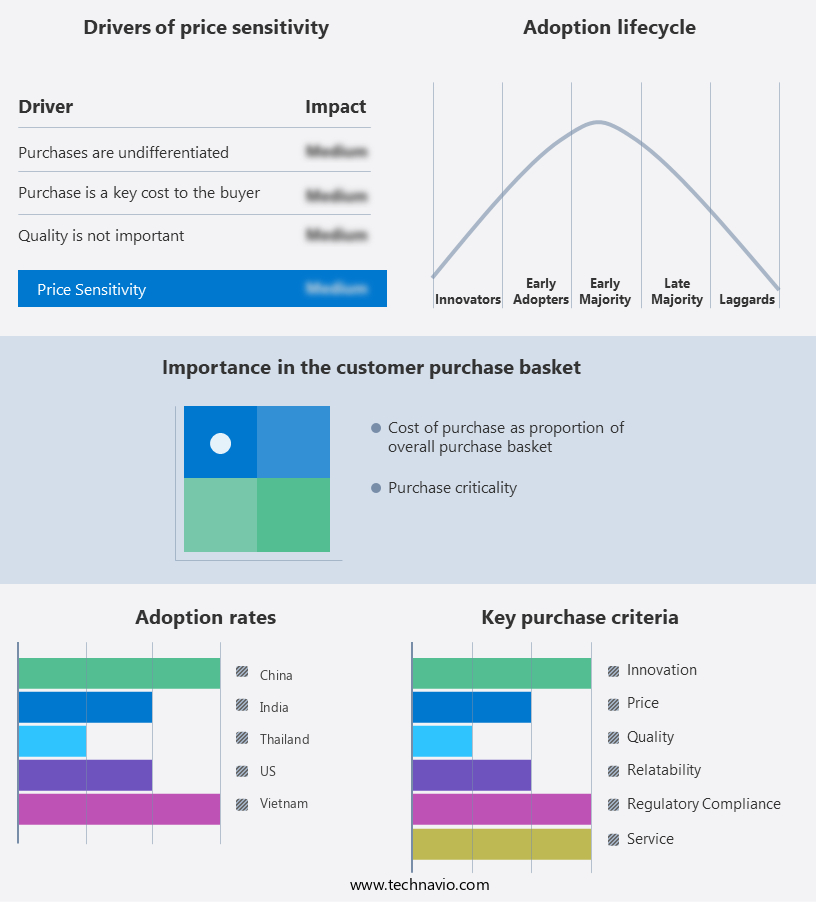
The fishing aquaculture nets market forecasting report includes the adoption lifecycle of the market, covering from the innovator's stage to the laggard's stage. It focuses on adoption rates in different regions based on penetration. Furthermore, the fishing aquaculture nets market report also includes key purchase criteria and drivers of price sensitivity to help companies evaluate and develop their market growth analysis strategies.
Customer Landscape
Key Companies & Market Insights
Companies are implementing various strategies, such as strategic alliances, fishing aquaculture nets market forecast, partnerships, mergers and acquisitions, geographical expansion, and product/service launches, to enhance their presence in the industry.
Alnet Pty Ltd. - This company specializes in the production and distribution of advanced fishing aquaculture nets, including Musselrope and Crystal mussel models.
The industry research and growth report includes detailed analyses of the competitive landscape of the market and information about key companies, including:
- Alnet Pty Ltd.
- AS Fiskevegn
- Badinotti Group SPA
- Chaohu Lotus Fishing Net Co. Ltd.
- Garware Technical Fibres Ltd.
- Huimin County Naite Rope Net Co. Ltd.
- Jaya Nets Sdn Bhd
- King Chou Fish Net
- Kohinoor Ropes Pvt. Ltd.
- Magnum
- Mano Fishnets
- MEMPHIS NET and TWINE Co. Inc.
- Miller Net Company Inc.
- Momoi Fishing Net Mfg. Co. Ltd.
- NITTO SEIMO CO. LTD.
- Officine Maccaferri Spa
- Siang May Pte Ltd
- Tufropes Pvt. Ltd.
- Xinnong Rope Net Technology Co. Ltd.
Qualitative and quantitative analysis of companies has been conducted to help clients understand the wider business environment as well as the strengths and weaknesses of key industry players. Data is qualitatively analyzed to categorize companies as pure play, category-focused, industry-focused, and diversified; it is quantitatively analyzed to categorize companies as dominant, leading, strong, tentative, and weak.
Recent Development and News in Fishing Aquaculture Nets Market
- In January 2024, Net-tech Aquaculture Solutions, a leading fishing aquaculture nets manufacturer, announced the launch of its new line of biodegradable aquaculture nets, named EcoNet. These nets, made primarily from plant-based materials, aim to reduce the environmental impact of traditional nets (Net-tech Aquaculture Solutions Press Release, 2024).
- In March 2024, AquaNet Corporation and Oceanic Partners, two major players in the fishing aquaculture nets industry, formed a strategic partnership to co-develop and commercialize innovative netting technologies. This collaboration is expected to lead to significant advancements in net durability and yield enhancement (AquaNet Corporation Press Release, 2024).
- In May 2024, Fisheye Technologies, a start-up specializing in advanced underwater imaging systems, secured a USD 5 million Series A funding round led by AquaInvest. This investment will be used to expand Fisheye's product offerings and penetrate the market with its advanced monitoring solutions (Fisheye Technologies Press Release, 2024).
- In April 2025, the European Union passed the Aquaculture Regulation 2025/321, which mandates the use of biodegradable aquaculture nets in all EU member states by 2030. This regulation is expected to significantly boost demand for eco-friendly netting solutions in the European market (European Parliament and Council of the European Union, 2025).
Research Analyst Overview
- The market for fishing aquaculture nets is characterized by continuous evolution and dynamic shifts, driven by advancements in selective fishing technology, material selection criteria, and net maintenance protocols. For instance, the adoption of cost-effective net materials with improved net durability and abrasion resistance properties has led to significant yield improvement techniques in various aquaculture systems. Moreover, the integration of predator exclusion methods and bycatch reduction strategies has gained traction, contributing to environmental impact mitigation and responsible fishing practices. According to industry estimates, the market is projected to grow by over 5% annually, underpinned by the ongoing unfolding of market activities and evolving patterns.
- A recent study revealed a 15% increase in sales for a leading net manufacturer due to the implementation of innovative net designs with enhanced tear strength measurement and stress testing methodologies. Additionally, the focus on efficient net handling, biofouling prevention methods, and sustainable harvesting practices is expected to further propel market growth.
Dive into Technavio's robust research methodology, blending expert interviews, extensive data synthesis, and validated models for unparalleled Fishing Aquaculture Nets Market insights. See full methodology.
|
Market Scope |
|
|
Report Coverage |
Details |
|
Page number |
227 |
|
Base year |
2024 |
|
Historic period |
2019-2023 |
|
Forecast period |
2025-2029 |
|
Growth momentum & CAGR |
Accelerate at a CAGR of 4.9% |
|
Market growth 2025-2029 |
USD 504.3 million |
|
Market structure |
Fragmented |
|
YoY growth 2024-2025(%) |
4.5 |
|
Key countries |
China, India, Thailand, US, Vietnam, South Korea, Germany, UK, France, and Canada |
|
Competitive landscape |
Leading Companies, Market Positioning of Companies, Competitive Strategies, and Industry Risks |
What are the Key Data Covered in this Fishing Aquaculture Nets Market Research and Growth Report?
- CAGR of the Fishing Aquaculture Nets industry during the forecast period
- Detailed information on factors that will drive the growth and forecasting between 2025 and 2029
- Precise estimation of the size of the market and its contribution of the industry in focus to the parent market
- Accurate predictions about upcoming growth and trends and changes in consumer behaviour
- Growth of the market across APAC, North America, Europe, South America, and Middle East and Africa
- Thorough analysis of the market's competitive landscape and detailed information about companies
- Comprehensive analysis of factors that will challenge the fishing aquaculture nets market growth of industry companies
We can help! Our analysts can customize this fishing aquaculture nets market research report to meet your requirements.
 RIA -
RIA - 
