Stress Testing Market Analysis North America, Europe, APAC, South America, Middle East and Africa - US, Canada, China, Germany, UK - Size and Forecast 2024-2028

Stress Testing Market Analysis North America, Europe, APAC, South America, Middle East and Africa - US, Canada, China, Germany, UK - Size and Forecast 2024-2028

Published: Jan 2024 179 Pages SKU: IRTNTR74384

Market Overview at a Glance

$4.91 B
Market Opportunity
17.53%
CAGR
15.61
YoY growth 2023-2024(%)

Stress Testing Market Size 2024-2028 

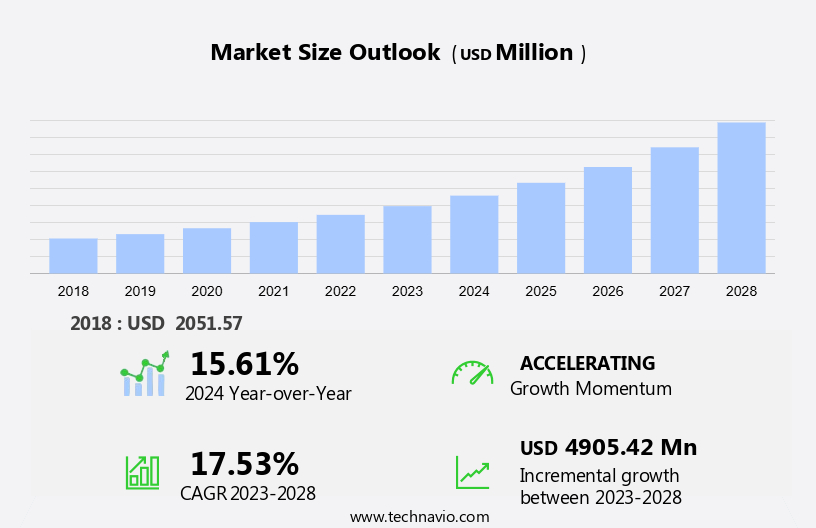
The stress testing market size is forecast to increase by USD 4.91 billion at a CAGR of 17.53% between 2023 and 2028.

  • The market is experiencing significant growth due to the increasing focus on early detection and management of health conditions such as mortality rate concerns in elderly and obese populations. Stress testing plays a crucial role in assessing the risk of coronary artery disease and heart failure. The adoption of advanced technologies like artificial intelligence (AI) in stress testing is gaining momentum, enabling more accurate and efficient testing.
  • Furthermore, the use of mobile devices and applications for stress testing is increasing, providing greater accessibility and convenience. However, cybersecurity concerns in cloud-based testing environments pose a challenge to market growth. Ensuring secure data transmission and storage is essential to maintain patient trust and regulatory compliance.

What will the Stress Testing Market Size During the Forecast Period?

Stress Testing Market Size

 Request Free Sample

  • The market is a critical component of the IT industry, ensuring the optimal performance and security of IT infrastructure and applications. Small and Medium Enterprises (SMEs) are increasingly recognizing the importance of outsourced testing services to address their IT security needs. Cybersecurity concerns have become a global health concern, with information security being a top priority for businesses. IT security guidelines mandate regular testing to ensure the protection of sensitive data and systems. In the banking segment, application testing, including load testing and diagnostic procedures, is essential to maintain customer trust and regulatory compliance. Moreover, mobile applications and cloud computing have revolutionized the way businesses operate. Stress testing tools are vital in assessing the performance and security of these applications under various conditions. Load testing helps determine the application's ability to handle high traffic and user volumes, ensuring a seamless user experience. Physiological functions, such as cardiovascular diseases (CVDs), are a significant demographic concern. Early detection and management of CVDs, including coronary artery disease, heart failure, obesity, hypertension, diabetes, dyslipidemia, and CVD mortality, are crucial for morbidity and mortality rate reduction. The elderly and obese groups are particularly vulnerable to CVDs. Preventive healthcare and proactive health management are essential to mitigate risks and improve overall health outcomes.

  • Stress testing plays a vital role in identifying potential issues before they become critical, enabling timely intervention and effective management. The market caters to various industries and applications, providing diagnostic procedures to assess the functionality and performance of IT infrastructure and applications under stress conditions. The market's growth is driven by the increasing demand for reliable and secure IT systems, the proliferation of digital transformation, and the need for early detection and management of health conditions. In conclusion, the market is a crucial player in the IT and healthcare industries, addressing cybersecurity concerns, ensuring application performance, and enabling early detection and management of health conditions. SMEs can benefit significantly from outsourced testing services, ensuring regulatory compliance, maintaining customer trust, and improving overall business performance.

How is this market segmented and which is the largest segment?

The market research report provides comprehensive data (region-wise segment analysis), with forecasts and estimates in "USD million" for the period 2024-2028, as well as historical data from 2018-2022 for the following segments.
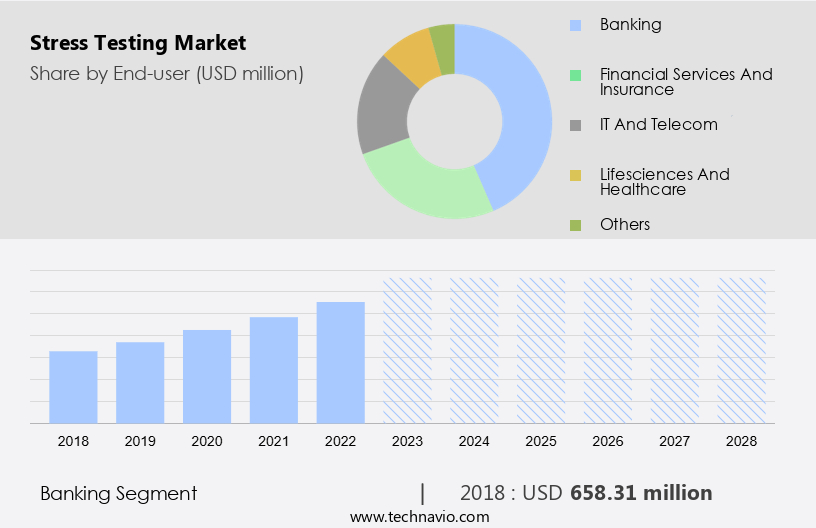
  • End-user
    • Banking
    • Financial services and insurance
    • IT and telecom
    • Lifesciences and healthcare
    • Others
  • Product
    • Application testing
    • Product testing
  • Geography
    • North America
      • Canada
      • US
    • Europe
      • Germany
      • UK
    • APAC
      • China
    • South America
    • Middle East and Africa

By End-user Insights

  • The banking segment is estimated to witness significant growth during the forecast period.

The market in the US is significantly influenced by the demographic landscape of obesity, hypertension, diabetes, and dyslipidemia, which are major risk factors for Cardiovascular Diseases (CVD) mortality and morbidity. According to the Centers for Disease Control and Prevention (CDC), approximately 133 million Americans have one or more chronic diseases, making preventive healthcare a priority. The market for stress testing is expected to grow steadily due to the increasing need for early detection and risk assessment of these conditions. In the US healthcare sector, stress testing is increasingly being adopted to improve patient outcomes and reduce healthcare costs. The market is segmented into various end-users, with hospitals and diagnostic centers holding the largest market share.

The adoption of advanced technologies such as Electrocardiogram (ECG) and Echocardiogram (ECHO) for stress testing is driving the growth of this segment. The IT sector is also a significant contributor to the market, with the increasing use of stress testing in IT infrastructure to ensure system stability and reliability. The need to mitigate risks and ensure business continuity in the face of increasing cyber threats and data breaches is driving the adoption of stress testing in this sector. In conclusion, the market in the US is expected to grow steadily due to the increasing focus on preventive healthcare and the need to ensure system reliability and stability across various industries.

The adoption of advanced technologies and the increasing awareness of the benefits of early detection and risk assessment are key drivers of market growth.

Stress Testing Market Size

Get a glance at the market report of share of various segments Request Free Sample

The Banking segment was valued at USD 658.31 million in 2018 and showed a gradual increase during the forecast period.

Regional Analysis

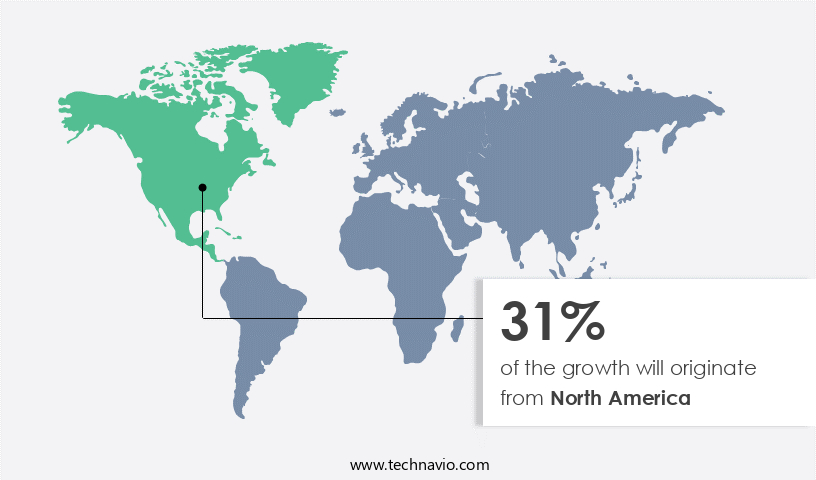
  • North America is estimated to contribute 31% to the growth of the global market during the forecast period.

Technavio's analysts have elaborately explained the regional trends and drivers that shape the market during the forecast period.

Stress Testing Market Share by Geography

For more insights on the market share of various regions Request Free Sample

In North America, the market is experiencing significant growth due to the increasing adoption of advanced technologies like AI, IoT, cloud, and analytics by healthcare organizations. The region's well-established cloud infrastructure is fueling the digital transformation in the healthcare sector, particularly in primary healthcare facilities such as cardiology departments. The SMAC (social, mobile, analytics, cloud) trend is gaining momentum in North America, leading to an increase in the implementation of mobile-first strategies for stress testing. Ergometry equipment, including treadmills, and imaging technologies like echocardiograms are increasingly being used for cardiovascular assessments and treatments. The market is witnessing a rise in the number of applications introduced by enterprises to support digitalization and DevOps.

Furthermore, the integration of AI in stress testing is revolutionizing patient care by enabling early detection and diagnosis of cardiovascular diseases. The high penetration of mobile devices in North America is also driving the growth of the market. Healthcare providers are leveraging mobile applications to offer remote patient monitoring and teleconsultation services, making stress testing more accessible and convenient for patients. With the increasing focus on patient-centric care and the need for efficient and accurate stress testing, the market is expected to continue its growth trajectory in North America.

Market Dynamics

Our researchers analyzed the data with 2023 as the base year, along with the key drivers, trends, and challenges. A holistic analysis of drivers will help companies refine their marketing strategies to gain a competitive advantage.

What are the key market drivers leading to the rise in adoption of Stress Testing Market?

The increasing adoption of mobile devices and applications is the key driver of the market.

  • The global market is experiencing significant growth due to the increasing number of Small and Medium Enterprises (SMEs) prioritizing information security and IT security guidelines, particularly in the banking segment. With cybersecurity concerns becoming increasingly prevalent, the need for rigorous application testing and testing tools is on the rise. According to recent studies, the adoption of mobile devices is expanding rapidly in emerging economies, including India, Brazil, China, Indonesia, and Argentina.
  • This mobile-first trend has led companies to invest heavily in mobile application development, making it essential for these applications to perform optimally. For e-commerce and digital payment providers, mobile applications serve as the foundation of their businesses. Any disruption in mobile application functionality could result in substantial financial losses. As the demand for mobile devices and applications continues to stream, ensuring their quality becomes increasingly important.

What are the market trends shaping the Stress Testing Market?

AI-based stress testing is the upcoming trend in the market.

  • Artificial Intelligence (AI) is revolutionizing the market by offering numerous advantages to organizations. In particular, AI is proving to be beneficial for assessing the health of elderly and obese groups, who are at higher risk for conditions such as coronary artery disease and heart failure. By utilizing AI technologies, stress testing can provide early detection and effective management of these conditions. AI enables faster test execution, reducing the time-to-market for new applications and software. It also enhances the depth and scope of test results, leading to increased accuracy and reliability. In today's competitive business landscape, organizations require quick turnaround times for testing to keep up with the frequent launch of new applications.
  • Performance testing is a crucial aspect of software development, and it begins with analyzing the user interface (UI) and generating test scripts. AI-driven stress testing solutions streamline this process, allowing for more efficient and effective testing. Moreover, AI algorithms can identify complex patterns and anomalies that might be missed by traditional testing methods. In summary, AI is transforming the market by providing faster test execution, increased accuracy, and a broader scope of test results. Its implementation is essential for organizations to stay competitive in today's fast-paced business environment and ensure the delivery of high-quality software for the elderly and obese populations.

What challenges does Stress Testing Market face during the growth?

Cybersecurity concerns in cloud-based testing environment is a key challenge affecting the market growth.

  • In the realm of technology, ensuring the optimal performance and security of cloud-based services, particularly mobile applications, is of paramount importance. With the global health concern of cardiovascular diseases (CVDs) on the rise, diagnostic procedures are increasingly relying on these services. However, the primary challenge to the widespread adoption of cloud computing is the concern for data privacy and information security. To mitigate these risks, testing services are growing in complexity. Guidelines and IT security regulations demand stringent testing procedures for Software as a Service (SaaS), Infrastructure as a Service (IaaS), and Platform as a Service (PaaS).
  • The increasing frequency of cyber threats and security breaches in cloud-based services necessitates rigorous testing. companies must ensure that cloud infrastructure is tested in various environments using comprehensive tests. These tests should adhere to the latest IT security guidelines to safeguard against potential vulnerabilities. By implementing thorough testing, cloud service providers can instill confidence in their clients and maintain the integrity of their services. This commitment to security is crucial for the continued growth and success of the cloud computing industry.

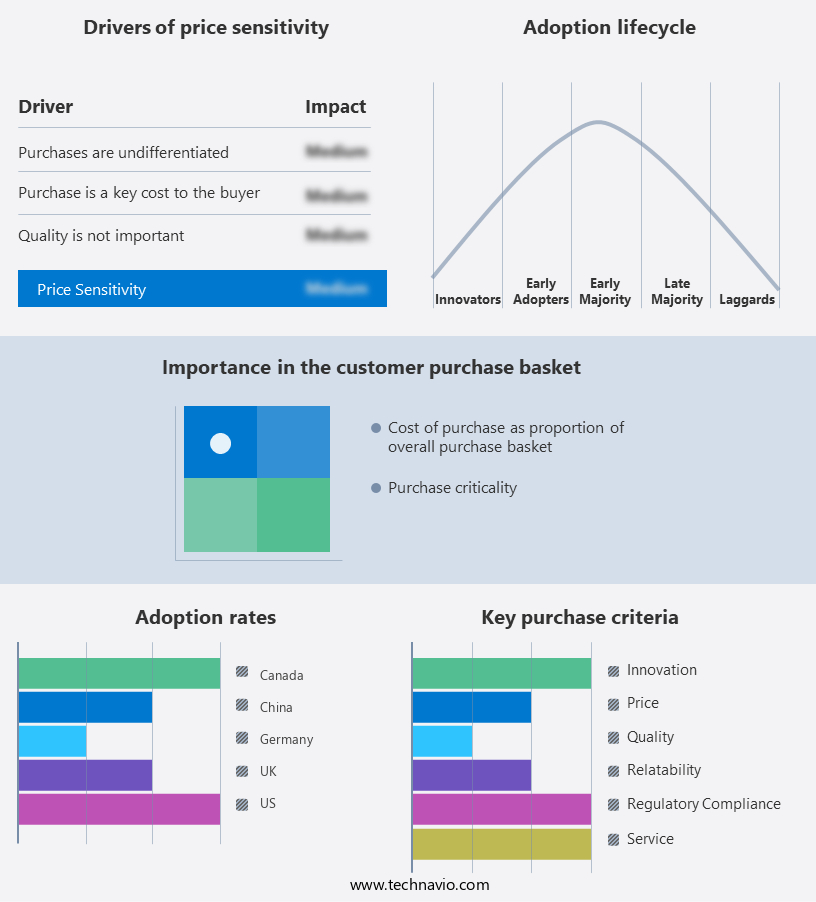
Exclusive Customer Landscape

The market forecasting report includes the adoption lifecycle of the market, covering from the innovator's stage to the laggard's stage. It focuses on adoption rates in different regions based on penetration. Furthermore, the market report also includes key purchase criteria and drivers of price sensitivity to help companies evaluate and develop their market growth analysis strategies.

Stress Testing Market Share by Geography

 Customer Landscape

Key Companies & Market Insights

Companies are implementing various strategies, such as strategic alliances, market forecast , partnerships, mergers and acquisitions, geographical expansion, and product/service launches, to enhance their presence in the market. The market research and growth report includes detailed analyses of the competitive landscape of the market and information about key companies, including:

  • Accenture Plc
  • Akamai Technologies Inc.
  • Capgemini Service SAS
  • Cigniti Technologies Ltd.
  • DIGITAL HEARTS HOLDINGS Co. Ltd.
  • Dotcom Monitor Inc.
  • HCL Technologies Ltd.
  • Infosys Ltd.
  • International Business Machines Corp.
  • Microsoft Corp.
  • Open Text Corp.
  • Oracle Corp.
  • PFLB Inc.
  • RadView Software Ltd.
  • SmartBear Software Inc.
  • Stimulus Technology
  • Tata Consultancy Services Ltd.
  • Wipro Ltd.
  • XB Software
  • Tricentis GmbH

Qualitative and quantitative analysis of companies has been conducted to help clients understand the wider business environment as well as the strengths and weaknesses of key market players. Data is qualitatively analyzed to categorize companies as pure play, category-focused, industry-focused, and diversified; it is quantitatively analyzed to categorize companies as dominant, leading, strong, tentative, and weak.

Research Analyst Overview

The outsourced testing services market is witnessing significant growth due to the increasing demand for application testing, load testing, and cybersecurity concerns in various industries. Small and Medium-sized Enterprises (SMEs) are increasingly outsourcing IT security testing to ensure compliance with IT security guidelines and mitigate information security risks. The banking segment is a major contributor to this market due to the sensitive nature of financial data. In the healthcare sector, the focus on preventive healthcare and proactive health management has led to an increased demand for diagnostic procedures and cardiovascular assessments. With the rise of mobile applications and cloud computing, testing tools are becoming essential for ensuring the security and functionality of these systems.

Further, cybersecurity concerns are not the only stressors for businesses. In the healthcare industry, conditions such as cardiovascular diseases (CVDs), obesity, hypertension, diabetes, dyslipidemia, and heart failure are major global health concerns. Early detection and assessment are crucial for effective management and reducing morbidity and mortality rates, especially in elderly and obese groups. Exercise ECG systems, treadmills, ergometry equipment, and echocardiograms are versatile tools used for physiological stress testing. These tools are used in hospitals & clinics, diagnostic centers, ambulatory surgical centers, and other end-users for patient care. Cardiology departments rely on these tools for cardiovascular assessments and treatments.

Market Scope

Report Coverage

Details

Page number

179

Base year

2023

Historic period

2018-2022

Forecast period

2024-2028

Growth momentum & CAGR

Accelerate at a CAGR of 17.53%

Market growth 2024-2028

USD 4.91 billion

Market structure

Fragmented

YoY growth 2023-2024(%)

15.61

Key countries

US, Canada, China, Germany, and UK

Competitive landscape

Leading Companies, Market Positioning of Companies, Competitive Strategies, and Industry Risks

Request Free Sample

What are the Key Data Covered in this Market Research and Growth Report?

  • CAGR of the market during the forecast period
  • Detailed information on factors that will drive the market growth and forecasting between 2024 and 2028
  • Precise estimation of the size of the market  and its contribution of the market in focus to the parent market
  • Accurate predictions about upcoming market growth and trends and changes in consumer behaviour
  • Growth of the market across North America, Europe, APAC, South America, and Middle East and Africa
  • Thorough analysis of the market's competitive landscape and detailed information about companies
  • Comprehensive analysis of factors that will challenge the growth of market companies

We can help! Our analysts can customize this market research report to meet your requirements. Get in touch

1 Executive Summary

  • 1.1 Market overview
    • Exhibit 01: Executive Summary – Chart on Market Overview
    • Exhibit 02: Executive Summary – Data Table on Market Overview
    • Exhibit 03: Executive Summary – Chart on Global Market Characteristics
    • Exhibit 04: Executive Summary – Chart on Market by Geography
    • Exhibit 05: Executive Summary – Chart on Market Segmentation by End-user
    • Exhibit 06: Executive Summary – Chart on Market Segmentation by Product
    • Exhibit 07: Executive Summary – Chart on Incremental Growth
    • Exhibit 08: Executive Summary – Data Table on Incremental Growth
    • Exhibit 09: Executive Summary – Chart on Vendor Market Positioning

2 Market Landscape

  • 2.1 Market ecosystem
    • Exhibit 10: Parent market
    • Exhibit 11: Market Characteristics

3 Market Sizing

  • 3.1 Market definition
    • Exhibit 12: Offerings of vendors included in the market definition
  • 3.2 Market segment analysis
    • Exhibit 13: Market segments
  • 3.3 Market size 2023
    • 3.4 Market outlook: Forecast for 2023-2028
      • Exhibit 14: Chart on Global - Market size and forecast 2023-2028 ($ million)
      • Exhibit 15: Data Table on Global - Market size and forecast 2023-2028 ($ million)
      • Exhibit 16: Chart on Global Market: Year-over-year growth 2023-2028 (%)
      • Exhibit 17: Data Table on Global Market: Year-over-year growth 2023-2028 (%)

    4 Historic Market Size

    • 4.1 Global stress testing market 2018 - 2022
      • Exhibit 18: Historic Market Size – Data Table on global stress testing market 2018 - 2022 ($ million)
    • 4.2 End-user Segment Analysis 2018 - 2022
      • Exhibit 19: Historic Market Size – End-user Segment 2018 - 2022 ($ million)
    • 4.3 Product Segment Analysis 2018 - 2022
      • Exhibit 20: Historic Market Size – Product Segment 2018 - 2022 ($ million)
    • 4.4 Geography Segment Analysis 2018 - 2022
      • Exhibit 21: Historic Market Size – Geography Segment 2018 - 2022 ($ million)
    • 4.5 Country Segment Analysis 2018 - 2022
      • Exhibit 22: Historic Market Size – Country Segment 2018 - 2022 ($ million)

    5 Five Forces Analysis

    • 5.1 Five forces summary
      • Exhibit 23: Five forces analysis - Comparison between 2023 and 2028
    • 5.2 Bargaining power of buyers
      • Exhibit 24: Chart on Bargaining power of buyers – Impact of key factors 2023 and 2028
    • 5.3 Bargaining power of suppliers
      • Exhibit 25: Bargaining power of suppliers – Impact of key factors in 2023 and 2028
    • 5.4 Threat of new entrants
      • Exhibit 26: Threat of new entrants – Impact of key factors in 2023 and 2028
    • 5.5 Threat of substitutes
      • Exhibit 27: Threat of substitutes – Impact of key factors in 2023 and 2028
    • 5.6 Threat of rivalry
      • Exhibit 28: Threat of rivalry – Impact of key factors in 2023 and 2028
    • 5.7 Market condition
      • Exhibit 29: Chart on Market condition - Five forces 2023 and 2028

    6 Market Segmentation by End-user

    • 6.1 Market segments
      • Exhibit 30: Chart on End-user - Market share 2023-2028 (%)
      • Exhibit 31: Data Table on End-user - Market share 2023-2028 (%)
    • 6.2 Comparison by End-user
      • Exhibit 32: Chart on Comparison by End-user
      • Exhibit 33: Data Table on Comparison by End-user
    • 6.3 Banking - Market size and forecast 2023-2028
      • Exhibit 34: Chart on Banking - Market size and forecast 2023-2028 ($ million)
      • Exhibit 35: Data Table on Banking - Market size and forecast 2023-2028 ($ million)
      • Exhibit 36: Chart on Banking - Year-over-year growth 2023-2028 (%)
      • Exhibit 37: Data Table on Banking - Year-over-year growth 2023-2028 (%)
    • 6.4 Financial services and insurance - Market size and forecast 2023-2028
      • Exhibit 38: Chart on Financial services and insurance - Market size and forecast 2023-2028 ($ million)
      • Exhibit 39: Data Table on Financial services and insurance - Market size and forecast 2023-2028 ($ million)
      • Exhibit 40: Chart on Financial services and insurance - Year-over-year growth 2023-2028 (%)
      • Exhibit 41: Data Table on Financial services and insurance - Year-over-year growth 2023-2028 (%)
    • 6.5 IT and telecom - Market size and forecast 2023-2028
      • Exhibit 42: Chart on IT and telecom - Market size and forecast 2023-2028 ($ million)
      • Exhibit 43: Data Table on IT and telecom - Market size and forecast 2023-2028 ($ million)
      • Exhibit 44: Chart on IT and telecom - Year-over-year growth 2023-2028 (%)
      • Exhibit 45: Data Table on IT and telecom - Year-over-year growth 2023-2028 (%)
    • 6.6 Lifesciences and healthcare - Market size and forecast 2023-2028
      • Exhibit 46: Chart on Lifesciences and healthcare - Market size and forecast 2023-2028 ($ million)
      • Exhibit 47: Data Table on Lifesciences and healthcare - Market size and forecast 2023-2028 ($ million)
      • Exhibit 48: Chart on Lifesciences and healthcare - Year-over-year growth 2023-2028 (%)
      • Exhibit 49: Data Table on Lifesciences and healthcare - Year-over-year growth 2023-2028 (%)
    • 6.7 Others - Market size and forecast 2023-2028
      • Exhibit 50: Chart on Others - Market size and forecast 2023-2028 ($ million)
      • Exhibit 51: Data Table on Others - Market size and forecast 2023-2028 ($ million)
      • Exhibit 52: Chart on Others - Year-over-year growth 2023-2028 (%)
      • Exhibit 53: Data Table on Others - Year-over-year growth 2023-2028 (%)
    • 6.8 Market opportunity by End-user
      • Exhibit 54: Market opportunity by End-user ($ million)
      • Exhibit 55: Data Table on Market opportunity by End-user ($ million)

    7 Market Segmentation by Product

    • 7.1 Market segments
      • Exhibit 56: Chart on Product - Market share 2023-2028 (%)
      • Exhibit 57: Data Table on Product - Market share 2023-2028 (%)
    • 7.2 Comparison by Product
      • Exhibit 58: Chart on Comparison by Product
      • Exhibit 59: Data Table on Comparison by Product
    • 7.3 Application testing - Market size and forecast 2023-2028
      • Exhibit 60: Chart on Application testing - Market size and forecast 2023-2028 ($ million)
      • Exhibit 61: Data Table on Application testing - Market size and forecast 2023-2028 ($ million)
      • Exhibit 62: Chart on Application testing - Year-over-year growth 2023-2028 (%)
      • Exhibit 63: Data Table on Application testing - Year-over-year growth 2023-2028 (%)
    • 7.4 Product testing - Market size and forecast 2023-2028
      • Exhibit 64: Chart on Product testing - Market size and forecast 2023-2028 ($ million)
      • Exhibit 65: Data Table on Product testing - Market size and forecast 2023-2028 ($ million)
      • Exhibit 66: Chart on Product testing - Year-over-year growth 2023-2028 (%)
      • Exhibit 67: Data Table on Product testing - Year-over-year growth 2023-2028 (%)
    • 7.5 Market opportunity by Product
      • Exhibit 68: Market opportunity by Product ($ million)
      • Exhibit 69: Data Table on Market opportunity by Product ($ million)

    8 Customer Landscape

    • 8.1 Customer landscape overview
      • Exhibit 70: Analysis of price sensitivity, lifecycle, customer purchase basket, adoption rates, and purchase criteria

    9 Geographic Landscape

    • 9.1 Geographic segmentation
      • Exhibit 71: Chart on Market share by geography 2023-2028 (%)
      • Exhibit 72: Data Table on Market share by geography 2023-2028 (%)
    • 9.2 Geographic comparison
      • Exhibit 73: Chart on Geographic comparison
      • Exhibit 74: Data Table on Geographic comparison
    • 9.3 North America - Market size and forecast 2023-2028
      • Exhibit 75: Chart on North America - Market size and forecast 2023-2028 ($ million)
      • Exhibit 76: Data Table on North America - Market size and forecast 2023-2028 ($ million)
      • Exhibit 77: Chart on North America - Year-over-year growth 2023-2028 (%)
      • Exhibit 78: Data Table on North America - Year-over-year growth 2023-2028 (%)
    • 9.4 Europe - Market size and forecast 2023-2028
      • Exhibit 79: Chart on Europe - Market size and forecast 2023-2028 ($ million)
      • Exhibit 80: Data Table on Europe - Market size and forecast 2023-2028 ($ million)
      • Exhibit 81: Chart on Europe - Year-over-year growth 2023-2028 (%)
      • Exhibit 82: Data Table on Europe - Year-over-year growth 2023-2028 (%)
    • 9.5 APAC - Market size and forecast 2023-2028
      • Exhibit 83: Chart on APAC - Market size and forecast 2023-2028 ($ million)
      • Exhibit 84: Data Table on APAC - Market size and forecast 2023-2028 ($ million)
      • Exhibit 85: Chart on APAC - Year-over-year growth 2023-2028 (%)
      • Exhibit 86: Data Table on APAC - Year-over-year growth 2023-2028 (%)
    • 9.6 South America - Market size and forecast 2023-2028
      • Exhibit 87: Chart on South America - Market size and forecast 2023-2028 ($ million)
      • Exhibit 88: Data Table on South America - Market size and forecast 2023-2028 ($ million)
      • Exhibit 89: Chart on South America - Year-over-year growth 2023-2028 (%)
      • Exhibit 90: Data Table on South America - Year-over-year growth 2023-2028 (%)
    • 9.7 Middle East and Africa - Market size and forecast 2023-2028
      • Exhibit 91: Chart on Middle East and Africa - Market size and forecast 2023-2028 ($ million)
      • Exhibit 92: Data Table on Middle East and Africa - Market size and forecast 2023-2028 ($ million)
      • Exhibit 93: Chart on Middle East and Africa - Year-over-year growth 2023-2028 (%)
      • Exhibit 94: Data Table on Middle East and Africa - Year-over-year growth 2023-2028 (%)
    • 9.8 US - Market size and forecast 2023-2028
      • Exhibit 95: Chart on US - Market size and forecast 2023-2028 ($ million)
      • Exhibit 96: Data Table on US - Market size and forecast 2023-2028 ($ million)
      • Exhibit 97: Chart on US - Year-over-year growth 2023-2028 (%)
      • Exhibit 98: Data Table on US - Year-over-year growth 2023-2028 (%)
    • 9.9 China - Market size and forecast 2023-2028
      • Exhibit 99: Chart on China - Market size and forecast 2023-2028 ($ million)
      • Exhibit 100: Data Table on China - Market size and forecast 2023-2028 ($ million)
      • Exhibit 101: Chart on China - Year-over-year growth 2023-2028 (%)
      • Exhibit 102: Data Table on China - Year-over-year growth 2023-2028 (%)
    • 9.10 Germany - Market size and forecast 2023-2028
      • Exhibit 103: Chart on Germany - Market size and forecast 2023-2028 ($ million)
      • Exhibit 104: Data Table on Germany - Market size and forecast 2023-2028 ($ million)
      • Exhibit 105: Chart on Germany - Year-over-year growth 2023-2028 (%)
      • Exhibit 106: Data Table on Germany - Year-over-year growth 2023-2028 (%)
    • 9.11 UK - Market size and forecast 2023-2028
      • Exhibit 107: Chart on UK - Market size and forecast 2023-2028 ($ million)
      • Exhibit 108: Data Table on UK - Market size and forecast 2023-2028 ($ million)
      • Exhibit 109: Chart on UK - Year-over-year growth 2023-2028 (%)
      • Exhibit 110: Data Table on UK - Year-over-year growth 2023-2028 (%)
    • 9.12 Canada - Market size and forecast 2023-2028
      • Exhibit 111: Chart on Canada - Market size and forecast 2023-2028 ($ million)
      • Exhibit 112: Data Table on Canada - Market size and forecast 2023-2028 ($ million)
      • Exhibit 113: Chart on Canada - Year-over-year growth 2023-2028 (%)
      • Exhibit 114: Data Table on Canada - Year-over-year growth 2023-2028 (%)
    • 9.13 Market opportunity by geography
      • Exhibit 115: Market opportunity by geography ($ million)
      • Exhibit 116: Data Tables on Market opportunity by geography ($ million)

    10 Drivers, Challenges, and Trends

    • 10.1 Market drivers
      • 10.2 Market challenges
        • 10.3 Impact of drivers and challenges
          • Exhibit 117: Impact of drivers and challenges in 2023 and 2028
        • 10.4 Market trends

          11 Vendor Landscape

          • 11.1 Overview
            • 11.2 Vendor landscape
              • Exhibit 118: Overview on Criticality of inputs and Factors of differentiation
            • 11.3 Landscape disruption
              • Exhibit 119: Overview on factors of disruption
            • 11.4 Industry risks
              • Exhibit 120: Impact of key risks on business

            12 Vendor Analysis

            • 12.1 Vendors covered
              • Exhibit 121: Vendors covered
            • 12.2 Market positioning of vendors
              • Exhibit 122: Matrix on vendor position and classification
            • 12.3 Accenture Plc
              • Exhibit 123: Accenture Plc - Overview
              • Exhibit 124: Accenture Plc - Business segments
              • Exhibit 125: Accenture Plc - Key news
              • Exhibit 126: Accenture Plc - Key offerings
              • Exhibit 127: Accenture Plc - Segment focus
            • 12.4 Akamai Technologies Inc.
              • Exhibit 128: Akamai Technologies Inc. - Overview
              • Exhibit 129: Akamai Technologies Inc. - Business segments
              • Exhibit 130: Akamai Technologies Inc. - Key offerings
              • Exhibit 131: Akamai Technologies Inc. - Segment focus
            • 12.5 Capgemini Service SAS
              • Exhibit 132: Capgemini Service SAS - Overview
              • Exhibit 133: Capgemini Service SAS - Business segments
              • Exhibit 134: Capgemini Service SAS - Key news
              • Exhibit 135: Capgemini Service SAS - Key offerings
              • Exhibit 136: Capgemini Service SAS - Segment focus
            • 12.6 Cigniti Technologies Ltd.
              • Exhibit 137: Cigniti Technologies Ltd. - Overview
              • Exhibit 138: Cigniti Technologies Ltd. - Product / Service
              • Exhibit 139: Cigniti Technologies Ltd. - Key offerings
            • 12.7 DIGITAL HEARTS HOLDINGS Co. Ltd.
              • Exhibit 140: DIGITAL HEARTS HOLDINGS Co. Ltd. - Overview
              • Exhibit 141: DIGITAL HEARTS HOLDINGS Co. Ltd. - Business segments
              • Exhibit 142: DIGITAL HEARTS HOLDINGS Co. Ltd. - Key offerings
              • Exhibit 143: DIGITAL HEARTS HOLDINGS Co. Ltd. - Segment focus
            • 12.8 Dotcom Monitor Inc.
              • Exhibit 144: Dotcom Monitor Inc. - Overview
              • Exhibit 145: Dotcom Monitor Inc. - Product / Service
              • Exhibit 146: Dotcom Monitor Inc. - Key offerings
            • 12.9 HCL Technologies Ltd.
              • Exhibit 147: HCL Technologies Ltd. - Overview
              • Exhibit 148: HCL Technologies Ltd. - Business segments
              • Exhibit 149: HCL Technologies Ltd. - Key news
              • Exhibit 150: HCL Technologies Ltd. - Key offerings
              • Exhibit 151: HCL Technologies Ltd. - Segment focus
            • 12.10 Infosys Ltd.
              • Exhibit 152: Infosys Ltd. - Overview
              • Exhibit 153: Infosys Ltd. - Business segments
              • Exhibit 154: Infosys Ltd. - Key news
              • Exhibit 155: Infosys Ltd. - Key offerings
              • Exhibit 156: Infosys Ltd. - Segment focus
            • 12.11 International Business Machines Corp.
              • Exhibit 157: International Business Machines Corp. - Overview
              • Exhibit 158: International Business Machines Corp. - Business segments
              • Exhibit 159: International Business Machines Corp. - Key news
              • Exhibit 160: International Business Machines Corp. - Key offerings
              • Exhibit 161: International Business Machines Corp. - Segment focus
            • 12.12 Microsoft Corp.
              • Exhibit 162: Microsoft Corp. - Overview
              • Exhibit 163: Microsoft Corp. - Business segments
              • Exhibit 164: Microsoft Corp. - Key news
              • Exhibit 165: Microsoft Corp. - Key offerings
              • Exhibit 166: Microsoft Corp. - Segment focus
            • 12.13 Open Text Corp.
              • Exhibit 167: Open Text Corp. - Overview
              • Exhibit 168: Open Text Corp. - Product / Service
              • Exhibit 169: Open Text Corp. - Key news
              • Exhibit 170: Open Text Corp. - Key offerings
            • 12.14 Oracle Corp.
              • Exhibit 171: Oracle Corp. - Overview
              • Exhibit 172: Oracle Corp. - Business segments
              • Exhibit 173: Oracle Corp. - Key news
              • Exhibit 174: Oracle Corp. - Key offerings
              • Exhibit 175: Oracle Corp. - Segment focus
            • 12.15 PFLB Inc.
              • Exhibit 176: PFLB Inc. - Overview
              • Exhibit 177: PFLB Inc. - Product / Service
              • Exhibit 178: PFLB Inc. - Key offerings
            • 12.16 SmartBear Software Inc.
              • Exhibit 179: SmartBear Software Inc. - Overview
              • Exhibit 180: SmartBear Software Inc. - Product / Service
              • Exhibit 181: SmartBear Software Inc. - Key offerings
            • 12.17 Tricentis GmbH
              • Exhibit 182: Tricentis GmbH - Overview
              • Exhibit 183: Tricentis GmbH - Product / Service
              • Exhibit 184: Tricentis GmbH - Key offerings

            13 Appendix

            • 13.1 Scope of the report
              • 13.2 Inclusions and exclusions checklist
                • Exhibit 185: Inclusions checklist
                • Exhibit 186: Exclusions checklist
              • 13.3 Currency conversion rates for US$
                • Exhibit 187: Currency conversion rates for US$
              • 13.4 Research methodology
                • Exhibit 188: Research methodology
                • Exhibit 189: Validation techniques employed for market sizing
                • Exhibit 190: Information sources
              • 13.5 List of abbreviations
                • Exhibit 191: List of abbreviations

                Research Methodology

                Technavio presents a detailed picture of the market by way of study, synthesis, and summation of data from multiple sources. The analysts have presented the various facets of the market with a particular focus on identifying the key industry influencers. The data thus presented is comprehensive, reliable, and the result of extensive research, both primary and secondary.

                INFORMATION SOURCES

                Primary sources

                • Manufacturers and suppliers
                • Channel partners
                • Industry experts
                • Strategic decision makers

                Secondary sources

                • Industry journals and periodicals
                • Government data
                • Financial reports of key industry players
                • Historical data
                • Press releases

                DATA ANALYSIS

                Data Synthesis

                • Collation of data
                • Estimation of key figures
                • Analysis of derived insights

                Data Validation

                • Triangulation with data models
                • Reference against proprietary databases
                • Corroboration with industry experts

                REPORT WRITING

                Qualitative

                • Market drivers
                • Market challenges
                • Market trends
                • Five forces analysis

                Quantitative

                • Market size and forecast
                • Market segmentation
                • Geographical insights
                • Competitive landscape

                Interested in this report?

                Get your sample now to see our research methodology and insights!

                Download Now

                Frequently Asked Questions

                Stress Testing market growth will increase by $ 4905.42 mn during 2024-2028.

                The Stress Testing market is expected to grow at a CAGR of 17.53% during 2024-2028.

                Stress Testing market is segmented by End-user( Banking, Financial services and insurance, IT and telecom, Lifesciences and healthcare, Others) Product( Application testing, Product testing, APAC, South America, Middle East and Africa)

                Accenture Plc, Akamai Technologies Inc., Capgemini Service SAS, Cigniti Technologies Ltd., DIGITAL HEARTS HOLDINGS Co. Ltd., Dotcom Monitor Inc., HCL Technologies Ltd., Infosys Ltd., International Business Machines Corp., Microsoft Corp., Open Text Corp., Oracle Corp., PFLB Inc., RadView Software Ltd., SmartBear Software Inc., Stimulus Technology, Tata Consultancy Services Ltd., Wipro Ltd., XB Software, Tricentis GmbH are a few of the key vendors in the Stress Testing market.

                North America will register the highest growth rate of 31% among the other regions. Therefore, the Stress Testing market in North America is expected to garner significant business opportunities for the vendors during the forecast period.

                US, Canada, China, Germany, UK

                • Increasing adoption of mobile devices and applicationsMajor drivers of the global stress testing market include the increasing penetration of mobile devices in emerging economies and the volume of customer- and business-centric applications. Smartphone penetration has been increasing in emerging economies such as India is the driving factor this market.
                • Brazil is the driving factor this market.
                • China is the driving factor this market.
                • Indonesia is the driving factor this market.
                • and Argentina. Owing to increasing smartphone penetration is the driving factor this market.
                • companies have moved to the mobile-first strategy and increased investments in mobile application development. For e-commerce and digital payment providers is the driving factor this market.
                • mobile applications are the backbone of businesses. Any breakdown in mobile applications may lead to a considerable loss for companies. For any mobile device is the driving factor this market.
                • the performance of mobile applications is important. As the demand for mobile devices and applications grows is the driving factor this market.
                • the requirement for maintaining quality also increases. With the increasing adoption of digital media on mobile devices is the driving factor this market.
                • there is a significant need for stress testing to enhance the performance and functionality of mobile applications. The lifecycle of mobile applications is shorter than that of web applications. To maintain the performance of mobile applications is the driving factor this market.
                • vendors need to periodically test the applications. Stress testing solutions enable companies to determine the amount of load and stress their business applications can handle. Companies can optimize their website and mobile applications and address any peak loads using these solutions. Moreover is the driving factor this market.
                • companies require a flexible and scalable business application that supports the implementation of IoT and associated solutions. For business continuity is the driving factor this market.
                • it is important to check the threshold capacity of business-critical applications. Stress testing provides insights into web/mobile application performance under extreme or peak load is the driving factor this market.
                • response time is the driving factor this market.
                • and application scalability capabilities. The number of such web/mobile applications is likely to increase for optimizing business productivity and driving sales is the driving factor this market.
                • which is expected to boost the global stress testing global stress testing market during the forecast period. is the driving factor this market.

                The Stress Testing market vendors should focus on grabbing business opportunities from the Banking segment as it accounted for the largest market share in the base year.