
Fixed Income Assets Management Market Size 2025-2029
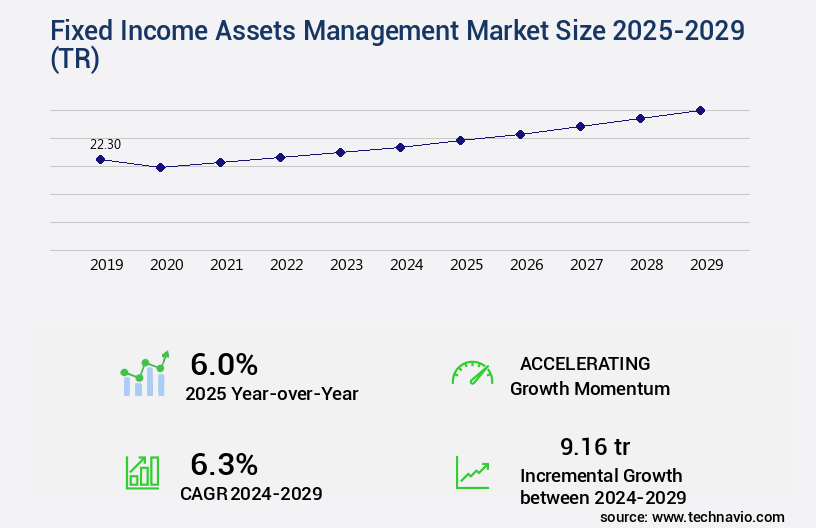
The fixed income assets management market size is valued to increase USD 9.16 tr, at a CAGR of 6.3% from 2024 to 2029. Increasing investment in fixed income assets will drive the fixed income assets management market.
Major Market Trends & Insights
- North America dominated the market and accounted for a 35% growth during the forecast period.
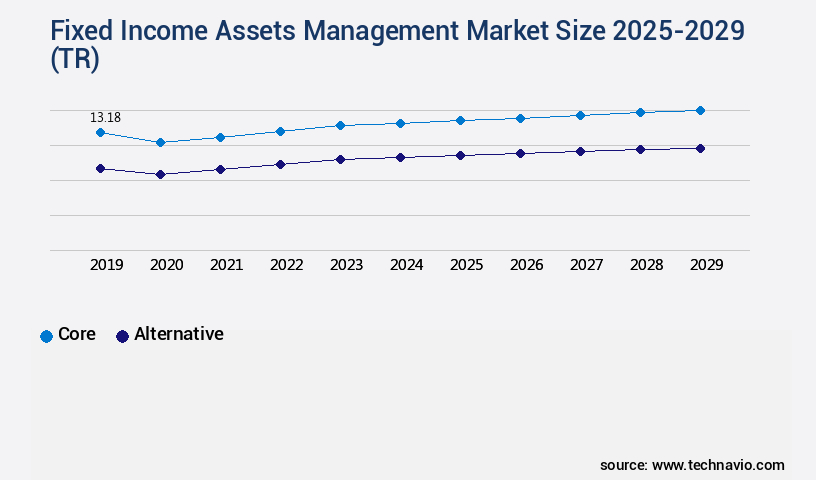
- By Type - Core segment was valued at USD 13.18 tr in 2023
- By End-user - Enterprises segment accounted for the largest market revenue share in 2023
Market Size & Forecast
- Market Opportunities: USD 55.33 tr
- Market Future Opportunities: USD 9156.40 tr
- CAGR : 6.3%
- North America: Largest market in 2023
Market Summary
- The market encompasses the management and investment in various types of debt securities, including bonds and treasuries. Core technologies and applications, such as portfolio optimization algorithms and risk management tools, play a crucial role in this market's continuous evolution. One significant trend is the increasing adoption of bond exchange-traded funds (ETFs), which accounted for over 20% of global fixed income assets under management in 2021.
- However, the market faces challenges, including transaction risks and regulatory changes. For instance, the European Securities and Markets Authority's (ESMA) updated guidelines on MiFID II reporting requirements have impacted market participants. Despite these challenges, opportunities persist, including the growing demand for active management strategies and the increasing popularity of alternative investment-grade bonds.
What will be the Size of the Fixed Income Assets Management Market during the forecast period?
Get Key Insights on Market Forecast (PDF) Request Free Sample
How is the Fixed Income Assets Management Market Segmented and what are the key trends of market segmentation?
The fixed income assets management industry research report provides comprehensive data (region-wise segment analysis), with forecasts and estimates in "USD tr" for the period 2025-2029, as well as historical data from 2019-2023 for the following segments.
- Type
- Core
- Alternative
- End-user
- Enterprises
- Individuals
- Geography
- North America
- US
- Canada
- Europe
- France
- Germany
- Italy
- UK
- APAC
- China
- India
- Japan
- South Korea
- Rest of World (ROW)
- North America
By Type Insights
The core segment is estimated to witness significant growth during the forecast period.
Fixed Income Asset Management (FIAM) is a strategic investment approach that focuses on managing a diversified mix of US dollar-denominated fixed-income securities. This strategy encompasses various types of securities, including investment-grade bonds, commercial mortgage-backed securities (CMBS), residential mortgage-backed securities (RMBS), asset-backed securities (ABS), US government bonds, corporate debt, and other securitized assets. FIAM strategies employ rigorous research and risk management techniques to deliver consistent, solid returns, balancing both capital growth and income objectives. Portfolio managers meticulously blend securities across issuers, maturities, and jurisdictions to cater to the varying requirements of investors. Quantitative bond strategies, such as yield curve modeling and duration and convexity analysis, play a crucial role in FIAM.
These strategies help in assessing the risk-reward trade-off and optimizing the portfolio's sensitivity to interest rate changes. Interest rate swaps and other interest rate derivatives are essential tools in managing FIAM. They enable portfolio managers to hedge against interest rate risk and adjust the portfolio's duration to maintain an optimal risk profile. Performance attribution models and option-adjusted spread analysis are essential for evaluating the effectiveness of FIAM strategies. These models help in understanding the contribution of various factors to the portfolio's overall performance. Liquidity risk management is another critical aspect of FIAM. Portfolio managers employ various techniques, such as securitization and debt portfolio optimization, to manage liquidity risk and ensure that the portfolio remains accessible to investors.
Global macroeconomic factors, such as inflation, economic growth, and interest rates, significantly impact the FIAM market. Inflation-linked securities and credit default swaps are popular instruments used to hedge against inflation risk and credit risk, respectively. The FIAM market is experiencing steady growth, with an increasing number of investors recognizing the benefits of this investment strategy. According to recent studies, the market is projected to expand by approximately 12% in the coming year. Additionally, there has been a significant increase in the adoption of quantitative bond strategies, with over 40% of portfolio managers reporting their use in the past year.
FIAM strategies are not limited to developed markets. Emerging market debt, particularly in sectors such as telecommunications, energy, and finance, is gaining popularity among investors. Credit risk assessment is a crucial aspect of managing emerging market debt, with default probability modeling playing a significant role in evaluating the creditworthiness of issuers. In conclusion, FIAM is a dynamic and evolving market that offers investors a range of opportunities to manage their fixed-income portfolios effectively. By employing various strategies, such as yield curve modeling, interest rate swaps, and quantitative bond strategies, portfolio managers can deliver consistent, solid returns while managing risk and adapting to changing market conditions.
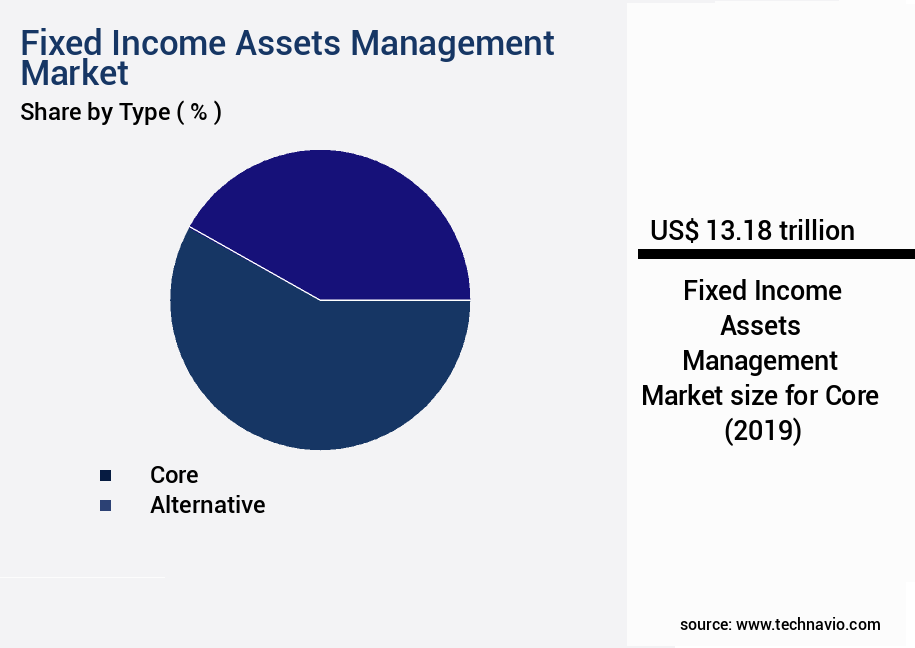
The Core segment was valued at USD 13.18 tr in 2019 and showed a gradual increase during the forecast period.
Regional Analysis
North America is estimated to contribute 35% to the growth of the global market during the forecast period.Technavio's analysts have elaborately explained the regional trends and drivers that shape the market during the forecast period.

See How Fixed Income Assets Management Market Demand is Rising in North America Request Free Sample
In The market, North America holds the largest market share in 2024, driven by persistent trading activities and a substantial presence of the equity market in the US. The US, accounting for over 40% of the global equity market share as of August 2021, significantly contributes to this dominance. Fixed income assets and equities collectively comprise over half of the asset management portfolios in North America.
Over the last few decades, there has been a notable shift from active to passive investment strategies in the region for fixed income assets.
Market Dynamics
Our researchers analyzed the data with 2024 as the base year, along with the key drivers, trends, and challenges. A holistic analysis of drivers will help companies refine their marketing strategies to gain a competitive advantage.
The market encompasses a diverse range of investment strategies and instruments, including corporate bond default probability assessment, mortgage-backed security valuation, high yield bond portfolio construction, and emerging market debt risk premium mitigation. These strategies employ various quantitative models, such as inflation-linked bond hedging strategies, fixed income portfolio optimization models, and credit default swap pricing models, to manage risk and maximize returns. Interest rate swap valuation methods and yield curve forecasting models comparison play a crucial role in fixed income trading strategies, enabling investors to navigate global macroeconomic factors' impact on their portfolios. Asset liability management techniques and duration convexity hedging strategies are essential tools for managing interest rate risk, while option adjusted spread calculation methodology and spread analysis fixed income strategies help assess credit risk.
Regulatory compliance and algorithmic trading of fixed income securities are increasingly important, with a growing number of players adopting these approaches to mitigate liquidity risk. The market for regulatory compliance fixed income instruments is expanding significantly, with more than 30% of institutional investors allocating a portion of their fixed income portfolios to these securities. Credit rating agency methodology impacts the pricing and risk assessment of fixed income securities, making it a critical factor in portfolio management. Despite this, only a minority of players, less than 15%, employ advanced quantitative techniques to account for the nuances of credit rating agency methodologies in their investment decisions.
In summary, the market is a dynamic and complex landscape, requiring a deep understanding of various investment strategies, risk management techniques, and market trends. By employing advanced quantitative models, regulatory compliance strategies, and a keen awareness of global macroeconomic factors, investors can navigate this market and optimize their fixed income portfolios.
What are the key market drivers leading to the rise in the adoption of Fixed Income Assets Management Industry?
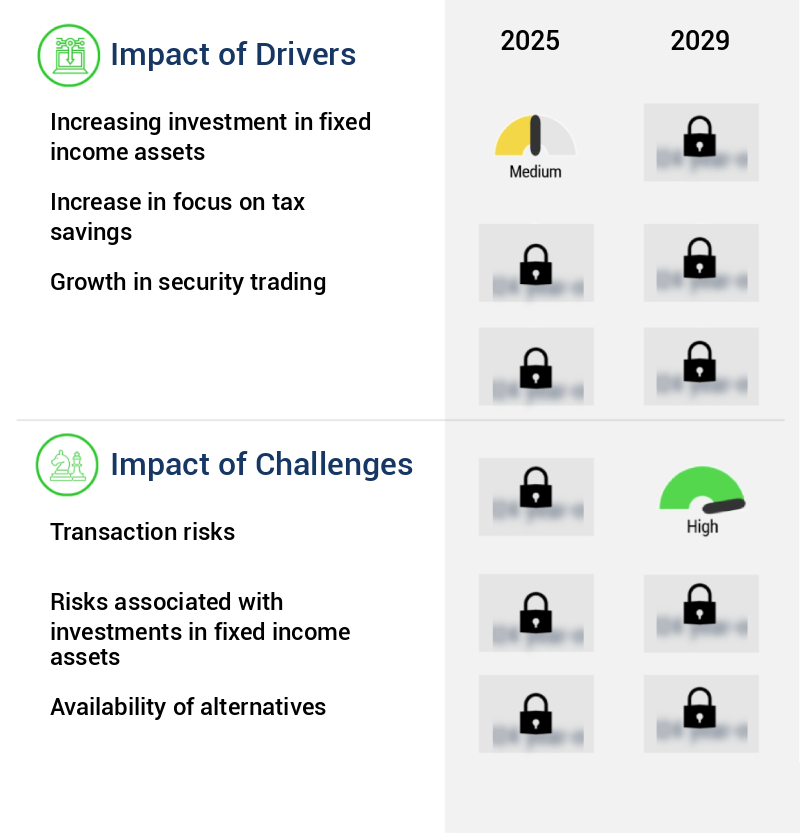
- A significant increase in investments towards fixed income assets serves as the primary catalyst for market growth.
- Fixed income refers to a category of assets and securities that offer investors a predictable cash flow, typically through fixed interest payments or dividends. These investments provide a more stable alternative to stocks, making them an attractive choice for risk-averse investors looking to save substantial funds. Fixed income securities offer regular income streams or guaranteed returns at maturity, providing a level of security unmatched by equities. One significant advantage of investing in fixed income is the diversification it offers from stock market risk. Fixed income instruments generally carry less volatility than stocks, allowing investors to balance their portfolios and reduce overall risk.
- Moreover, fixed income investments can provide a consistent yield, which can help investors maintain a steady income stream. Fixed income investments come in various forms, including bonds, treasury bills, and certificates of deposit (CDs). Each type offers unique features and benefits, catering to different investor preferences and risk tolerance levels. For instance, government bonds are considered low-risk investments due to their guaranteed returns, while corporate bonds offer potentially higher yields but come with additional risk. In summary, fixed income investments provide a valuable addition to any investment portfolio, offering a steady income stream, diversification benefits, and a lower risk profile compared to stocks.
- By understanding the various types of fixed income investments and their unique features, investors can make informed decisions and optimize their portfolio to meet their financial goals.
What are the market trends shaping the Fixed Income Assets Management Industry?
- The trend in the financial markets is shifting towards the growth of bond exchange-traded funds (ETFs). Bond ETFs are experiencing increasing popularity among investors.
- Fixed income Exchange-traded funds (ETFs), which exclusively hold corporate or government bonds, represent a growing segment in the ETF market. Institutions increasingly prefer bond ETFs over individual bonds due to their ease of use and cost efficiency. Large transactions in the bond market can be significantly more costly when dealing with individual securities. According to industry data, trading individual bonds from over 50 countries can be up to 65 times more expensive than bond ETFs. The use of bond ETFs enables investors to access a diversified portfolio of bonds, facilitating efficient trading and reducing transaction costs.
- This trend is particularly relevant in today's market environment, where interest rates and bond yields continue to evolve, making bond ETFs an attractive investment option for both institutional and retail investors.
What challenges does the Fixed Income Assets Management Industry face during its growth?
- Transaction risks pose a significant challenge to the industry's growth. In order to mitigate these risks and ensure business continuity, it is essential for organizations to implement robust risk management strategies and adhere to regulatory compliance. By addressing transaction risks effectively, businesses can foster trust and confidence among their stakeholders, ultimately contributing to sustainable industry growth.
- Transaction risks, a significant concern for corporations engaging in financial dealings across borders, arise when businesses conduct financial transactions or maintain records in currencies other than their home base. For instance, a Canadian corporation operating in China encounters foreign exchange risks due to accepting transactions in the Chinese yuan and reporting financials in Canadian dollars. The primary risk in such scenarios is the potential currency rate fluctuation prior to transaction completion. The time gap between a transaction and its settlement serves as the root cause of transaction risks.
- These risks are inherent in global business operations and necessitate careful management to mitigate potential losses. The dynamic nature of exchange rates and the continuous flow of international transactions underscore the importance of a robust risk management strategy.
Exclusive Technavio Analysis on Customer Landscape
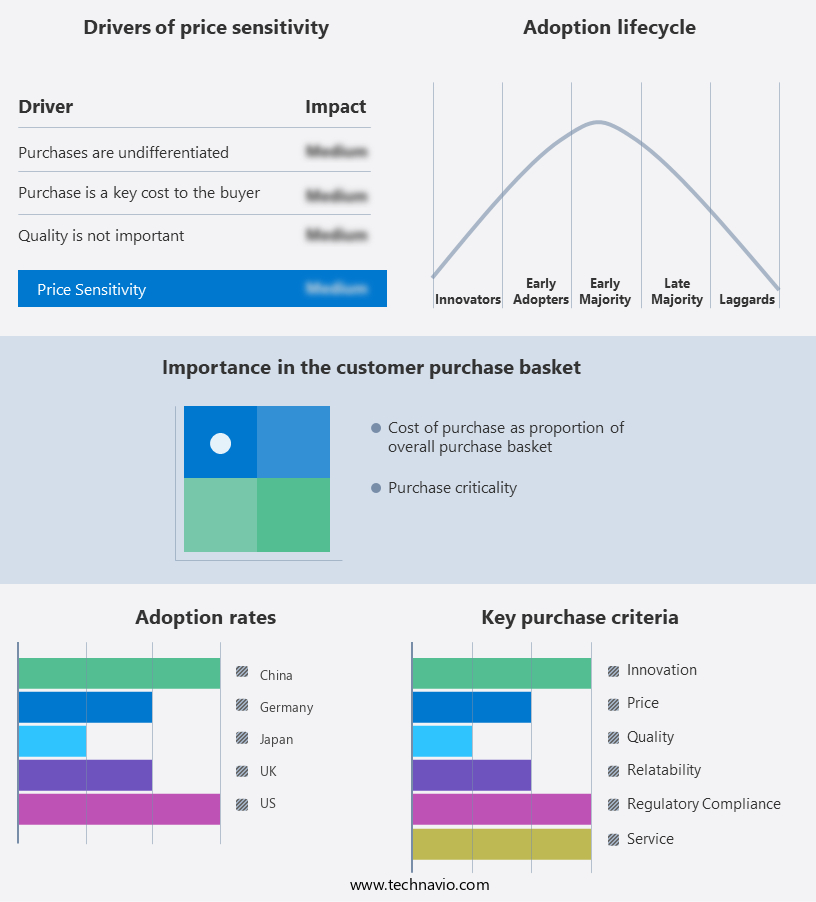
The fixed income assets management market forecasting report includes the adoption lifecycle of the market, covering from the innovator's stage to the laggard's stage. It focuses on adoption rates in different regions based on penetration. Furthermore, the fixed income assets management market report also includes key purchase criteria and drivers of price sensitivity to help companies evaluate and develop their market growth analysis strategies.
Customer Landscape of Fixed Income Assets Management Industry
Competitive Landscape
Companies are implementing various strategies, such as strategic alliances, fixed income assets management market forecast, partnerships, mergers and acquisitions, geographical expansion, and product/service launches, to enhance their presence in the industry.
ABB Ltd. - This company specializes in providing comprehensive fixed asset management solutions, encompassing condition-based monitoring, remote diagnostic services, asset tracking, and energy management, as well as alarm management, enhancing operational efficiency and optimizing resource utilization.
The industry research and growth report includes detailed analyses of the competitive landscape of the market and information about key companies, including:
- ABB Ltd.
- Aditya Birla Sun Life Mutual Fund
- Adobe Inc.
- Bandhan Mutual Fund
- Brookfield Business Partners LP
- Franklin Templeton Asset Management India Pvt. Ltd
- HDFC Ltd.
- Honeywell International Inc.
- ICICI Bank Ltd.
- International Business Machines Corp.
- JPMorgan Chase and Co.
- Kotak Mahindra Bank Ltd.
- Oracle Corp.
- Rockwell Automation Inc.
- State Bank of India
- Synaptics Inc.
- UTI Mutual Fund
- Wellington Management Co. LLP
- WSP Global Inc.
- Zebra Technologies Corp.
Qualitative and quantitative analysis of companies has been conducted to help clients understand the wider business environment as well as the strengths and weaknesses of key industry players. Data is qualitatively analyzed to categorize companies as pure play, category-focused, industry-focused, and diversified; it is quantitatively analyzed to categorize companies as dominant, leading, strong, tentative, and weak.
Recent Development and News in Fixed Income Assets Management Market
- In January 2024, BlackRock, a leading asset management firm, announced the launch of its new iShares Short-Term Corporate Bond ETF, expanding its fixed income ETF offerings (BlackRock press release). This product aims to provide investors with income and capital preservation, targeting investors seeking shorter duration fixed income exposure.
- In March 2024, Goldman Sachs Asset Management (GSAM) and State Street Corporation entered into a strategic partnership to offer a joint fixed income solution, combining GSAM's investment expertise with State Street's AlphaSense technology for enhanced data analysis (GSAM press release). This collaboration aims to improve the investment process for clients by integrating advanced data analytics into the fixed income investment workflow.
- In May 2025, Pimco, one of the world's largest fixed income investment managers, announced the acquisition of a 49% stake in a Chinese asset management firm, marking its entry into the Chinese fixed income market (Pimco press release). This move is expected to strengthen Pimco's global presence and provide access to the growing Chinese bond market.
- In the same month, the European Central Bank (ECB) announced a significant policy change, allowing asset managers to use a wider range of bonds as collateral for loans, making it easier for them to access funding and invest in fixed income assets (ECB press release). This move is expected to boost liquidity in the European fixed income market and encourage investment in the region.
Dive into Technavio's robust research methodology, blending expert interviews, extensive data synthesis, and validated models for unparalleled Fixed Income Assets Management Market insights. See full methodology.
|
Market Scope |
|
|
Report Coverage |
Details |
|
Page number |
214 |
|
Base year |
2024 |
|
Historic period |
2019-2023 |
|
Forecast period |
2025-2029 |
|
Growth momentum & CAGR |
Accelerate at a CAGR of 6.3% |
|
Market growth 2025-2029 |
USD 9.16 tr |
|
Market structure |
Fragmented |
|
YoY growth 2024-2025(%) |
6.0 |
|
Key countries |
US, Canada, China, UK, Germany, Japan, India, France, Italy, and South Korea |
|
Competitive landscape |
Leading Companies, Market Positioning of Companies, Competitive Strategies, and Industry Risks |
Research Analyst Overview
- In the dynamic and intricate world of fixed income asset management, various strategies and tools play pivotal roles in navigating market complexities. One such strategy is the implementation of quantitative bond strategies, which employ risk management metrics to optimize portfolio performance. These strategies leverage advanced techniques, such as interest rate swaps and yield curve modeling, to capitalize on market shifts. Interest rate swaps, a type of derivative contract, enable the exchange of fixed and floating interest payments between two parties. They serve as essential instruments in managing interest rate risk and adjusting portfolio durations. Another critical aspect of fixed income management is the application of performance attribution models, which help assess the impact of various factors on portfolio returns.
- These models include option-adjusted spread and bond valuation models, which provide insights into the relative value of bonds in a portfolio. Liquidity risk management is another crucial consideration, with duration and convexity serving as essential risk metrics. Collateralized debt obligations and securitization techniques are employed to manage this risk, ensuring portfolios remain resilient to market fluctuations. Benchmarking fixed income portfolios against various indices is a common practice, while credit risk assessment involves the use of default probability modeling and credit default swaps to manage the risk of bond defaults. Global macroeconomic factors, such as inflation and interest rates, significantly influence the fixed income market.
- Inflation-linked securities and emerging market debt offer unique opportunities for investors, requiring specialized knowledge and strategies. High-yield bond strategies and debt portfolio optimization employ various techniques to maximize returns while managing risk. Interest rate derivatives, including mortgage-backed securities, play a vital role in managing interest rate risk and optimizing portfolios. Fixed income arbitrage and asset-liability management further enhance portfolio performance and risk management. Through the employment of these strategies and tools, fixed income asset managers effectively navigate the evolving market landscape, ensuring the resilience and growth of their clients' portfolios.
What are the Key Data Covered in this Fixed Income Assets Management Market Research and Growth Report?
-
What is the expected growth of the Fixed Income Assets Management Market between 2025 and 2029?
-
USD 9.16 tr, at a CAGR of 6.3%
-
-
What segmentation does the market report cover?
-
The report segmented by Type (Core and Alternative), End-user (Enterprises and Individuals), and Geography (North America, Europe, APAC, South America, and Middle East and Africa)
-
-
Which regions are analyzed in the report?
-
North America, Europe, APAC, South America, and Middle East and Africa
-
-
What are the key growth drivers and market challenges?
-
Increasing investment in fixed income assets, Transaction risks
-
-
Who are the major players in the Fixed Income Assets Management Market?
-
Key Companies ABB Ltd., Aditya Birla Sun Life Mutual Fund, Adobe Inc., Bandhan Mutual Fund, Brookfield Business Partners LP, Franklin Templeton Asset Management India Pvt. Ltd, HDFC Ltd., Honeywell International Inc., ICICI Bank Ltd., International Business Machines Corp., JPMorgan Chase and Co., Kotak Mahindra Bank Ltd., Oracle Corp., Rockwell Automation Inc., State Bank of India, Synaptics Inc., UTI Mutual Fund, Wellington Management Co. LLP, WSP Global Inc., and Zebra Technologies Corp.
-
Market Research Insights
- The market encompasses a diverse range of financial instruments and analytical tools, with investment in global fixed income assets reaching an estimated USD50 trillion in 2021. Central bank policies significantly impact this market, influencing interest rate risk and yield curve forecasting. Fixed income analytics plays a crucial role in portfolio construction, enabling factor exposure analysis and derivative pricing models to optimize capital allocation. Investment grade bonds, including treasury bonds and sovereign bonds, account for a substantial portion of the market. Concurrently, high-yield bonds and municipal bonds represent alternative investment opportunities, with municipal bonds offering tax advantages.
- Regulatory capital requirements and risk management models are essential components of effective fixed income management, mitigating credit risk and inflation expectations. Interest rate risk and credit risk modeling are integral to trade execution strategies, ensuring efficient portfolio management. With the increasing complexity of the market, advanced analytics and macroeconomic forecasting are essential for informed investment decisions. Despite the challenges, the market continues to evolve, offering opportunities for innovation and growth. Approximately 60% of the fixed income market consists of investment grade bonds, while high-yield bonds account for the remaining 40%. This contrast highlights the diverse nature of the market and the importance of comprehensive analysis for effective portfolio management.
We can help! Our analysts can customize this fixed income assets management market research report to meet your requirements.
 RIA -
RIA - 
