Floor Cleaning Machines Market Size 2025-2029
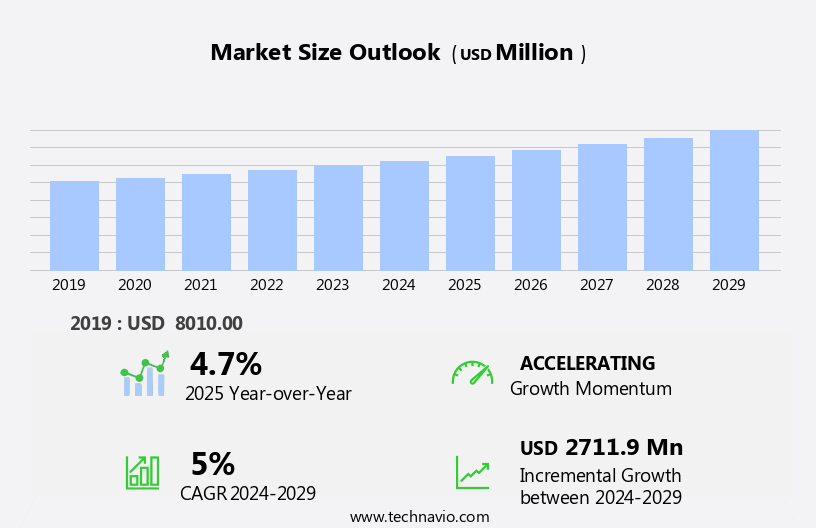
The floor cleaning machines market size is forecast to increase by USD 2.71 billion at a CAGR of 5% between 2024 and 2029.
- The market exhibits robust growth, driven by increasing demand from janitorial cleaning services. This trend is further fueled by continuous investments in research and development, leading to the launch of advanced, efficient, and cost-effective floor cleaning solutions. However, regulatory hurdles impact adoption, as stringent safety and environmental regulations necessitate significant investments in compliance. Moreover, the availability of low-cost manual labor in developing countries tempers growth potential, as some businesses opt for labor-intensive methods over automated solutions. Despite these challenges, opportunities abound for market participants. Companies can capitalize on the growing demand by offering innovative, cost-effective, and eco-friendly floor cleaning machines that cater to both large commercial establishments and small businesses. Moreover, the availability of advanced cleaning solutions and the increasing use of robotic floor scrubbers for cleaning various floor types, such as wood, ceramic, concrete, and others, is further fueling market growth.
- Additionally, strategic partnerships, collaborations, and mergers and acquisitions can help companies expand their reach and strengthen their market position. The market is poised for growth, with key drivers including rising demand from the janitorial sector and ongoing R&D investments. Construction sites and other heavy-duty applications are also adopting robotic floor scrubbers due to their ability to operate in harsh environments and long run times, often powered by batteries. Companies must navigate regulatory challenges and competition from low-cost labor markets to capitalize on this opportunity.
What will be the Size of the Floor Cleaning Machines Market during the forecast period?
- The market encompasses a range of equipment designed for maintaining the hygiene and aesthetics of various flooring types in both residential and commercial settings. The market is witnessing significant advancements driven by the adoption of cleaning process automation and smart cleaning solutions. Performance tracking and cleaning resource management are key trends, enabling businesses to optimize cleaning schedules and allocate resources efficiently. Sustainable cleaning practices, including green cleaning and the use of eco-friendly cleaning agents, are gaining popularity due to their environmental benefits. Floor gloss and aesthetics are essential considerations for businesses, leading to the adoption of floor life extension technologies and microfiber technology. Cleaning certifications ensure compliance with cleaning standards and contribute to improved air quality and allergen control. Deep cleaning and virus control are crucial in maintaining a healthy environment, driving the demand for advanced cleaning technologies such as UV disinfection and anti-microbial technology. Additionally, the increasing focus on waste management and sustainability is driving innovation in flooring materials, with companies exploring alternatives to traditional non-resilient flooring such as ceramic tiles and wooden floors.
- Floor damage prevention and dust control are also important factors, with waterless cleaning and steam cleaning offering effective solutions. Remote monitoring and predictive maintenance enable proactive cleaning and reduce cleaning costs. Flooring types, such as hardwood, tile, and carpet, require different cleaning methods, leading to the availability of various floor cleaning technologies, including electrostatic cleaning and dry cleaning. Bacteria control and floor slip resistance are essential for maintaining a safe working environment. Floor mapping and cleaning logs facilitate effective cleaning audits and help ensure consistent cleaning quality. Overall, the market is dynamic, with continuous innovation and advancements in cleaning technologies to meet the evolving needs of businesses.
How is this Floor Cleaning Machines Industry segmented?
The floor cleaning machines industry research report provides comprehensive data (region-wise segment analysis), with forecasts and estimates in "USD million" for the period 2025-2029, as well as historical data from 2019-2023 for the following segments.
- Application
- Professional cleaning equipment
- Consumer cleaning equipment
- Product
- Floor scrubbers
- Vacuum cleaners
- Floor sweepers
- Others
- End-user
- Commercial
- Industrial
- Residential
- Geography
- North America
- US
- Canada
- Europe
- France
- Germany
- Italy
- The Netherlands
- UK
- APAC
- China
- India
- Japan
- Rest of World (ROW)
- North America
By Application Insights
The professional cleaning equipment segment is estimated to witness significant growth during the forecast period. The professional market encompasses a wide range of equipment used in commercial and industrial settings, including high-pressure cleaners, vacuum cleaners, carpet extractors, floor scrubbers, and more. These machines cater to various industries, such as healthcare facilities, retail stores, office buildings, and educational institutions, among others. Energy efficiency and noise reduction are key considerations in the market, with many manufacturers integrating IoT technology and data analytics to optimize cleaning productivity and efficiency. Filtration systems are essential for maintaining hygiene regulations and ensuring effective cleaning solutions. Water usage is another critical factor, with water recovery systems and smart cleaning technologies gaining popularity to minimize water consumption.
These machines utilize water, cleaning solutions, and scrubbing mechanisms to remove stains, dirt, and grime from various flooring materials, including wood, ceramic, stone, and concrete. Floor protection and surface preparation are also important aspects of the market, with floor sealing, floor coating, and robotic floor cleaning offering solutions for hard floor cleaning. Safety features, such as operator safety and automatic scrubbers, are also prioritized to ensure optimal performance and reduce labor costs. The non-residential sector, particularly the office, healthcare, and hotel sectors, is expected to drive market growth due to the increasing demand for commercial cleaning services. Cleaning procedures, cleaning protocols, and cleaning frequency are essential factors influencing the market dynamics. Maintenance services and rental programs are also gaining traction to provide cost-effective solutions for businesses. Battery technology and cleaning time are other significant considerations, with advancements in these areas expected to further enhance the market's growth.
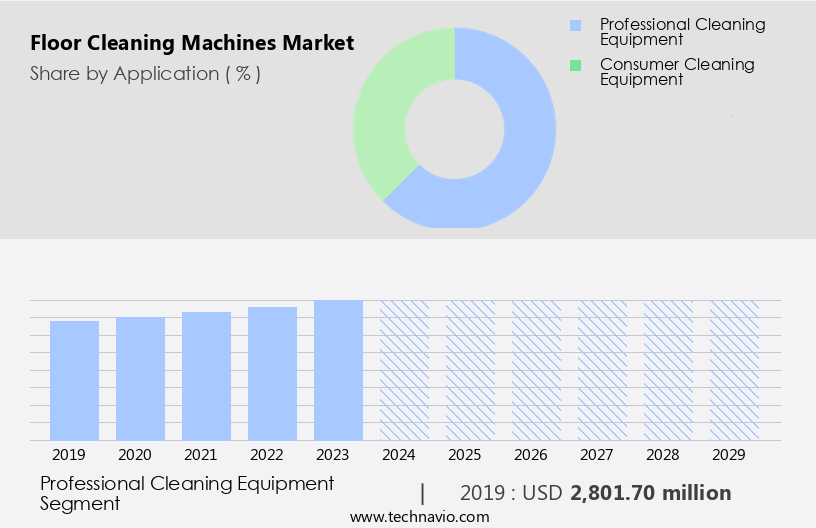
The Professional cleaning equipment segment was valued at USD billion in 2019 and showed a gradual increase during the forecast period.
Regional Analysis
North America is estimated to contribute 44% to the growth of the global market during the forecast period. Technavio's analysts have elaborately explained the regional trends and drivers that shape the market during the forecast period.

The market in the US and Canada is experiencing significant growth due to the construction of new residential and non-residential buildings in the region. In the US, the increasing number of new housing starts is driving the demand for floor cleaning machines in the residential sector. Meanwhile, in Canada, the Investing in Canada Plan, which aims to invest USD139 billion in key infrastructure sectors by 2028, is expected to boost the non-residential infrastructure development and, consequently, the demand for floor cleaning machines. Floor protection and filtration systems are essential features in floor cleaning machines, particularly in commercial and healthcare facilities. The commercial growth and urbanization in the region, along with hygiene awareness and sanitation needs in sectors like healthcare, hospitality, and construction, further fuel the demand for floor cleaning machines.
Energy efficiency and water usage are critical considerations for commercial cleaning companies, leading to the increasing popularity of energy-efficient machines and water recovery systems. Noise reduction and traffic patterns are also important factors, making vacuum cleaners and automatic scrubbers popular choices for office buildings. Floor sealing, floor coating, and surface preparation are crucial for maintaining the longevity of floors, leading to the growing demand for floor care solutions. Training programs and rental services offer flexibility and affordability for cleaning companies. Hard floor cleaning, cleaning productivity, and cleaning protocols are essential for maintaining cleanliness and infection control in various industries, including retail stores, education institutions, and industrial cleaning.
Emerging trends include smart cleaning technologies, IoT integration, data analytics, and autonomous cleaning, which offer increased cleaning efficiency and productivity. Safety features, such as operator safety, are becoming increasingly important in floor cleaning machines. High-pressure cleaning and chemical usage are essential for heavy-duty industrial cleaning, while cleaning procedures and cleaning frequency are critical factors in maintaining cleanliness in various industries. Battery technology and maintenance services are essential considerations for cleaning companies to ensure cleaning productivity and minimize downtime. Cleaning time and surface area are essential factors in choosing the right floor cleaning machine for different applications.
Floor type, cleaning standards, and cleaning efficiency are also important considerations for cleaning companies and facility managers.
Market Dynamics
Our researchers analyzed the data with 2024 as the base year, along with the key drivers, trends, and challenges. A holistic analysis of drivers will help companies refine their marketing strategies to gain a competitive advantage.
What are the Floor Cleaning Machines market drivers leading to the rise in the adoption of Industry?
- Janitorial cleaning services hold significant demand and serve as the primary driver in the market's growth. The market is experiencing significant growth due to the increasing demand from the janitorial services sector. Janitorial services are a significant segment of the cleaning industry, offering interior and exterior building cleaning, as well as cleaning for transportation modes such as aircraft, cars, rail, and ships. These services cater to various industries, including offices, educational institutions, retail complexes, factories, and government and business establishments. The demand for floor cleaning machines in this sector is driven by the need for effective and efficient cleaning solutions. Floor protection, filtration systems, carpet extractors, water usage, noise reduction, traffic patterns, vacuum cleaners, floor sealing, commercial cleaning, floor coating, soft floor cleaning, smart cleaning, and various cleaning solutions are all essential features that janitorial services seek in floor cleaning machines.
- As the demand for cleaner environments continues to rise, particularly in healthcare facilities, the market for floor cleaning machines is expected to grow further. Companies in the janitorial services sector are investing in advanced floor cleaning technology to meet the evolving needs of their clients and stay competitive in the market. The market is poised for growth due to the increasing demand from the janitorial services sector. The need for advanced features such as floor protection, filtration systems, and noise reduction is driving the market, and the trend towards smart cleaning solutions and energy efficiency is expected to further fuel growth.
What are the Floor Cleaning Machines market trends shaping the Industry?
- One significant market trend emerging in the business landscape is the increasing investment in research and development. This commitment to innovation is a crucial strategy for companies seeking to stay competitive and advance their industries. The market is experiencing significant investment from companies in research and development, driving innovation in the industry. Advanced applications and solutions, such as room memory technology, extended battery life, and enhanced cleaning efficiency, are becoming increasingly important. To reduce maintenance and upgrade costs, companies are focusing on developing floor scrubbers with cutting-edge technology. The market is undergoing rapid technological changes and shifting consumer preferences, necessitating the delivery of efficient and innovative floor cleaning solutions. As a result, the market is expected to witness the development of advanced floor scrubbers, which will fuel the growth of the market during the forecast period.
- Energy efficiency, rental programs, training programs, and IoT integration are key trends shaping the market. Industrial and retail applications, as well as residential and floor restoration sectors, are subject to stringent hygiene regulations, further emphasizing the importance of cleaning productivity and efficiency. Labor costs remain a significant concern for businesses, making the adoption of energy-efficient and cost-effective floor cleaning machines a priority. Companies are also focusing on cleaning protocols to ensure the highest level of cleanliness and customer satisfaction.
How does Floor Cleaning Machines market faces challenges face during its growth?
- The availability of abundant, low-cost manual labor in developing countries poses a significant challenge to the expansion and growth of industries in this globalized economy. The global floor care market faces a significant challenge due to the availability of low-cost labor in certain regions, particularly in developing countries like India and China. In these countries, the preference for domestic servants over automated floor cleaning equipment is prevalent, as the labor is easily accessible and allows for customized cleaning processes. The informal economy, which constitutes a substantial portion of the labor force in many developing countries in the Asia Pacific region, further contributes to the limited demand for floor cleaning machines. Overall, the informal sector accounts for over 60% of the workforce in these countries. However, advancements in technology such as data analytics, autonomous cleaning, and cloud-based management systems are expected to influence the market dynamics.
- Safety features, high-pressure cleaning, and surface preparation techniques are also gaining popularity in the floor care industry. Cleaning chemicals and floor polishers continue to be essential components of the market, with ongoing research and development efforts focused on reducing chemical usage and improving sustainability.
Exclusive Customer Landscape
The floor cleaning machines market forecasting report includes the adoption lifecycle of the market, covering from the innovator's stage to the laggard's stage. It focuses on adoption rates in different regions based on penetration. Furthermore, the floor cleaning machines market report also includes key purchase criteria and drivers of price sensitivity to help companies evaluate and develop their market growth analysis strategies.

Customer Landscape
Key Companies & Market Insights
Companies are implementing various strategies, such as strategic alliances, floor cleaning machines market forecast, partnerships, mergers and acquisitions, geographical expansion, and product/service launches, to enhance their presence in the industry.
Alfred Karcher SE and Co. KG - The company offers floor cleaning machines such as a steam vacuum cleaner.
The industry research and growth report includes detailed analyses of the competitive landscape of the market and information about key companies, including:
- Alfred Karcher SE and Co. KG
- Aman Cleaning Equipments Pvt. Ltd.
- Astol Cleantech Pvt. Ltd.
- Bortek Industries Inc.
- Clemas and Co. Ltd.
- Eureka SpA
- Fimap Spa
- Hako GmbH
- ICE Cobotics
- Makita Corp.
- Nilfisk AS
- NSS Enterprises Inc.
- Numatic International Ltd.
- Roots Multiclean Ltd.
- Santoni Electric Co. Pvt. Ltd.
- SGT Multiclean Equipments
- Techtronic Industries Co. Ltd.
- Tennant Co.
- Tornado Industries Inc.
- WIESE USA
Qualitative and quantitative analysis of companies has been conducted to help clients understand the wider business environment as well as the strengths and weaknesses of key industry players. Data is qualitatively analyzed to categorize companies as pure play, category-focused, industry-focused, and diversified; it is quantitatively analyzed to categorize companies as dominant, leading, strong, tentative, and weak.
Recent Development and News in Floor Cleaning Machines Market
- In February 2023, iRobot, a leading home robots company, introduced the Braava Jet M6, an advanced floor cleaning robot that combines mopping and sweeping capabilities (iRobot Press Release). This innovative product launch caters to the growing demand for smart home solutions that automate floor cleaning tasks.
- In October 2024, Karcher, a German manufacturing company, announced a strategic partnership with Amazon to sell its floor cleaning machines directly on Amazon's platform (Karcher Press Release). This collaboration aims to expand Karcher's reach and increase online sales, catering to the growing e-commerce trend in the market.
- In March 2025, Nilfisk, a Danish manufacturer of industrial and professional cleaning equipment, acquired Numatic International, a UK-based manufacturer of industrial vacuum cleaners and floor cleaning machines (Nilfisk Press Release). This acquisition strengthens Nilfisk's position in the industrial and professional cleaning market, providing a broader product portfolio and enhanced geographic reach.
Research Analyst Overview
The market continues to evolve, driven by the diverse needs of various sectors and the ongoing pursuit of energy efficiency, productivity, and innovation. From carpet extractors to hard floor cleaning solutions, floor care technologies are constantly advancing to meet the demands of commercial and industrial applications. Energy efficiency is a key consideration, with rental programs and training initiatives helping businesses optimize their use of resources. Filtration systems and water usage are critical areas of focus, as are noise reduction and traffic patterns, which impact both productivity and the user experience. Hard floor cleaning solutions, including floor sealing and polishing, are increasingly popular in retail stores and healthcare facilities, where hygiene regulations and infection control are paramount.
Industrial cleaning applications require robust, high-performance machines, while residential cleaning services prioritize operator safety and cleaning time. The integration of IoT technology, data analytics, and cloud-based management systems is transforming the industry, enabling real-time monitoring and optimization of cleaning procedures. Smart cleaning technologies, such as autonomous cleaning robots and safety features, are also gaining traction. Battery technology and maintenance services are essential for ensuring cleaning productivity and minimizing downtime. Cleaning frequency, surface area, and cleaning protocols are all critical factors in optimizing cleaning efficiency and maintaining floor care standards across different floor types. Water recovery systems and cleaning chemicals are important considerations for industrial and commercial applications, where chemical usage and environmental sustainability are key concerns.
Surface preparation and floor restoration are also important areas of focus, as businesses seek to extend the life of their floors and maintain their appearance. Overall, the market is characterized by continuous innovation and a dynamic, evolving landscape, driven by the diverse needs of various sectors and the ongoing pursuit of improved cleaning efficiency, productivity, and sustainability.
Dive into Technavio's strong research methodology, blending expert interviews, extensive data synthesis, and validated models for unparalleled Floor Cleaning Machines Market insights. See full methodology.
|
Market Scope |
|
|
Report Coverage |
Details |
|
Page number |
220 |
|
Base year |
2024 |
|
Historic period |
2019-2023 |
|
Forecast period |
2025-2029 |
|
Growth momentum & CAGR |
Accelerate at a CAGR of 5% |
|
Market growth 2025-2029 |
USD 2.71 billion |
|
Market structure |
Fragmented |
|
YoY growth 2024-2025(%) |
4.7 |
|
Key countries |
US, UK, Germany, Canada, France, China, Italy, The Netherlands, Japan, and India |
|
Competitive landscape |
Leading Companies, Market Positioning of Companies, Competitive Strategies, and Industry Risks |
What are the Key Data Covered in this Floor Cleaning Machines Market Research and Growth Report?
- CAGR of the Floor Cleaning Machines industry during the forecast period
- Detailed information on factors that will drive the growth and forecasting between 2025 and 2029
- Precise estimation of the size of the market and its contribution of the industry in focus to the parent market
- Accurate predictions about upcoming growth and trends and changes in consumer behaviour
- Growth of the market across North America, Europe, APAC, South America, and Middle East and Africa
- Thorough analysis of the market's competitive landscape and detailed information about companies
- Comprehensive analysis of factors that will challenge the floor cleaning machines market growth and forecasting
We can help! Our analysts can customize this floor cleaning machines market research report to meet your requirements.
 RIA -
RIA - 
