Flowmeter Calibration Market Size 2025-2029
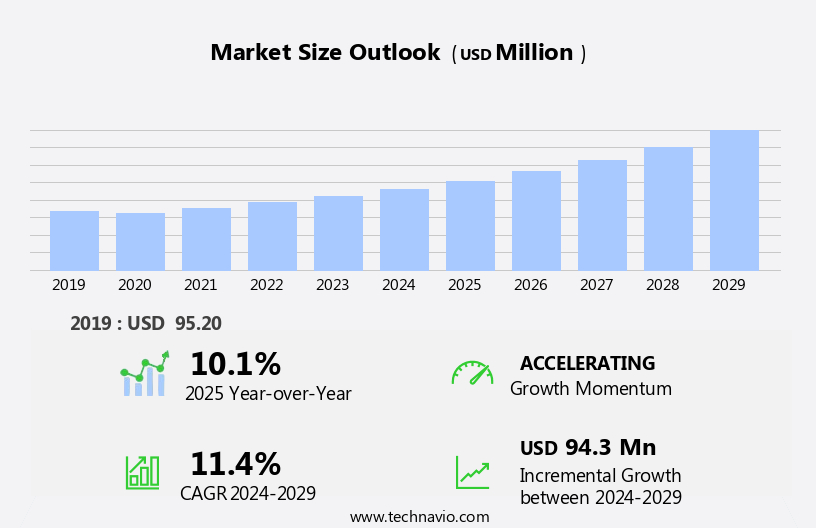
The flowmeter calibration market size is forecast to increase by USD 94.3 million, at a CAGR of 11.4% between 2024 and 2029.
- The market is driven by the necessity for calibration to eliminate uncertainty in flowmeter measurements. The emergence of online monitoring and self-contained field calibration systems offers opportunities for increased efficiency and reduced downtime. Additionally, the increasing demand for process automation and optimization in industries such as oil and gas, water and wastewater, and chemicals, is further fueling market growth.However, the complexity of calibration procedures poses a significant challenge. The intricacy of these processes necessitates specialized expertise and resources, potentially increasing costs for companies. Effective implementation of advanced calibration techniques, such as self-diagnostic systems and automated calibration processes, can help mitigate these challenges and improve overall operational performance.
- Companies seeking to capitalize on market opportunities should focus on developing user-friendly calibration solutions that minimize complexity and streamline the calibration process. The flow meter market in aerospace and defense, as well as in the agriculture sector, is expected to grow due to the increasing demand for precise flow measurement in these industries. Additionally, investment in research and development of innovative calibration technologies can provide a competitive edge in this market.
What will be the Size of the Flowmeter Calibration Market during the forecast period?
- The market encompasses a range of standards and reports essential for ensuring the accuracy and reliability of flowmeters in various applications. Flowmeter calibration is a critical aspect of installation and maintenance, with technology advancements leading to improved resolution, response time, and output. Calibration software and equipment enable efficient and precise calibration processes, while accreditation and certifications ensure adherence to regulations and industry best practices. Flowmeter calibration results are crucial for troubleshooting and validation, with repeatability and range playing significant roles in maintaining consistent measurements. Calibration services and training offer expert assistance, addressing the diverse needs of industries such as oil and gas, water and wastewater, and chemical processing.
- Flowmeter calibration regulations continue to evolve, emphasizing the importance of accuracy and traceability. Flowmeter types, including ultrasonic, magnetic, and Coriolis, each require specific calibration processes and equipment. Proper calibration and maintenance are essential for maintaining optimal flowmeter performance and ensuring regulatory compliance.
How is this Flowmeter Calibration Industry segmented?
The flowmeter calibration industry research report provides comprehensive data (region-wise segment analysis), with forecasts and estimates in "USD million" for the period 2025-2029, as well as historical data from 2019-2023 for the following segments.
- End-user
- Oil and gas
- Water and wastewater
- Mining and minerals
- Chemicals
- Others
- Distribution Channel
- OEM service providers
- Third-party service providers
- Type
- Magnetic
- Coriolis
- Ultrasonic
- Differential pressure
- Others
- Geography
- North America
- US
- Canada
- Europe
- France
- Germany
- Italy
- UK
- APAC
- China
- India
- Japan
- South America
- Brazil
- Rest of World (ROW)
- North America
By End-user Insights
The oil and gas segment is estimated to witness significant growth during the forecast period. In real-time scenarios, accurate flow measurement is crucial for industrial activities like oil and gas production, chemical processing in pharmaceuticals and agriculture, and wastewater treatment. The market experiences significant demand from the oil and gas industry due to the continuous need for accurate fluid measurement in pipeline applications. Flowmeters, which are essential for monitoring and controlling the flow rate of fluids, require regular calibration to maintain their precision. The calibration process involves comparing the flowmeter's reading with a known standard, ensuring the flowmeter's accuracy and reliability. Flowmeter calibration regulations mandate periodic calibration checks to maintain compliance and ensure safety. Calibration services play a crucial role in this process, offering on-site and laboratory calibration services to cater to various industry requirements.
Sustainability is a growing concern in the market, with an increasing focus on minimizing downtime and reducing the environmental impact of calibration procedures. Flowmeter calibration reports document the calibration results, providing valuable insights into the performance of the flowmeters and helping to identify any potential issues. Effective calibration management systems ensure that calibration schedules are followed, reducing the risk of non-compliance and downtime. Flowmeter calibration optimization techniques aim to improve calibration efficiency and reduce costs, while calibration lifecycle management ensures that flowmeters are calibrated at the right time, extending their service life. Flowmeter calibration compliance with industry standards and regulations is essential for ensuring the safety and reliability of the measurement systems.
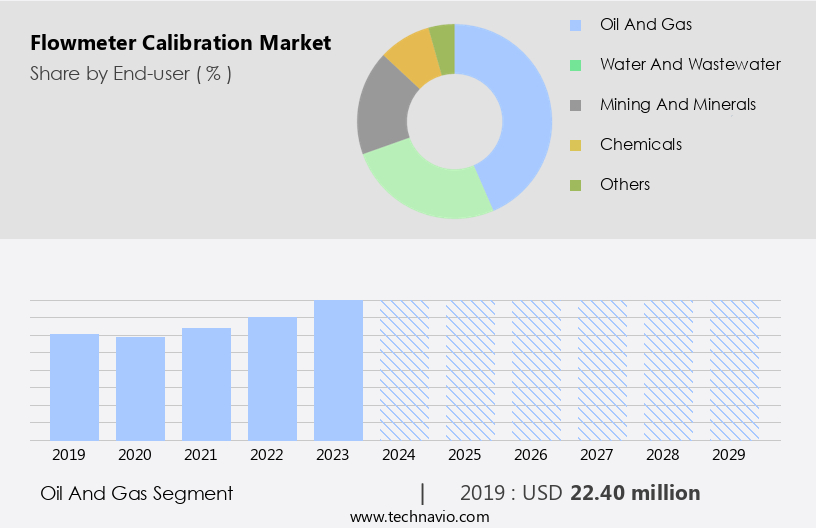
The Oil and gas segment was valued at USD 22.40 million in 2019 and showed a gradual increase during the forecast period.
Regional Analysis
Europe is estimated to contribute 29% to the growth of the global market during the forecast period.Technavio's analysts have elaborately explained the regional trends and drivers that shape the market during the forecast period.
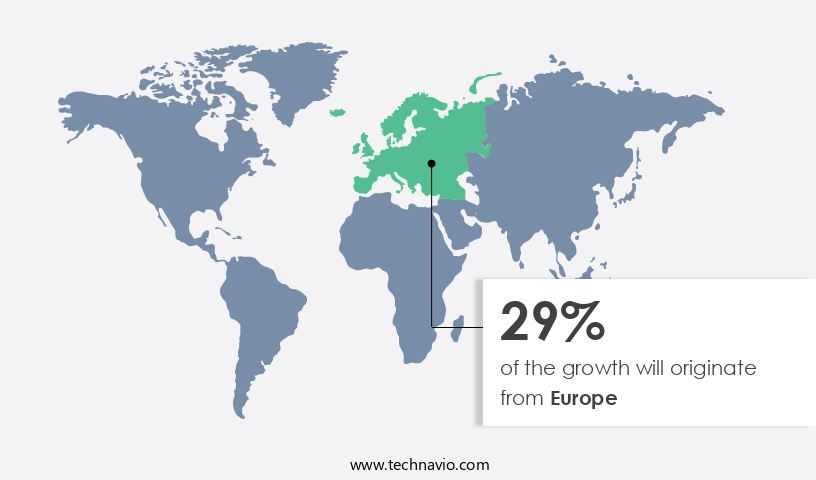
The market is witnessing significant growth due to the increasing demand for accurate measurement and compliance with regulations in various industries, particularly in oil and gas, chemical, and power. Europe is currently the largest market for flowmeter calibration services, driven by the region's industrialization and the need for high-precision measurements. Major contributing countries include Russia, Germany, Italy, France, and the UK, with Russia's hydrocarbon reserves making Europe a significant player in the global oil and gas market. The demand for flowmeter calibration is further fueled by the sustainability initiatives in these industries, leading to the adoption of advanced calibration systems and techniques.
Flowmeter calibration reports and documentation are crucial for ensuring compliance with regulations and maintaining the reliability and accuracy of flowmeters. The market is also witnessing innovation in areas such as cybersecurity, digitalization, IoT, and automation, which are transforming the flowmeter calibration landscape. Flowmeter calibration management systems and software are increasingly being used to optimize the calibration lifecycle, reduce downtime, and improve overall operational efficiency. The market is expected to continue its growth trajectory, driven by the increasing demand for accurate flow measurement and regulatory compliance.
Market Dynamics
Our researchers analyzed the data with 2024 as the base year, along with the key drivers, trends, and challenges. A holistic analysis of drivers will help companies refine their marketing strategies to gain a competitive advantage.
What are the Flowmeter Calibration market drivers leading to the rise in the adoption of Industry?
- The calibration process is essential in flowmeters as it reduces measurement uncertainty and significantly drives the market demand for accurate and reliable flow measurement solutions. Flowmeter calibration is a critical process that ensures the accuracy and reliability of flow measurement in various industries. In this context, a Flowmeter Calibration Laboratory plays a pivotal role in maintaining the precision of flowmeters. The calibration process involves several parameters, including calibration uncertainty, which is a measure of the difference between the true value and the measured value. Flowmeter calibration uncertainty can impact the primary parameters used in volumetric flow measurement. It is essential to evaluate the uncertainty of the meter to identify any discrepancies between the calibrated piping, the installed piping, and ancillary instrumentation. Flowmeter calibration upgrades are necessary to maintain the accuracy of the flowmeters over time.
- Innovations in calibration technology, such as calibration automation and analytics, can enhance the calibration process's efficiency and accuracy. Cybersecurity is another critical aspect of flowmeter calibration. Ensuring the security of calibration data is vital to prevent unauthorized access and data manipulation. Flowmeter calibration maintenance is crucial to keep the instruments in optimal condition. Regular calibration audits can help identify any potential issues and address them promptly. Traceability of calibration results to recognized standards with associated uncertainty allowances is mandatory to ensure the reliability of flow measurement data. Troubleshooting any calibration issues promptly is essential to minimize downtime and maintain process efficiency.
What are the Flowmeter Calibration market trends shaping the Industry?
- The emergence of online monitoring and self-contained field calibration is becoming a significant trend in the market. This innovation allows for real-time data collection and analysis, as well as the reduction of the need for on-site calibration, thereby increasing operational efficiency and reducing costs. In the market, advancements in technology are driving the adoption of digital and IoT solutions. Self-contained field calibration and online monitoring systems are becoming increasingly popular due to their ability to maintain meter accuracy and provide historical data for future reference. These technologies enable continuous calibration and monitoring, reducing downtime and associated risks.Moreover, modern smart devices, incorporating AI, IoT, wireless networks, and machine learning, are increasingly being used to enhance calibration frequency and precision.Companies are investing in equipment with self-contained calibration features, such as magmeters, thermal mass, or dual-rotor turbine meters. The importance of robust calibration protocols cannot be overstated in this context.
- As technology advances, flowmeter calibration becomes more smart and secure, with certification and safety becoming essential considerations. Companies must ensure their calibration processes adhere to industry standards and regulations to maintain the accuracy and reliability of their flow measurement systems.
How does Flowmeter Calibration market faces challenges face during its growth?
- The intricacy of calibration procedures poses a significant challenge and hinders growth within the industry. The market encompasses the provision of services and systems to ensure the accuracy and reliability of flowmeters, which measure the rate and volume of fluid flow. Compliance with calibration regulations is a critical aspect of this market, as precise measurement is essential for various industries, including oil and gas, water and wastewater, and chemical processing. Flowmeter calibration procedures are intricate, as they depend on the specific type of flowmeter and its application. Differential pressure, Coriolis, ultrasonic, magnetic, and turbine flowmeters each require distinct calibration techniques, setups, and expertise. The calibration process involves the use of reference standards, temperature and pressure compensation, and consideration of fluid properties, such as viscosity, density, and compressibility.
- Multiphase flow scenarios, common in oil and gas production, add complexity to calibration due to the interaction of gas, liquid, and sometimes solid phases. Ensuring calibration sustainability is vital, as it impacts the efficiency and cost-effectiveness of operations. Calibration reports document the process and results, providing evidence of compliance and optimization opportunities. Effective calibration management and documentation facilitate regulatory compliance and continuous improvement. The calibration lifecycle, from initial setup to routine maintenance, is a continuous process that requires ongoing attention to maintain flowmeter performance and accuracy.
Exclusive Customer Landscape
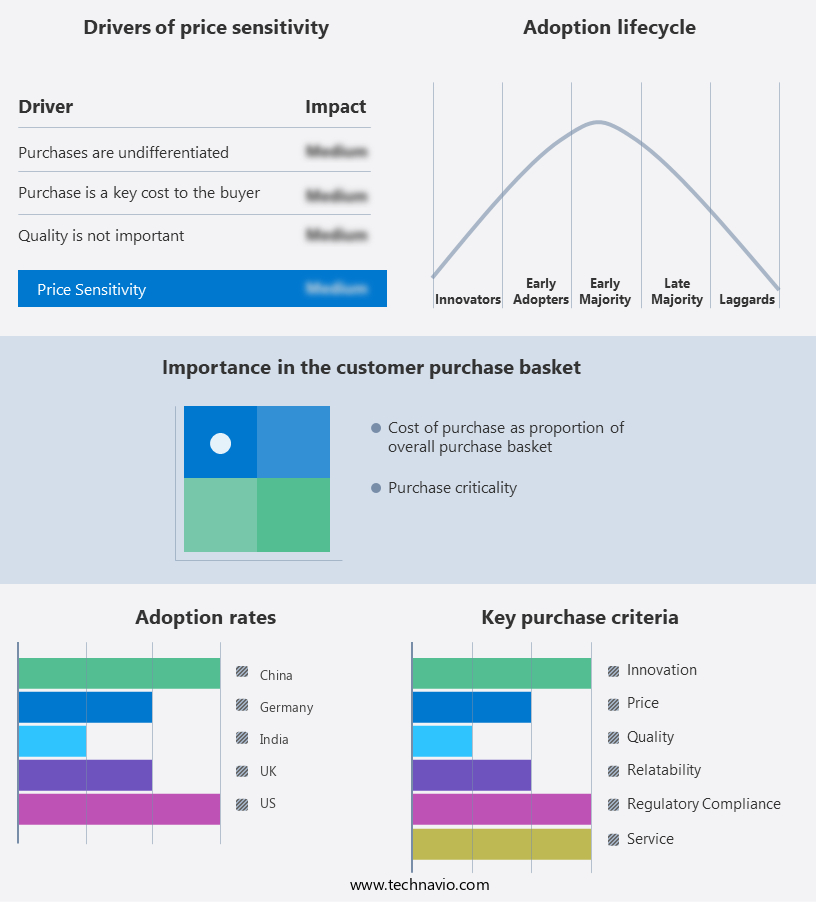
The flowmeter calibration market forecasting report includes the adoption lifecycle of the market, covering from the innovator's stage to the laggard's stage. It focuses on adoption rates in different regions based on penetration. Furthermore, the flowmeter calibration market report also includes key purchase criteria and drivers of price sensitivity to help companies evaluate and develop their market growth analysis strategies.
Customer Landscape
Key Companies & Market Insights
Companies are implementing various strategies, such as strategic alliances, flowmeter calibration market forecast, partnerships, mergers and acquisitions, geographical expansion, and product/service launches, to enhance their presence in the industry.
ABB Ltd. - Flowmeter calibration services optimize productivity and profitability by ensuring accurate measurement of fluid flow. Compliance with regulatory requirements is crucial in maintaining business operations and avoiding potential penalties.
The industry research and growth report includes detailed analyses of the competitive landscape of the market and information about key companies, including:
- ABB Ltd.
- Azbil Corp.
- Badger Meter Inc.
- Brooks Instrument LLC
- Colorado Engineering Experiment Station Inc.
- Emerson Electric Co.
- Endress Hauser Group Services AG
- Euroloop Calibrations BV
- Fluke Corp.
- HOFFER FLOW CONTROLS Inc.
- Honeywell International Inc.
- KROHNE Messtechnik GmbH
- Laboratory Testing Inc.
- Polycontrols Technologies Inc.
- Schneider Electric SE
- Siemens AG
- Sierra Instruments Inc.
- TransCanada Calibrations Ltd.
- VSL BV
- Yokogawa Electric Corp.
Qualitative and quantitative analysis of companies has been conducted to help clients understand the wider business environment as well as the strengths and weaknesses of key industry players. Data is qualitatively analyzed to categorize companies as pure play, category-focused, industry-focused, and diversified; it is quantitatively analyzed to categorize companies as dominant, leading, strong, tentative, and weak.
Recent Development and News in Flowmeter Calibration Market
- In February 2023, Emerson Electric Company, a leading technology and engineering firm, introduced its new Rosemount 3051S Ultrasonic Flowmeter, which offers enhanced accuracy and reliability in the oil and gas industry (Emerson Electric Company Press Release). This innovation marks a significant technological advancement in the market, enabling improved efficiency and cost savings for energy companies.
- In May 2024, Honeywell International Inc. And Flowserve Corporation announced their strategic partnership to expand their combined offerings in the flow measurement and control market, including calibration services. This collaboration aims to provide comprehensive solutions to customers and strengthen their market presence (Honeywell International Inc. Press Release).
Research Analyst Overview
The market continues to evolve, driven by the ever-changing dynamics of various industries. Digital flowmeter calibration solutions are increasingly being adopted to enhance accuracy and efficiency, with IoT integration enabling real-time monitoring and data analysis. The calibration cycle is a critical aspect of flowmeter performance, and advancements in technology are leading to smarter, more secure calibration methods. Obsolescence management is a growing concern, as aging equipment requires replacement or upgrades to maintain compliance and reliability. Flowmeter calibration certification and safety are paramount, with stringent regulations and standards in place to ensure optimal performance. On-site calibration services offer flexibility and convenience, while calibration software and equipment enable remote and automated processes.
The Flowmeter Calibration Market is growing rapidly with advancements in flowmeter calibration software and flowmeter calibration technology, improving efficiency and accuracy. Various flowmeter calibration techniques ensure precise measurement, maintaining flowmeter calibration traceability through standardized flowmeter calibration audits and flowmeter calibration validation. The rise of flowmeter calibration onsite services and flowmeter calibration training programs supports industry professionals. A structured flowmeter calibration system, including flowmeter calibration cycle and flowmeter calibration schedule, ensures consistent performance. Effective flowmeter calibration documentation aids in flowmeter calibration troubleshooting, optimizing flowmeter calibration ROI. Innovations in flowmeter calibration automation, flowmeter calibration remote, flowmeter calibration digital, flowmeter calibration smart, and flowmeter calibration IoT enhance efficiency. Flowmeter calibration analytics contributes to flowmeter calibration sustainability, improving flowmeter calibration safety, flowmeter calibration security, and flowmeter calibration cybersecurity. Ensuring flowmeter calibration reliability, industries focus on flowmeter calibration lifecycle, flowmeter calibration upgrade, and flowmeter calibration replacement, driving progress in calibration standards and industry innovation.
The Flowmeter Calibration Market is evolving with advancements in flowmeter technology, improving measurement precision across various flowmeter applications. Ensuring flowmeter accuracy and flowmeter repeatability is essential for reliable data collection. Innovations in flowmeter resolution and flowmeter response time enhance performance, optimizing the flowmeter range for diverse industrial needs. Proper flowmeter installation impacts efficiency, while routine flowmeter maintenance prevents errors. Effective flowmeter troubleshooting is critical for operational success. The flowmeter calibration process ensures consistency and compliance with industry standards. As demand grows, companies focus on refining calibration techniques to improve flowmeter output and maximize performance, shaping the future of flow measurement technology.
Calibration optimization and lifecycle management are essential for maximizing return on investment, with ongoing training and maintenance crucial for maintaining accuracy and minimizing downtime. Innovation continues to drive the market, with uncertainty and analytics playing a key role in predictive maintenance and troubleshooting. Calibration traceability and cybersecurity are becoming increasingly important, as data security and regulatory compliance become more stringent. The market is expected to continue its dynamic evolution, with ongoing developments in technology and regulations shaping the landscape.
Dive into Technavio's strong research methodology, blending expert interviews, extensive data synthesis, and validated models for unparalleled Flowmeter Calibration Market insights. See full methodology.
|
Market Scope |
|
|
Report Coverage |
Details |
|
Page number |
232 |
|
Base year |
2024 |
|
Historic period |
2019-2023 |
|
Forecast period |
2025-2029 |
|
Growth momentum & CAGR |
Accelerate at a CAGR of 11.4% |
|
Market growth 2025-2029 |
USD 94.3 million |
|
Market structure |
Fragmented |
|
YoY growth 2024-2025(%) |
10.1 |
|
Key countries |
US, Germany, China, UK, India, France, Japan, Canada, Italy, and Brazil |
|
Competitive landscape |
Leading Companies, Market Positioning of Companies, Competitive Strategies, and Industry Risks |
What are the Key Data Covered in this Flowmeter Calibration Market Research and Growth Report?
- CAGR of the Flowmeter Calibration industry during the forecast period
- Detailed information on factors that will drive the growth and forecasting between 2025 and 2029
- Precise estimation of the size of the market and its contribution of the industry in focus to the parent market
- Accurate predictions about upcoming growth and trends and changes in consumer behaviour
- Growth of the market across Europe, North America, APAC, Middle East and Africa, and South America
- Thorough analysis of the market's competitive landscape and detailed information about companies
- Comprehensive analysis of factors that will challenge the flowmeter calibration market growth of industry companies
We can help! Our analysts can customize this flowmeter calibration market research report to meet your requirements.
 RIA -
RIA - 
