Food Acidulants Market Analysis, Size, and Forecast 2026-2030: North America (US, Canada, and Mexico), APAC (China, Japan, and India), Europe (Germany, UK, and France), South America (Brazil, Argentina, and Colombia), Middle East and Africa (Saudi Arabia, UAE, and South Africa), and Rest of World (ROW)

Food Acidulants Market Analysis, Size, and Forecast 2026-2030:
North America (US, Canada, and Mexico), APAC (China, Japan, and India), Europe (Germany, UK, and France), South America (Brazil, Argentina, and Colombia), Middle East and Africa (Saudi Arabia, UAE, and South Africa), and Rest of World (ROW)

Published: Jan 2026 295 Pages SKU: IRTNTR72953

Market Overview at a Glance

$2.94 B
Market Opportunity
7.3%
CAGR 2025 - 2030
30.8%
North America Growth
$2.58 B
Bakery and confectionery segment 2024

Food Acidulants Market Size 2026-2030

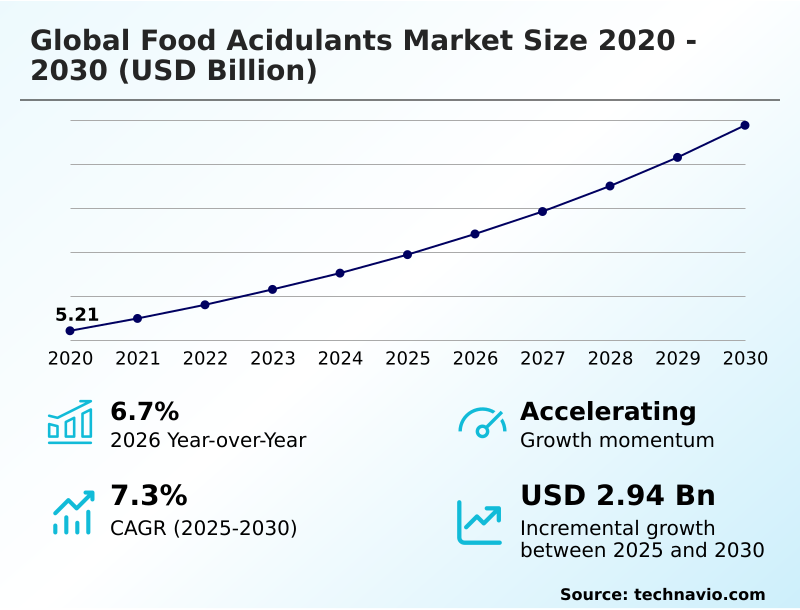
The food acidulants market size is valued to increase by USD 2.94 billion, at a CAGR of 7.3% from 2025 to 2030. Rising consumer preference for natural and clean label ingredients will drive the food acidulants market.

Major Market Trends & Insights

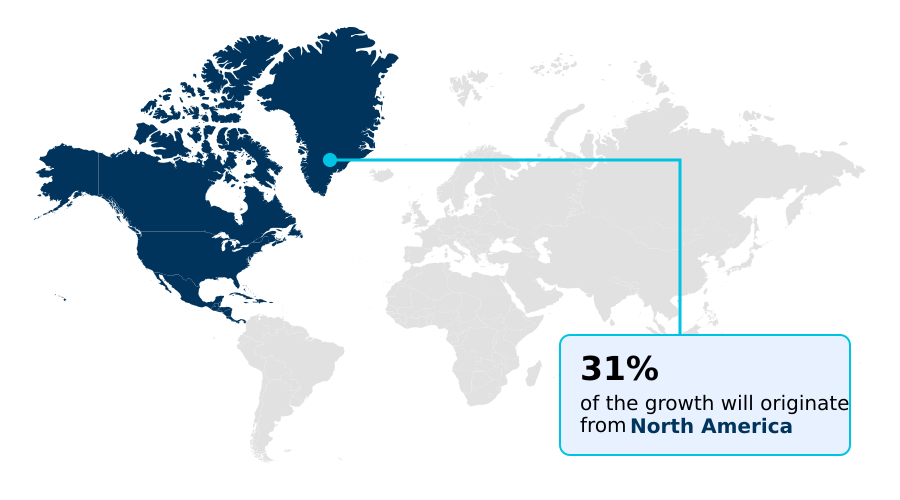
  • North America dominated the market and accounted for a 30.8% growth during the forecast period.
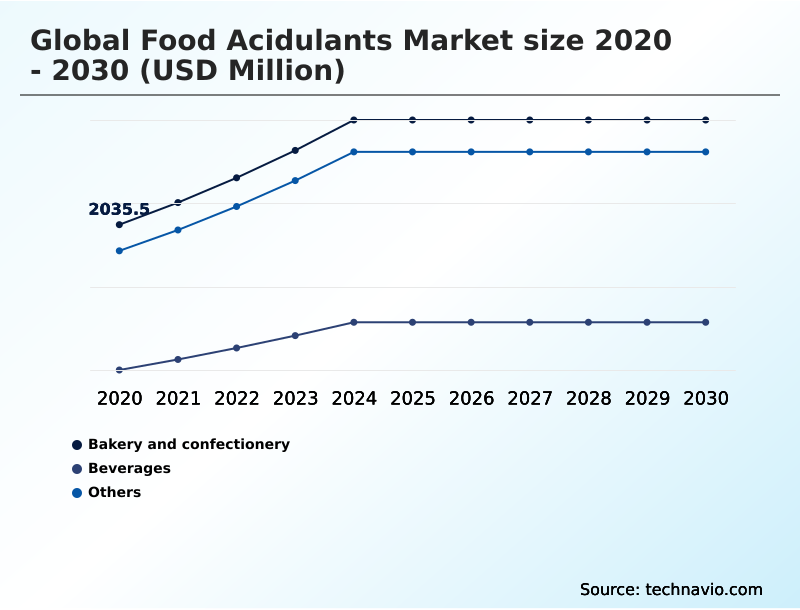
  • By Application - Bakery and confectionery segment was valued at USD 2.58 billion in 2024
  • By Type - Citric acid segment accounted for the largest market revenue share in 2024

Market Size & Forecast

  • Market Opportunities: USD 4.67 billion
  • Market Future Opportunities: USD 2.94 billion
  • CAGR from 2025 to 2030 : 7.3%

Market Summary

  • The food acidulants market is integral to modern food manufacturing, driven by the persistent demand for products with enhanced shelf life, stable flavor profiles, and consistent quality. A primary driver is the consumer-led movement toward clean label ingredients and natural food preservatives, compelling manufacturers to replace synthetic additives with fermentation-derived acids.
  • This trend is supported by biotechnology advancements that improve the yield and purity of bio-based acidulants like citric acid monohydrate and those from lactic acid fermentation. A key trend involves creating sophisticated acidulant blends for precise taste modulation and sensory improvement in reformulated, low-sugar products.
  • For instance, a beverage company aiming to launch a new line of functional drinks faces the business challenge of achieving a specific sourness profile and beverage acidification without compromising microbial stability agent effectiveness. This requires careful process optimization to balance buffering capacity and chelation agent properties with cost-efficiency.
  • However, the market grapples with challenges such as volatile raw material costs, which disrupt supply chains and impact production planning. Navigating stringent food safety standards for ingredient traceability and regulatory compliance remains a critical operational focus for all participants.

What will be the Size of the Food Acidulants Market during the forecast period?

Get Key Insights on Market Forecast (PDF) Request Free Sample

How is the Food Acidulants Market Segmented?

The food acidulants industry research report provides comprehensive data (region-wise segment analysis), with forecasts and estimates in "USD million" for the period 2026-2030, as well as historical data from 2020-2024 for the following segments.

  • Application
    • Bakery and confectionery
    • Beverages
    • Others
  • Type
    • Citric acid
    • Lactic acid
    • Others
  • Form factor
    • Powder
    • Liquid
  • Geography
    • North America
      • US
      • Canada
      • Mexico
    • APAC
      • China
      • Japan
      • India
    • Europe
      • Germany
      • UK
      • France
    • South America
      • Brazil
      • Argentina
      • Colombia
    • Middle East and Africa
      • Saudi Arabia
      • UAE
      • South Africa
    • Rest of World (ROW)

By Application Insights

The bakery and confectionery segment is estimated to witness significant growth during the forecast period.

The bakery and confectionery segment relies heavily on acidulants for essential functions beyond simple flavor. In bakery application settings, these compounds are critical for dough conditioning and enabling a consistent leavening agent reaction, which directly impacts final texture development.

For confectionery production, controlling sugar crystallization control is paramount for achieving the desired mouthfeel and extending product shelf life. Specialized fumaric acid applications offer superior performance in dry mixes due to hygroscopicity reduction.

Manufacturers benefit from improved formulation flexibility and cost-efficiency, with advanced processing techniques delivering enhanced particle size uniformity for automated systems, leading to a 15% reduction in batch-to-batch inconsistencies and supporting overall sensory improvement.

Request Free Sample

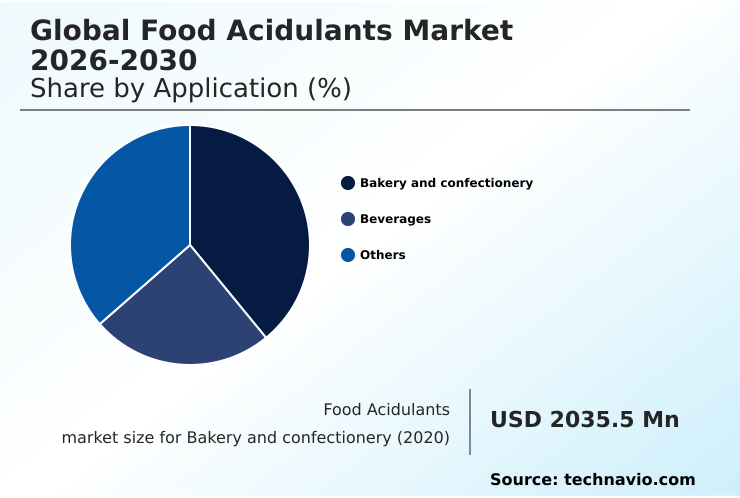
The Bakery and confectionery segment was valued at USD 2.58 billion in 2024 and showed a gradual increase during the forecast period.

Request Free Sample

Regional Analysis

North America is estimated to contribute 30.8% to the growth of the global market during the forecast period.Technavio’s analysts have elaborately explained the regional trends and drivers that shape the market during the forecast period.

See How Food Acidulants Market Demand is Rising in North America Request Free Sample

The geographic landscape is shaped by regional consumption patterns and manufacturing priorities. North America accounts for approximately 30.8% of incremental growth, driven by demand for acidulants in ready-to-eat meals and sophisticated savory food systems.

Meanwhile, APAC represents 27.6% of the growth, fueled by expanding production. In Europe, the focus is on premium product positioning and circular economy models.

Formulations are evolving globally; for instance, acidulants are used as a salt reduction enhancer and for color retention in processed foods. In plant-based food formulation, they are crucial for taste and texture.

Advanced applications include their use as an emulsion stabilizer in dressings and to enhance mineral absorption aid.

Biotechnology advancements have improved antimicrobial performance, with some European facilities reporting a 12% reduction in waste through optimized processes, underscoring the importance of ingredient traceability.

Market Dynamics

Our researchers analyzed the data with 2025 as the base year, along with the key drivers, trends, and challenges. A holistic analysis of drivers will help companies refine their marketing strategies to gain a competitive advantage.

  • The food acidulants market is experiencing steady expansion, with year-over-year growth approaching 7%, driven by sophisticated formulation requirements across the food and beverage industry. The specific citric acid in beverage ph regulation remains a cornerstone application, ensuring stability in soft drinks and juices. Similarly, the use of lactic acid for dairy product preservation is fundamental in yogurts and cheeses.
  • In confectionery, achieving the perfect malic acid taste profile in confectionery is key for product differentiation, while the established phosphoric acid use in soft drinks provides a distinct sharpness. For dry goods, the role of fumaric acid as a dry mix stabilizer is critical for extending shelf life.
  • The versatility extends to condiments, with the acetic acid role in sauce preservation being indispensable. A major trend shaping the market is the impact of bio-based acidulants on clean labels, which directly addresses consumer demand for transparency. This has amplified the focus on natural acidulants for shelf-life extension.
  • Advanced fermentation technology for organic acid production is enabling manufacturers to meet this demand at scale. Consequently, the development of acidulant blends for flavor optimization has become more sophisticated. Technical challenges such as managing hygroscopicity with food acidulants are being addressed, especially in acidulants in bakery leavening systems.
  • Other precise applications include controlling sugar crystallization with acidulants in sweets, optimizing ph in plant-based alternatives, and enhancing mineral bioavailability with acidulants in fortified foods.
  • The market is also seeing growth from acidulants for sodium reduction strategies, improving texture in processed meats, strengthening the antimicrobial efficacy of acidulant systems, ensuring emulsion stability in dressings with acidulants, and maintaining color stability in preserved foods. Regional growth dynamics show APAC expanding faster than North America, reflecting different stages of market maturity.

What are the key market drivers leading to the rise in the adoption of Food Acidulants Industry?

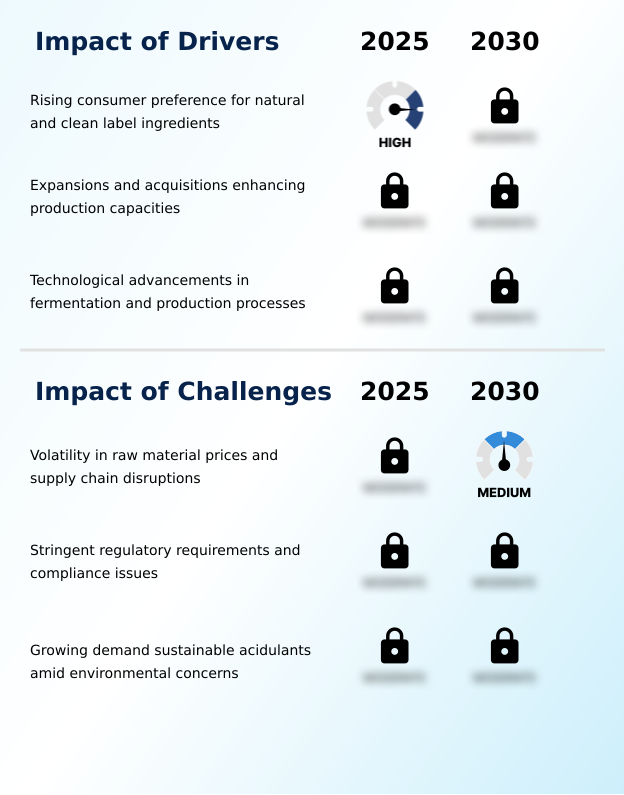
  • The primary driver shaping the market is the significant rise in consumer preference for natural and clean-label ingredients in food and beverage products.

  • Market growth is driven by the indispensable role of acidulants as a multifunctional food processing aid. Their function as a ph control agent, flavor enhancement compound, and microbial stability agent is fundamental to food safety and quality.
  • The ability to act as a shelf-life extension additive is critical, with optimized use reducing product loss by over 12% in some supply chains.
  • Strategic production capacity expansion and vertical integration allow producers to achieve economies of scale, which has lowered input costs for buyers by an average of 5-8% in long-term contracts.
  • In specific applications like beverage acidification, dairy fermentation control, and dough conditioning, consistent performance is paramount. This reliance drives investment in robust quality management systems to ensure unwavering regulatory compliance across all operations.

What are the market trends shaping the Food Acidulants Industry?

  • A prominent market trend is the accelerating shift toward bio-based acidulants. This movement reflects a growing industry response to consumer demand for clean-label and sustainably sourced ingredients.

  • Key market trends are centered on sustainability and functionality, driven by consumer demand for clean label ingredients. The focus is shifting toward natural food preservatives and bio-based acidulants created through biotechnology advancements. This has led to the rise of fermentation-derived acids and other organic acid solutions that support sustainable sourcing.
  • Application-specific innovation is enabling the creation of advanced acidulant blends for precise taste modulation in functional food ingredients. Companies embracing green chemistry principles have reported up to a 10% reduction in energy consumption during production. This trend supports premium product positioning, as brands can highlight natural origins.
  • Furthermore, enhanced formulations have improved product stability, reducing spoilage rates by 15% in certain applications.

What challenges does the Food Acidulants Industry face during its growth?

  • A key challenge impacting the industry's growth trajectory is the persistent volatility in raw material prices coupled with significant supply chain disruptions.

  • The market faces challenges related to supply chain resilience and cost-efficiency amidst fluctuating raw material prices. Ensuring consistent buffering capacity and chelation agent properties while managing costs is a key operational hurdle. This directly impacts the ability to deliver a predictable sourness profile or use acidulants as a salt reduction enhancer.
  • Adherence to stringent food safety standards requires complete ingredient traceability, adding complexity and cost; failure to comply can increase recall risks by up to 20%. Process optimization is critical for mitigating these issues. For instance, implementing automated dosing systems has improved accuracy by 30%, reducing waste.
  • However, achieving desired particle size uniformity for specific applications like texture development remains a challenge, as does ensuring consistent antimicrobial performance across different batches.

Exclusive Technavio Analysis on Customer Landscape

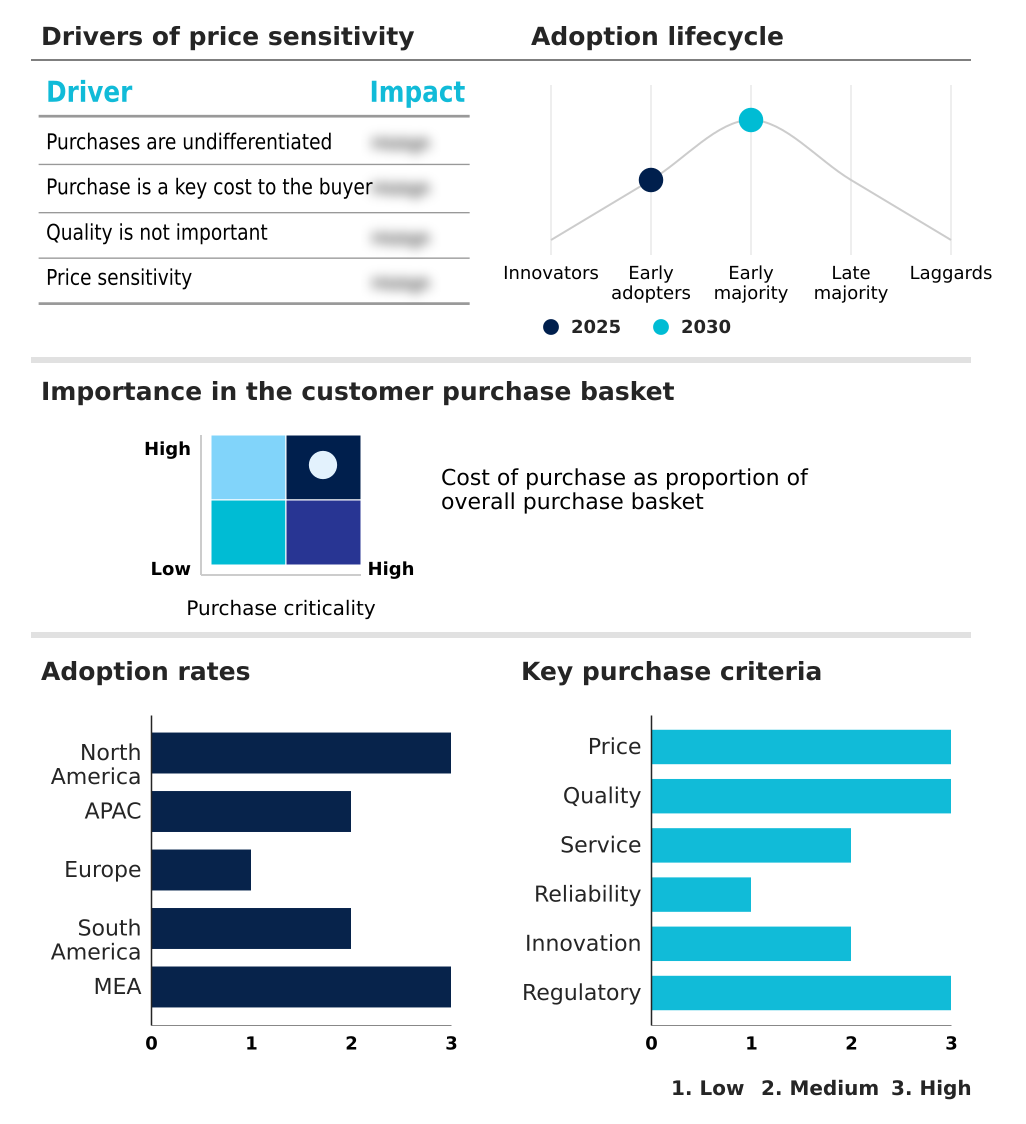
The food acidulants market forecasting report includes the adoption lifecycle of the market, covering from the innovator’s stage to the laggard’s stage. It focuses on adoption rates in different regions based on penetration. Furthermore, the food acidulants market report also includes key purchase criteria and drivers of price sensitivity to help companies evaluate and develop their market growth analysis strategies.

Customer Landscape of Food Acidulants Industry

Competitive Landscape

Companies are implementing various strategies, such as strategic alliances, food acidulants market forecast, partnerships, mergers and acquisitions, geographical expansion, and product/service launches, to enhance their presence in the industry.

Archer Daniels Midland Co. - Provides acidulant solutions that manage pH, enhance flavor, and improve shelf life, serving the beverage, bakery, confectionery, and processed food sectors with consistent quality.

The industry research and growth report includes detailed analyses of the competitive landscape of the market and information about key companies, including:

  • Archer Daniels Midland Co.
  • Arshine Pharmaceutical Co. Ltd.
  • Bartek Ingredients Inc.
  • Batory Foods
  • BRENNTAG SE
  • Cargill Inc.
  • Citribel NV
  • Corbion N.V.
  • DairyChem
  • FBC Industries Inc.
  • Grasim Industries Ltd.
  • Hawkins Watts Ltd.
  • Isegen South Africa Pty Ltd.
  • Jungbunzlauer Suisse AG
  • Megachem Limited
  • Prinova Group LLC
  • Suntran Industrial Group Ltd.
  • Univar Solutions Inc.
  • Weifang Ensign Industry Co.

Qualitative and quantitative analysis of companies has been conducted to help clients understand the wider business environment as well as the strengths and weaknesses of key industry players. Data is qualitatively analyzed to categorize companies as pure play, category-focused, industry-focused, and diversified; it is quantitatively analyzed to categorize companies as dominant, leading, strong, tentative, and weak.

Recent Development and News in Food acidulants market

  • In August, 2025, Ensign World upgraded its facilities to align with new Chinese policies emphasizing clean production methods, thereby enhancing its compliance for food-grade acidulants.
  • In November, 2025, Jungbunzlauer completed its acquisition of an Illinois-based manufacturing facility from International Flavors and Fragrances Inc., establishing its first US production site for biobased acidulants.
  • In February, 2025, the European Food Safety Authority implemented revised guidance on novel foods, streamlining the approval pathway for fermentation-derived acids and accelerating innovation.
  • In May, 2025, Caitlyn India Private Limited announced a major investment to build a phosphoric acid plant in India, leveraging advanced technology to increase domestic production capacity.

Dive into Technavio’s robust research methodology, blending expert interviews, extensive data synthesis, and validated models for unparalleled Food Acidulants Market insights. See full methodology.

Market Scope
Page number 295
Base year 2025
Historic period 2020-2024
Forecast period 2026-2030
Growth momentum & CAGR Accelerate at a CAGR of 7.3%
Market growth 2026-2030 USD 2939.8 million
Market structure Fragmented
YoY growth 2025-2026(%) 6.7%
Key countries US, Canada, Mexico, China, Japan, India, South Korea, Australia, Indonesia, Germany, UK, France, Italy, Spain, The Netherlands, Brazil, Argentina, Colombia, Saudi Arabia, UAE, South Africa, Israel and Turkey
Competitive landscape Leading Companies, Market Positioning of Companies, Competitive Strategies, and Industry Risks

Request Free Sample

Research Analyst Overview

  • The food acidulants market is evolving beyond commodity supply, focusing on process optimization and functional benefits. The demand for clean label ingredients is pushing bio-based acidulants to the forefront, with fermentation-derived acids from processes like lactic acid fermentation becoming standard.
  • These organic acid solutions are not just a ph control agent but also a flavor enhancement compound and microbial stability agent. Their role as a shelf-life extension additive is crucial. A key boardroom decision revolves around investing in technologies for citric acid monohydrate and malic acid synthesis that also offer chelation agent properties and superior buffering capacity.
  • This includes leveraging phosphoric acid food grade and fumaric acid applications for specialized needs like beverage acidification and hygroscopicity reduction. In bakery, precise leavening agent reaction and dough conditioning are vital, while in confectionery, sugar crystallization control is key. The sourness profile is managed through precise taste modulation using acidulant blends.
  • For instance, integrating automated systems for acetic acid preservation has led to a 30% reduction in processing time. This innovation extends to dairy fermentation control, plant-based food formulation, salt reduction enhancer strategies, sensory improvement, texture development, emulsion stabilizer functions, color retention, and antimicrobial performance, all while enabling mineral absorption aid.

What are the Key Data Covered in this Food Acidulants Market Research and Growth Report?

  • What is the expected growth of the Food Acidulants Market between 2026 and 2030?

    • USD 2.94 billion, at a CAGR of 7.3%

  • What segmentation does the market report cover?

    • The report is segmented by Application (Bakery and confectionery, Beverages, and Others), Type (Citric acid, Lactic acid, and Others), Form Factor (Powder, and Liquid) and Geography (North America, APAC, Europe, South America, Middle East and Africa)

  • Which regions are analyzed in the report?

    • North America, APAC, Europe, South America and Middle East and Africa

  • What are the key growth drivers and market challenges?

    • Rising consumer preference for natural and clean label ingredients, Volatility in raw material prices and supply chain disruptions

  • Who are the major players in the Food Acidulants Market?

    • Archer Daniels Midland Co., Arshine Pharmaceutical Co. Ltd., Bartek Ingredients Inc., Batory Foods, BRENNTAG SE, Cargill Inc., Citribel NV, Corbion N.V., DairyChem, FBC Industries Inc., Grasim Industries Ltd., Hawkins Watts Ltd., Isegen South Africa Pty Ltd., Jungbunzlauer Suisse AG, Megachem Limited, Prinova Group LLC, Suntran Industrial Group Ltd., Univar Solutions Inc. and Weifang Ensign Industry Co.

Market Research Insights

  • The food acidulants market is defined by its role as a critical food processing aid that ensures packaged food quality and product shelf life. Sustainable sourcing initiatives and robust quality management systems are becoming standard, as companies aim for ingredient traceability and supply chain resilience.
  • Adopting process intelligence and advanced fermentation analytics has enabled some producers to achieve a 15% reduction in batch variability. This push for efficiency, coupled with production capacity expansion, helps achieve economies of scale. In beverage formulation and confectionery production, formulation flexibility is key, with some firms reporting a 10% improvement in cost-efficiency through optimized use of functional food ingredients.
  • These gains are crucial for maintaining competitiveness while adhering to strict regulatory compliance and food safety standards.

We can help! Our analysts can customize this food acidulants market research report to meet your requirements.

Get in touch

1. Executive Summary

1.1 Market overview

Executive Summary - Chart on Market Overview
Executive Summary - Data Table on Market Overview
Executive Summary - Chart on Global Market Characteristics
Executive Summary - Chart on Market by Geography
Executive Summary - Chart on Market Segmentation by Application
Executive Summary - Chart on Market Segmentation by Type
Executive Summary - Chart on Market Segmentation by Form Factor
Executive Summary - Chart on Incremental Growth
Executive Summary - Data Table on Incremental Growth
Executive Summary - Chart on Company Market Positioning

2. Technavio Analysis

2.1 Analysis of price sensitivity, lifecycle, customer purchase basket, adoption rates, and purchase criteria

2.2 Criticality of inputs and Factors of differentiation

Chart on Overview on criticality of inputs and factors of differentiation

2.3 Factors of disruption

Chart on Overview on factors of disruption

2.4 Impact of drivers and challenges

Chart on Impact of drivers and challenges in 2025 and 2030

3. Market Landscape

3.1 Market ecosystem

Chart on Parent Market
Data Table on - Parent Market

3.2 Market characteristics

Chart on Market characteristics analysis

3.3 Value chain analysis

Chart on Value chain analysis

4. Market Sizing

4.1 Market definition

Data Table on Offerings of companies included in the market definition

4.2 Market segment analysis

Market segments

4.3 Market size 2025

4.4 Market outlook: Forecast for 2025-2030

Chart on Global - Market size and forecast 2025-2030 ($ million)
Data Table on Global - Market size and forecast 2025-2030 ($ million)
Chart on Global Market: Year-over-year growth 2025-2030 (%)
Data Table on Global Market: Year-over-year growth 2025-2030 (%)

5. Historic Market Size

5.1 Global Food Acidulants Market 2020 - 2024

Historic Market Size - Data Table on Global Food Acidulants Market 2020 - 2024 ($ million)

5.2 Application segment analysis 2020 - 2024

Historic Market Size - Application Segment 2020 - 2024 ($ million)

5.3 Type segment analysis 2020 - 2024

Historic Market Size - Type Segment 2020 - 2024 ($ million)

5.4 Form Factor segment analysis 2020 - 2024

Historic Market Size - Form Factor Segment 2020 - 2024 ($ million)

5.5 Geography segment analysis 2020 - 2024

Historic Market Size - Geography Segment 2020 - 2024 ($ million)

5.6 Country segment analysis 2020 - 2024

Historic Market Size - Country Segment 2020 - 2024 ($ million)

6. Qualitative Analysis

6.1 Impact of AI in Global Food Acidulants Market

7. Five Forces Analysis

7.1 Five forces summary

Five forces analysis - Comparison between 2025 and 2030

7.2 Bargaining power of buyers

Bargaining power of buyers - Impact of key factors 2025 and 2030

7.3 Bargaining power of suppliers

Bargaining power of suppliers - Impact of key factors in 2025 and 2030

7.4 Threat of new entrants

Threat of new entrants - Impact of key factors in 2025 and 2030

7.5 Threat of substitutes

Threat of substitutes - Impact of key factors in 2025 and 2030

7.6 Threat of rivalry

Threat of rivalry - Impact of key factors in 2025 and 2030

7.7 Market condition

Chart on Market condition - Five forces 2025 and 2030

8. Market Segmentation by Application

8.1 Market segments

Chart on Application - Market share 2025-2030 (%)
Data Table on Application - Market share 2025-2030 (%)

8.2 Comparison by Application

Chart on Comparison by Application
Data Table on Comparison by Application

8.3 Bakery and confectionery - Market size and forecast 2025-2030

Chart on Bakery and confectionery - Market size and forecast 2025-2030 ($ million)
Data Table on Bakery and confectionery - Market size and forecast 2025-2030 ($ million)
Chart on Bakery and confectionery - Year-over-year growth 2025-2030 (%)
Data Table on Bakery and confectionery - Year-over-year growth 2025-2030 (%)

8.4 Beverages - Market size and forecast 2025-2030

Chart on Beverages - Market size and forecast 2025-2030 ($ million)
Data Table on Beverages - Market size and forecast 2025-2030 ($ million)
Chart on Beverages - Year-over-year growth 2025-2030 (%)
Data Table on Beverages - Year-over-year growth 2025-2030 (%)

8.5 Others - Market size and forecast 2025-2030

Chart on Others - Market size and forecast 2025-2030 ($ million)
Data Table on Others - Market size and forecast 2025-2030 ($ million)
Chart on Others - Year-over-year growth 2025-2030 (%)
Data Table on Others - Year-over-year growth 2025-2030 (%)

8.6 Market opportunity by Application

Market opportunity by Application ($ million)
Data Table on Market opportunity by Application ($ million)

9. Market Segmentation by Type

9.1 Market segments

Chart on Type - Market share 2025-2030 (%)
Data Table on Type - Market share 2025-2030 (%)

9.2 Comparison by Type

Chart on Comparison by Type
Data Table on Comparison by Type

9.3 Citric acid - Market size and forecast 2025-2030

Chart on Citric acid - Market size and forecast 2025-2030 ($ million)
Data Table on Citric acid - Market size and forecast 2025-2030 ($ million)
Chart on Citric acid - Year-over-year growth 2025-2030 (%)
Data Table on Citric acid - Year-over-year growth 2025-2030 (%)

9.4 Lactic acid - Market size and forecast 2025-2030

Chart on Lactic acid - Market size and forecast 2025-2030 ($ million)
Data Table on Lactic acid - Market size and forecast 2025-2030 ($ million)
Chart on Lactic acid - Year-over-year growth 2025-2030 (%)
Data Table on Lactic acid - Year-over-year growth 2025-2030 (%)

9.5 Others - Market size and forecast 2025-2030

Chart on Others - Market size and forecast 2025-2030 ($ million)
Data Table on Others - Market size and forecast 2025-2030 ($ million)
Chart on Others - Year-over-year growth 2025-2030 (%)
Data Table on Others - Year-over-year growth 2025-2030 (%)

9.6 Market opportunity by Type

Market opportunity by Type ($ million)
Data Table on Market opportunity by Type ($ million)

10. Market Segmentation by Form Factor

10.1 Market segments

Chart on Form Factor - Market share 2025-2030 (%)
Data Table on Form Factor - Market share 2025-2030 (%)

10.2 Comparison by Form Factor

Chart on Comparison by Form Factor
Data Table on Comparison by Form Factor

10.3 Powder - Market size and forecast 2025-2030

Chart on Powder - Market size and forecast 2025-2030 ($ million)
Data Table on Powder - Market size and forecast 2025-2030 ($ million)
Chart on Powder - Year-over-year growth 2025-2030 (%)
Data Table on Powder - Year-over-year growth 2025-2030 (%)

10.4 Liquid - Market size and forecast 2025-2030

Chart on Liquid - Market size and forecast 2025-2030 ($ million)
Data Table on Liquid - Market size and forecast 2025-2030 ($ million)
Chart on Liquid - Year-over-year growth 2025-2030 (%)
Data Table on Liquid - Year-over-year growth 2025-2030 (%)

10.5 Market opportunity by Form Factor

Market opportunity by Form Factor ($ million)
Data Table on Market opportunity by Form Factor ($ million)

11. Customer Landscape

11.1 Customer landscape overview

Analysis of price sensitivity, lifecycle, customer purchase basket, adoption rates, and purchase criteria

12. Geographic Landscape

12.1 Geographic segmentation

Chart on Market share by geography 2025-2030 (%)
Data Table on Market share by geography 2025-2030 (%)

12.2 Geographic comparison

Chart on Geographic comparison
Data Table on Geographic comparison

12.3 North America - Market size and forecast 2025-2030

Chart on North America - Market size and forecast 2025-2030 ($ million)
Data Table on North America - Market size and forecast 2025-2030 ($ million)
Chart on North America - Year-over-year growth 2025-2030 (%)
Data Table on North America - Year-over-year growth 2025-2030 (%)
Chart on Regional Comparison - North America
Data Table on Regional Comparison - North America

12.3.1 US - Market size and forecast 2025-2030

Chart on US - Market size and forecast 2025-2030 ($ million)
Data Table on US - Market size and forecast 2025-2030 ($ million)
Chart on US - Year-over-year growth 2025-2030 (%)
Data Table on US - Year-over-year growth 2025-2030 (%)

12.3.2 Canada - Market size and forecast 2025-2030

Chart on Canada - Market size and forecast 2025-2030 ($ million)
Data Table on Canada - Market size and forecast 2025-2030 ($ million)
Chart on Canada - Year-over-year growth 2025-2030 (%)
Data Table on Canada - Year-over-year growth 2025-2030 (%)

12.3.3 Mexico - Market size and forecast 2025-2030

Chart on Mexico - Market size and forecast 2025-2030 ($ million)
Data Table on Mexico - Market size and forecast 2025-2030 ($ million)
Chart on Mexico - Year-over-year growth 2025-2030 (%)
Data Table on Mexico - Year-over-year growth 2025-2030 (%)

12.4 APAC - Market size and forecast 2025-2030

Chart on APAC - Market size and forecast 2025-2030 ($ million)
Data Table on APAC - Market size and forecast 2025-2030 ($ million)
Chart on APAC - Year-over-year growth 2025-2030 (%)
Data Table on APAC - Year-over-year growth 2025-2030 (%)
Chart on Regional Comparison - APAC
Data Table on Regional Comparison - APAC

12.4.1 China - Market size and forecast 2025-2030

Chart on China - Market size and forecast 2025-2030 ($ million)
Data Table on China - Market size and forecast 2025-2030 ($ million)
Chart on China - Year-over-year growth 2025-2030 (%)
Data Table on China - Year-over-year growth 2025-2030 (%)

12.4.2 Japan - Market size and forecast 2025-2030

Chart on Japan - Market size and forecast 2025-2030 ($ million)
Data Table on Japan - Market size and forecast 2025-2030 ($ million)
Chart on Japan - Year-over-year growth 2025-2030 (%)
Data Table on Japan - Year-over-year growth 2025-2030 (%)

12.4.3 India - Market size and forecast 2025-2030

Chart on India - Market size and forecast 2025-2030 ($ million)
Data Table on India - Market size and forecast 2025-2030 ($ million)
Chart on India - Year-over-year growth 2025-2030 (%)
Data Table on India - Year-over-year growth 2025-2030 (%)

12.4.4 South Korea - Market size and forecast 2025-2030

Chart on South Korea - Market size and forecast 2025-2030 ($ million)
Data Table on South Korea - Market size and forecast 2025-2030 ($ million)
Chart on South Korea - Year-over-year growth 2025-2030 (%)
Data Table on South Korea - Year-over-year growth 2025-2030 (%)

12.4.5 Australia - Market size and forecast 2025-2030

Chart on Australia - Market size and forecast 2025-2030 ($ million)
Data Table on Australia - Market size and forecast 2025-2030 ($ million)
Chart on Australia - Year-over-year growth 2025-2030 (%)
Data Table on Australia - Year-over-year growth 2025-2030 (%)

12.4.6 Indonesia - Market size and forecast 2025-2030

Chart on Indonesia - Market size and forecast 2025-2030 ($ million)
Data Table on Indonesia - Market size and forecast 2025-2030 ($ million)
Chart on Indonesia - Year-over-year growth 2025-2030 (%)
Data Table on Indonesia - Year-over-year growth 2025-2030 (%)

12.5 Europe - Market size and forecast 2025-2030

Chart on Europe - Market size and forecast 2025-2030 ($ million)
Data Table on Europe - Market size and forecast 2025-2030 ($ million)
Chart on Europe - Year-over-year growth 2025-2030 (%)
Data Table on Europe - Year-over-year growth 2025-2030 (%)
Chart on Regional Comparison - Europe
Data Table on Regional Comparison - Europe

12.5.1 Germany - Market size and forecast 2025-2030

Chart on Germany - Market size and forecast 2025-2030 ($ million)
Data Table on Germany - Market size and forecast 2025-2030 ($ million)
Chart on Germany - Year-over-year growth 2025-2030 (%)
Data Table on Germany - Year-over-year growth 2025-2030 (%)

12.5.2 UK - Market size and forecast 2025-2030

Chart on UK - Market size and forecast 2025-2030 ($ million)
Data Table on UK - Market size and forecast 2025-2030 ($ million)
Chart on UK - Year-over-year growth 2025-2030 (%)
Data Table on UK - Year-over-year growth 2025-2030 (%)

12.5.3 France - Market size and forecast 2025-2030

Chart on France - Market size and forecast 2025-2030 ($ million)
Data Table on France - Market size and forecast 2025-2030 ($ million)
Chart on France - Year-over-year growth 2025-2030 (%)
Data Table on France - Year-over-year growth 2025-2030 (%)

12.5.4 Italy - Market size and forecast 2025-2030

Chart on Italy - Market size and forecast 2025-2030 ($ million)
Data Table on Italy - Market size and forecast 2025-2030 ($ million)
Chart on Italy - Year-over-year growth 2025-2030 (%)
Data Table on Italy - Year-over-year growth 2025-2030 (%)

12.5.5 Spain - Market size and forecast 2025-2030

Chart on Spain - Market size and forecast 2025-2030 ($ million)
Data Table on Spain - Market size and forecast 2025-2030 ($ million)
Chart on Spain - Year-over-year growth 2025-2030 (%)
Data Table on Spain - Year-over-year growth 2025-2030 (%)

12.5.6 The Netherlands - Market size and forecast 2025-2030

Chart on The Netherlands - Market size and forecast 2025-2030 ($ million)
Data Table on The Netherlands - Market size and forecast 2025-2030 ($ million)
Chart on The Netherlands - Year-over-year growth 2025-2030 (%)
Data Table on The Netherlands - Year-over-year growth 2025-2030 (%)

12.6 South America - Market size and forecast 2025-2030

Chart on South America - Market size and forecast 2025-2030 ($ million)
Data Table on South America - Market size and forecast 2025-2030 ($ million)
Chart on South America - Year-over-year growth 2025-2030 (%)
Data Table on South America - Year-over-year growth 2025-2030 (%)
Chart on Regional Comparison - South America
Data Table on Regional Comparison - South America

12.6.1 Brazil - Market size and forecast 2025-2030

Chart on Brazil - Market size and forecast 2025-2030 ($ million)
Data Table on Brazil - Market size and forecast 2025-2030 ($ million)
Chart on Brazil - Year-over-year growth 2025-2030 (%)
Data Table on Brazil - Year-over-year growth 2025-2030 (%)

12.6.2 Argentina - Market size and forecast 2025-2030

Chart on Argentina - Market size and forecast 2025-2030 ($ million)
Data Table on Argentina - Market size and forecast 2025-2030 ($ million)
Chart on Argentina - Year-over-year growth 2025-2030 (%)
Data Table on Argentina - Year-over-year growth 2025-2030 (%)

12.6.3 Colombia - Market size and forecast 2025-2030

Chart on Colombia - Market size and forecast 2025-2030 ($ million)
Data Table on Colombia - Market size and forecast 2025-2030 ($ million)
Chart on Colombia - Year-over-year growth 2025-2030 (%)
Data Table on Colombia - Year-over-year growth 2025-2030 (%)

12.7 Middle East and Africa - Market size and forecast 2025-2030

Chart on Middle East and Africa - Market size and forecast 2025-2030 ($ million)
Data Table on Middle East and Africa - Market size and forecast 2025-2030 ($ million)
Chart on Middle East and Africa - Year-over-year growth 2025-2030 (%)
Data Table on Middle East and Africa - Year-over-year growth 2025-2030 (%)
Chart on Regional Comparison - Middle East and Africa
Data Table on Regional Comparison - Middle East and Africa

12.7.1 Saudi Arabia - Market size and forecast 2025-2030

Chart on Saudi Arabia - Market size and forecast 2025-2030 ($ million)
Data Table on Saudi Arabia - Market size and forecast 2025-2030 ($ million)
Chart on Saudi Arabia - Year-over-year growth 2025-2030 (%)
Data Table on Saudi Arabia - Year-over-year growth 2025-2030 (%)

12.7.2 UAE - Market size and forecast 2025-2030

Chart on UAE - Market size and forecast 2025-2030 ($ million)
Data Table on UAE - Market size and forecast 2025-2030 ($ million)
Chart on UAE - Year-over-year growth 2025-2030 (%)
Data Table on UAE - Year-over-year growth 2025-2030 (%)

12.7.3 South Africa - Market size and forecast 2025-2030

Chart on South Africa - Market size and forecast 2025-2030 ($ million)
Data Table on South Africa - Market size and forecast 2025-2030 ($ million)
Chart on South Africa - Year-over-year growth 2025-2030 (%)
Data Table on South Africa - Year-over-year growth 2025-2030 (%)

12.7.4 Israel - Market size and forecast 2025-2030

Chart on Israel - Market size and forecast 2025-2030 ($ million)
Data Table on Israel - Market size and forecast 2025-2030 ($ million)
Chart on Israel - Year-over-year growth 2025-2030 (%)
Data Table on Israel - Year-over-year growth 2025-2030 (%)

12.7.5 Turkey - Market size and forecast 2025-2030

Chart on Turkey - Market size and forecast 2025-2030 ($ million)
Data Table on Turkey - Market size and forecast 2025-2030 ($ million)
Chart on Turkey - Year-over-year growth 2025-2030 (%)
Data Table on Turkey - Year-over-year growth 2025-2030 (%)

12.8 Market opportunity by geography

Market opportunity by geography ($ million)
Data Tables on Market opportunity by geography ($ million)

13. Drivers, Challenges, and Opportunity

13.1 Market drivers

Rising consumer preference for natural and clean label ingredients
Expansions and acquisitions enhancing production capacities
Technological advancements in fermentation and production processes

13.2 Market challenges

Volatility in raw material prices and supply chain disruptions
Stringent regulatory requirements and compliance issues
Growing demand sustainable acidulants amid environmental concerns

13.3 Impact of drivers and challenges

Impact of drivers and challenges in 2025 and 2030

13.4 Market opportunities

Increasing focus on bio-based acidulants
Expansion of production facilities and market presence
Innovation in functional ingredients and applications

14. Competitive Landscape

14.1 Overview

14.2

Overview on criticality of inputs and factors of differentiation

14.3 Landscape disruption

Overview on factors of disruption

14.4 Industry risks

Impact of key risks on business

15. Competitive Analysis

15.1 Companies profiled

Companies covered

15.2 Company ranking index

15.3 Market positioning of companies

Matrix on companies position and classification

15.4 Archer Daniels Midland Co.

Archer Daniels Midland Co. - Overview
Archer Daniels Midland Co. - Business segments
Archer Daniels Midland Co. - Key news
Archer Daniels Midland Co. - Key offerings
Archer Daniels Midland Co. - Segment focus
SWOT

15.5 Arshine Pharmaceutical Co. Ltd.

Arshine Pharmaceutical Co. Ltd. - Overview
Arshine Pharmaceutical Co. Ltd. - Product / Service
Arshine Pharmaceutical Co. Ltd. - Key offerings
SWOT

15.6 Bartek Ingredients Inc.

Bartek Ingredients Inc. - Overview
Bartek Ingredients Inc. - Product / Service
Bartek Ingredients Inc. - Key offerings
SWOT

15.7 Batory Foods

Batory Foods - Overview
Batory Foods - Product / Service
Batory Foods - Key offerings
SWOT

15.8 BRENNTAG SE

BRENNTAG SE - Overview
BRENNTAG SE - Business segments
BRENNTAG SE - Key news
BRENNTAG SE - Key offerings
BRENNTAG SE - Segment focus
SWOT

15.9 Cargill Inc.

Cargill Inc. - Overview
Cargill Inc. - Product / Service
Cargill Inc. - Key offerings
SWOT

15.10 Citribel NV

Citribel NV - Overview
Citribel NV - Product / Service
Citribel NV - Key offerings
SWOT

15.11 Corbion N.V.

Corbion N.V. - Overview
Corbion N.V. - Business segments
Corbion N.V. - Key news
Corbion N.V. - Key offerings
Corbion N.V. - Segment focus
SWOT

15.12 DairyChem

DairyChem - Overview
DairyChem - Product / Service
DairyChem - Key offerings
SWOT

15.13 FBC Industries Inc.

FBC Industries Inc. - Overview
FBC Industries Inc. - Product / Service
FBC Industries Inc. - Key offerings
SWOT

15.14 Grasim Industries Ltd.

Grasim Industries Ltd. - Overview
Grasim Industries Ltd. - Business segments
Grasim Industries Ltd. - Key offerings
Grasim Industries Ltd. - Segment focus
SWOT

15.15 Hawkins Watts Ltd.

Hawkins Watts Ltd. - Overview
Hawkins Watts Ltd. - Product / Service
Hawkins Watts Ltd. - Key offerings
SWOT

15.16 Isegen South Africa Pty Ltd.

Isegen South Africa Pty Ltd. - Overview
Isegen South Africa Pty Ltd. - Product / Service
Isegen South Africa Pty Ltd. - Key offerings
SWOT

15.17 Jungbunzlauer Suisse AG

Jungbunzlauer Suisse AG - Overview
Jungbunzlauer Suisse AG - Product / Service
Jungbunzlauer Suisse AG - Key offerings
SWOT

15.18 Megachem Limited

Megachem Limited - Overview
Megachem Limited - Product / Service
Megachem Limited - Key offerings
SWOT

16. Appendix

16.1 Scope of the report

Market definition
Objectives
Notes and caveats

16.2 Inclusions and exclusions checklist

Inclusions checklist
Exclusions checklist

16.3 Currency conversion rates for US$

16.4 Research methodology

16.5 Data procurement

Information sources

16.6 Data validation

16.7 Validation techniques employed for market sizing

16.8 Data synthesis

16.9 360 degree market analysis

16.10 List of abbreviations

Research Methodology

Technavio presents a detailed picture of the market by way of study, synthesis, and summation of data from multiple sources. The analysts have presented the various facets of the market with a particular focus on identifying the key industry influencers. The data thus presented is comprehensive, reliable, and the result of extensive research, both primary and secondary.

INFORMATION SOURCES

Primary sources

  • Manufacturers and suppliers
  • Channel partners
  • Industry experts
  • Strategic decision makers

Secondary sources

  • Industry journals and periodicals
  • Government data
  • Financial reports of key industry players
  • Historical data
  • Press releases

DATA ANALYSIS

Data Synthesis

  • Collation of data
  • Estimation of key figures
  • Analysis of derived insights

Data Validation

  • Triangulation with data models
  • Reference against proprietary databases
  • Corroboration with industry experts

REPORT WRITING

Qualitative

  • Market drivers
  • Market challenges
  • Market trends
  • Five forces analysis

Quantitative

  • Market size and forecast
  • Market segmentation
  • Geographical insights
  • Competitive landscape

Interested in this report?

Get your sample now to see our research methodology and insights!

Download Now

Frequently Asked Questions

Food Acidulants market growth will increase by USD 2939.8 million during 2026-2030.

The Food Acidulants market is expected to grow at a CAGR of 7.3% during 2026-2030.

Food Acidulants market is segmented by Application (Bakery and confectionery, Beverages, Others) Type (Citric acid, Lactic acid, Others) Form factor (Powder, Liquid)

Archer Daniels Midland Co., Arshine Pharmaceutical Co. Ltd., Bartek Ingredients Inc., Batory Foods, BRENNTAG SE, Cargill Inc., Citribel NV, Corbion N.V., DairyChem, FBC Industries Inc., Grasim Industries Ltd., Hawkins Watts Ltd., Isegen South Africa Pty Ltd., Jungbunzlauer Suisse AG, Megachem Limited, Prinova Group LLC, Suntran Industrial Group Ltd., Univar Solutions Inc., Weifang Ensign Industry Co. are a few of the key vendors in the Food Acidulants market.

North America will register the highest growth rate of 30.8% among the other regions. Therefore, the Food Acidulants market in North America is expected to garner significant business opportunities for the vendors during the forecast period.

US, Canada, Mexico, China, Japan, India, South Korea, Australia, Indonesia, Germany, UK, France, Italy, Spain, The Netherlands, Brazil, Argentina, Colombia, Saudi Arabia, UAE, South Africa, Israel, Turkey

  • Rising consumer preference for natural and clean label ingredients is the driving factor this market.

The Food Acidulants market vendors should focus on grabbing business opportunities from the Application segment as it accounted for the largest market share in the base year.