Malic Acid Market Analysis, Size, and Forecast 2025-2029: North America (US and Mexico), Europe (France and Germany), Middle East and Africa (South Africa), APAC (China, India, Japan, and South Korea), South America (Brazil), and Rest of World (ROW)

Malic Acid Market Analysis, Size, and Forecast 2025-2029:
North America (US and Mexico), Europe (France and Germany), Middle East and Africa (South Africa), APAC (China, India, Japan, and South Korea), South America (Brazil), and Rest of World (ROW)

Published: Jun 2025 232 Pages SKU: IRTNTR74886

Market Overview at a Glance

$70.1 Mn
Market Opportunity
4.9%
CAGR
4.7
YoY growth 2024-2025(%)

Malic Acid Market Size 2025-2029

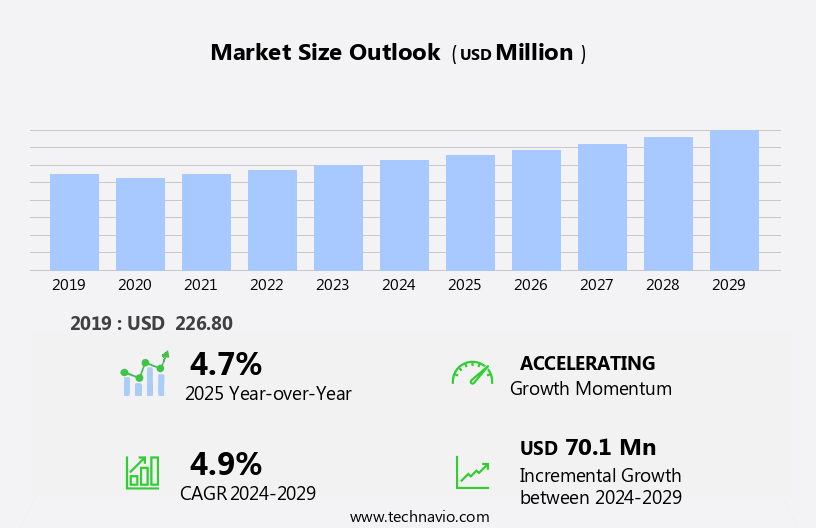
The malic acid market size is forecast to increase by USD 70.1 million, at a CAGR of 4.9% between 2024 and 2029.

  • The market is experiencing significant growth, driven primarily by the increasing demand in the food and beverage industry. Malic acid, a key ingredient in various food and beverage applications, is gaining popularity due to its ability to enhance taste, improve texture, and extend shelf life. Legal factors, such as regulations on food additives and waste management, also impact profit margins. This trend is expected to continue as consumers increasingly seek healthier and more natural food and beverage options. However, the market faces challenges due to the price volatility of raw materials. Malic acid is derived from apples, corn, or other fruits, and the cost of these raw materials can fluctuate significantly based on supply and demand dynamics.
  • This price volatility can impact the profitability of malic acid producers and end-users alike. Additionally, the shift toward bio-based malic acid is gaining momentum as consumers and regulatory bodies push for more sustainable and eco-friendly production methods. Companies seeking to capitalize on market opportunities must navigate these challenges effectively by implementing supply chain strategies, exploring alternative raw materials, and investing in research and development to improve production efficiency and reduce costs. In feed additives, it improves the nutritional value and digestibility of animal feed.

What will be the Size of the Malic Acid Market during the forecast period?

Malic Acid Market Size

Explore in-depth regional segment analysis with market size data - historical 2019-2023 and forecasts 2025-2029 - in the full report.  
Request Free Sample

The market continues to evolve, driven by its diverse applications across various sectors. L-malic acid, a key player in the market, finds extensive use in food and beverage industries as a flavor enhancer and food preservative. In the dairy and meat sectors, malic acid is employed for ph control and improving shelf life. Simultaneously, its role extends to dietary supplements, where it serves as a chelating agent and aids in enhancing nutrient absorption. Beyond food and beverage applications, malic acid's significance is felt in the pharmaceutical industry, where it is used as a pH control agent and in the production of certain drugs.

The renewable resources-based production of malic acid is gaining traction, offering a sustainable alternative to chemical synthesis. Moreover, malic acid's applications stretch to animal nutrition, personal care products, and even in the production of fumaric acid. The ongoing focus on safety standards and quality control ensures that malic acid production remains a priority for manufacturers. Gas chromatography plays a crucial role in the analysis and purification processes of malic acid, ensuring its consistent quality. Malic acid's role in ph control and food preservation continues to be a significant factor in its demand, with the environmental impact of production being a growing concern.

The market dynamics of malic acid are influenced by various factors, including the availability of raw materials, technological advancements, and regulatory requirements. The evolving nature of these factors necessitates continuous adaptation and innovation in the malic acid industry.

How is this Malic Acid Industry segmented?

The malic acid industry research report provides comprehensive data (region-wise segment analysis), with forecasts and estimates in "USD million" for the period 2025-2029, as well as historical data from 2019-2023 for the following segments.

  • Product
    • L-malic acid
    • Dl-malic acid
    • D-malic acid
  • Application
    • Beverages
    • Confectionaries and food
    • Personal care and cosmetics
    • Others
  • End-user
    • Food and beverage processing
    • Pharmaceuticals industry
    • Animal feed industry
  • Geography
    • North America
      • US
      • Mexico
    • Europe
      • France
      • Germany
    • Middle East and Africa
      • South Africa
    • APAC
      • China
      • India
      • Japan
      • South Korea
    • South America
      • Brazil
    • Rest of World (ROW)

By Product Insights

The L-malic acid segment is estimated to witness significant growth during the forecast period. L-malic acid, the levorotatory isomer of malic acid, is a naturally occurring organic compound found in various fruits, including apples and grapes. This optically active compound is biocompatible and widely utilized across several industries, particularly food and beverages, pharmaceuticals, and cosmetics. In the food and beverage sector, L-malic acid functions as a flavor enhancer, improving taste profiles in candies, fruit juices, and wines with its smooth sourness and stability. In the pharmaceutical industry, it is a key ingredient in effervescent tablets and syrups, offering both functional additives and sensory benefits. The cosmetics industry values L-malic acid as a gentle alpha hydroxy acid (AHA), prized for its exfoliating properties and compatibility with sensitive skin formulations.

Food grade L-malic acid is produced through various purification processes, including chemical synthesis and enzymatic synthesis. It is used in food preservation to extend shelf life and enhance safety standards. Malic acid production also involves the use of renewable resources, such as agricultural sources, to minimize environmental impact. In the food and beverage industry, L-malic acid is often used in conjunction with other flavor enhancers, such as tartaric acid and citric acid, to create complex taste profiles. In dairy products and meat products, L-malic acid acts as a chelating agent, enhancing the nutritional value and improving the overall quality of the final product.

L-malic acid is also used in animal nutrition as a feed additive, contributing to improved digestion and growth. In the pharmaceutical sector, L-malic acid is used in the production of various pharmaceutical applications, including dietary supplements and oral care products. The supply chain for L-malic acid involves various stakeholders, including manufacturers, distributors, and end-users, ensuring a consistent and reliable supply of this versatile compound. Pharmaceutical grade L-malic acid is produced under stringent quality control measures, ensuring purity and consistency. It is used in various pharmaceutical applications, including as a pH control agent and a chelating agent. Fumaric acid, another organic compound, is sometimes used in combination with L-malic acid to enhance its functionality.

L-malic acid is a versatile and valuable compound with applications in various industries, including food and beverages, pharmaceuticals, and cosmetics. Its production involves various purification processes, including chemical synthesis and enzymatic synthesis, and the use of renewable resources to minimize environmental impact. Its functional properties, such as its ability to act as a chelating agent and a pH control agent, make it a valuable addition to various products, from food and beverages to pharmaceuticals and cosmetics. The supply chain for L-malic acid involves various stakeholders, ensuring a consistent and reliable supply of this important compound.

Malic Acid Market Size

Request Free Sample

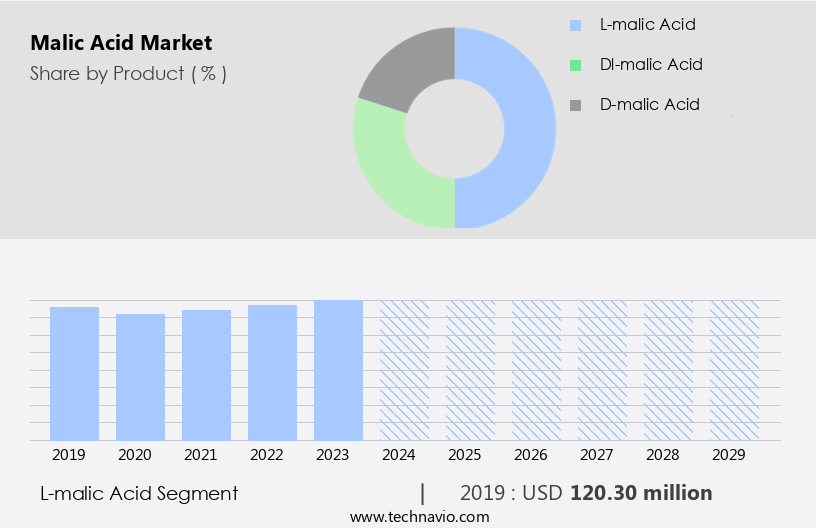
The L-malic acid segment was valued at USD 120.30 million in 2019 and showed a gradual increase during the forecast period.

Regional Analysis

APAC is estimated to contribute 45% to the growth of the global market during the forecast period.Technavio's analysts have elaborately explained the regional trends and drivers that shape the market during the forecast period.

Malic Acid Market Share by Geography

 Request Free Sample

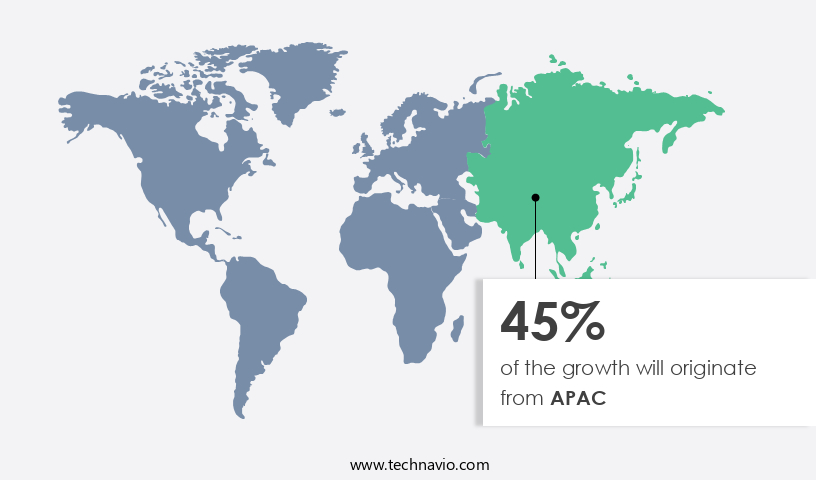
The market is experiencing significant growth, with the Asia-Pacific (APAC) region leading the charge. Rapid industrialization and expanding sectors in food and pharmaceuticals are key drivers of this trend. China, in particular, plays a pivotal role, serving as both the largest producer and consumer of malic acid. In 2024, China accounted for approximately half of the world's malic acid and lactic acid production, encompassing both synthetic (DL-malic acid) and natural (L-malic acid) forms. The food production sector in China grew by 2.9% in value in 2023, surpassing average industrial growth. Malic acid is used extensively in food applications, including as a flavor enhancer in dairy products, meat products, and bakery items, as well as a preservative in beverages and fruit juices.

It also finds use in pharmaceutical applications, animal nutrition, and personal care products. Malic acid can be produced through various methods, including chemical synthesis and enzymatic synthesis, with renewable resources increasingly being utilized to reduce environmental impact. Malic acid production requires stringent quality control measures, including ph control and safety standards, to ensure product purity and safety. Additionally, malic acid functions as a chelating agent, extending the shelf life of various products. The market's growth is further fueled by its use as a feed additive and its potential applications in fumaric acid production. The global malic acid supply chain is complex, with various players involved in production, distribution, and sales.

Market Dynamics

Our researchers analyzed the data with 2024 as the base year, along with the key drivers, trends, and challenges. A holistic analysis of drivers will help companies refine their marketing strategies to gain a competitive advantage.

What are the key market drivers leading to the rise in the adoption of Malic Acid Industry?

  • The food and beverage industry's expanding demand serves as the primary market driver. The food and beverage sector holds significant market share due to malic acid's ability to provide a tart, fruit-like taste profile, making it an ideal ingredient for processed foods and beverages. This trend is particularly noticeable among younger demographics, who exhibit a growing preference for sour and tangy flavors. Consequently, malic acid is extensively used in confectionery, dairy, and beverage products, including sour gummies, hard candies, and flavored carbonated drinks. Beyond food and beverage applications, malic acid finds use in other industries such as animal nutrition, pharmaceuticals, and personal care products.
  • In animal nutrition, it functions as a feed additive, contributing to improved digestion and growth. In pharmaceuticals, it serves as an intermediate in the synthesis of various drugs. Lastly, in personal care products, malic acid acts as a preservative and pH adjuster. Two primary production methods exist for malic acid: chemical synthesis and enzymatic synthesis. Chemical synthesis involves the reaction of ethylene glycol and carbon dioxide, while enzymatic synthesis uses malic acid dehydrogenase to convert malate to malic acid. The choice of production method depends on factors such as cost, yield, and environmental impact.

What are the market trends shaping the Malic Acid Industry?

  • The trend in the market is moving towards the use of bio-based malic acid. The market is experiencing a significant shift towards bio-based production using renewable resources. This trend is driven by increasing consumer and regulatory demand for sustainable ingredients in the food, pharmaceutical, and personal care industries. Bio-based malic acid, specifically the L-isomer, is gaining popularity as a viable alternative to synthetically produced variants, offering comparable functionality with reduced ecological impact. Anhui Huaheng Biological Co., Ltd. Recently introduced a low-carbon, bio-based L-malic acid using advanced fermentation technology. This innovation aligns with global sustainability goals and supports the growing preference for green consumption. Gas chromatography is used extensively in the production and quality control of malic acid to ensure ph control and maintain safety standards.
  • The bio-based production method also enhances the overall quality of the product. The shift towards renewable resources is expected to continue, as it aligns with the global move towards sustainable and eco-friendly production methods. The use of bio-based malic acid not only benefits the environment but also offers competitive advantages in terms of brand image and consumer preference. In summary, malic acid is a versatile organic compound with a wide range of applications across various industries. Its role as a flavor enhancer and acidulant in the food and beverage sector continues to drive demand, while its use in animal nutrition, pharmaceuticals, and personal care products further expands its market potential. Both chemical synthesis and enzymatic synthesis offer viable production methods, each with its advantages and considerations.

What challenges does the Malic Acid Industry face during its growth?

  • The price volatility of raw materials poses a significant challenge to the industry, potentially impeding its growth and requiring robust supply chain management strategies to mitigate potential risks. The market is influenced by several factors, primarily the price volatility of key raw materials. Synthetic malic acid, derived from maleic anhydride, is subject to fluctuations in crude oil markets. Geopolitical tensions, supply chain disruptions, and energy market instability can lead to unpredictable cost increases, posing challenges for manufacturers in terms of budget planning and procurement strategies. Natural malic acid, sourced from fruits, is also subject to seasonal variability and agricultural uncertainties. Malic acid is a widely used chelating agent in various industries, including food preservation and feed additives.
  • Malic acid is also used in the pharmaceutical industry as a stabilizer and excipient. Despite these challenges, the demand for malic acid remains strong due to its essential role in various applications. The market is expected to continue growing, driven by increasing consumer awareness of food safety and the need for sustainable and natural food preservatives. However, efforts to reduce the environmental impact of malic acid production and use are gaining momentum, with a focus on developing more sustainable production methods and reducing waste. In food preservation, it acts as a sequestrant, preventing the formation of unwanted chemical reactions and extending the shelf life of food products.

Exclusive Customer Landscape

The malic acid market forecasting report includes the adoption lifecycle of the market, covering from the innovator's stage to the laggard's stage. It focuses on adoption rates in different regions based on penetration. Furthermore, the malic acid market report also includes key purchase criteria and drivers of price sensitivity to help companies evaluate and develop their market growth analysis strategies.
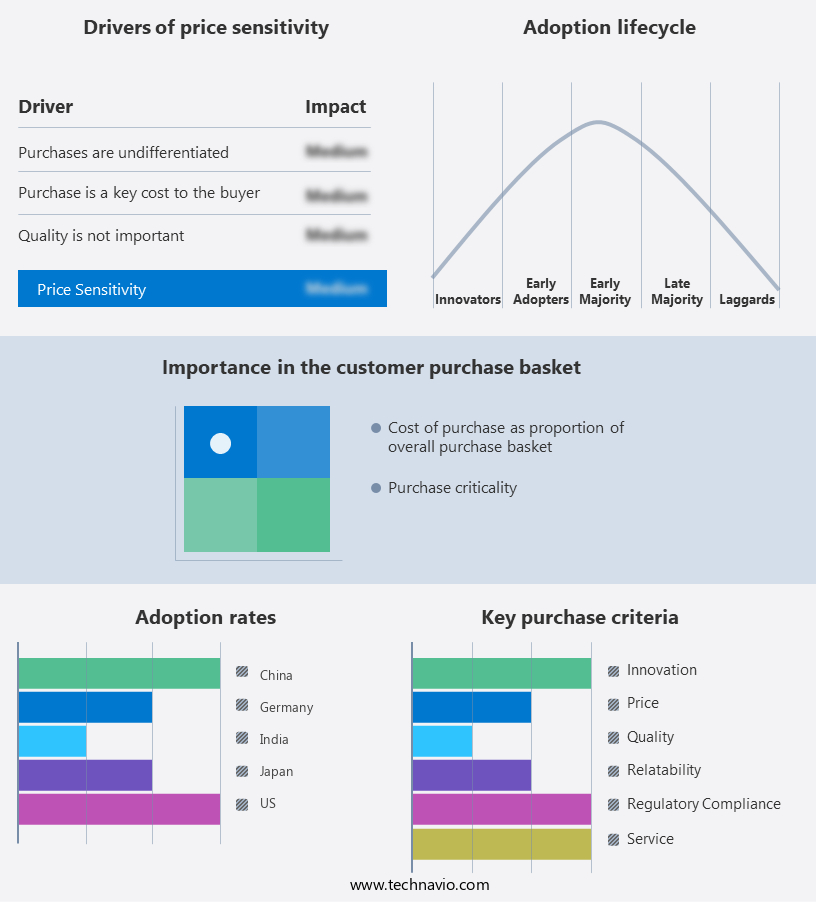
Malic Acid Market Share by Geography

 Customer Landscape

Key Companies & Market Insights

Companies are implementing various strategies, such as strategic alliances, malic acid market forecast, partnerships, mergers and acquisitions, geographical expansion, and product/service launches, to enhance their presence in the industry.

Anhui Sealong Biotechnology Co. Ltd. - The company specializes in providing malic acid, including DL-malic acid, as a functional additive for various industries.

The industry research and growth report includes detailed analyses of the competitive landscape of the market and information about key companies, including:

  • Anhui Sealong Biotechnology Co. Ltd.
  • Bartek Ingredients Inc.
  • Changmao Biochemical Engineering Co. Ltd.
  • Corbion N.V.
  • Fuso Chemical Co. Ltd.
  • Guangzhou ZIO Chemical Co. Ltd
  • Isegen South Africa Pty Ltd.
  • Lonza Group Ltd.
  • Muby Chem Ltd.
  • NACALAI TESQUE INC
  • Nanjing Lile Biotechnology Co. Ltd
  • Polynt SpA
  • Prinova Group LLC
  • Thirumalai Chemicals Ltd.
  • YONGSAN CHEMICALS
  • Zhonglan Industry Co. Ltd.

Qualitative and quantitative analysis of companies has been conducted to help clients understand the wider business environment as well as the strengths and weaknesses of key industry players. Data is qualitatively analyzed to categorize companies as pure play, category-focused, industry-focused, and diversified; it is quantitatively analyzed to categorize companies as dominant, leading, strong, tentative, and weak.

Recent Development and News in Malic Acid Market

  • In January 2024, DuPont Nutrition & Biosciences, a leading global biotech company, announced the expansion of its malic acid production capacity at its manufacturing site in Tate, Georgia, USA. This expansion aimed to meet the growing demand for malic acid in the food and beverage industry (DuPont Press Release, 2024).
  • In March 2024, Archer Daniels Midland Company (ADM) and BioAmber Inc., a leading producer of renewable chemicals, entered into a strategic partnership to produce bio-malic acid. This collaboration aimed to commercialize bio-malic acid, a sustainable alternative to conventionally produced malic acid (ADM Press Release, 2024).
  • In May 2024, Corbion, a leading biobased technology company, announced the acquisition of Verenium, a US-based industrial biotech company. This acquisition strengthened Corbion's position in the market, providing access to Verenium's proprietary fermentation technology (Corbion Press Release, 2024).
  • In April 2025, the European Food Safety Authority (EFSA) re-evaluated malic acid and confirmed its safety for use as a food additive. This approval boosted market confidence in malic acid's safety and regulatory compliance (EFSA Press Release, 2025).

Research Analyst Overview

In the market, sales volume is influenced by various factors, including applications in cosmetics, health benefits, and consumer preferences. Environmental factors play a significant role in market dynamics, with a growing emphasis on sustainable production and reducing the carbon footprint. Technological advancements, including emerging sensory analysis techniques and circular economy practices, are shaping the competitive landscape analysis. Economic factors, political instability, and social trends are additional influences on market growth. Salt formation during production and nutritional value are key considerations for manufacturers seeking to differentiate their brands and build customer loyalty. The antioxidant properties of malic acid contribute to its popularity in various industries, from food and beverages to pharmaceuticals.

The future outlook for the market is promising, with ongoing research into new applications and production methods. Distribution channels continue to evolve, with e-commerce and direct-to-consumer models gaining traction. Overall, the market is a complex and dynamic arena, shaped by a diverse range of factors. The Malic Acid Market is evolving rapidly due to shifting flavor profiles demanded by consumers across regions. Rising production costs push manufacturers to seek efficiency, while brands focus on building brand loyalty and strategic customer acquisition. Regional differences influence application trends, especially in food and beverage industries. Broader political factors and social factors from regulatory policies to lifestyle shifts also shape market dynamics. Meanwhile, technological factors like advanced processing and emerging technologies in fermentation and bio-based production are opening new frontiers.

Dive into Technavio's robust research methodology, blending expert interviews, extensive data synthesis, and validated models for unparalleled Malic Acid Market insights. See full methodology.

Market Scope

Report Coverage

Details

Page number

232

Base year

2024

Historic period

2019-2023

Forecast period

2025-2029

Growth momentum & CAGR

Accelerate at a CAGR of 4.9%

Market growth 2025-2029

USD 70.1 million

Market structure

Fragmented

YoY growth 2024-2025(%)

4.7

Key countries

China, US, India, Germany, Mexico, Japan, France, South Korea, Brazil, and South Africa

Competitive landscape

Leading Companies, Market Positioning of Companies, Competitive Strategies, and Industry Risks

Request Free Sample

What are the Key Data Covered in this Malic Acid Market Research and Growth Report?

  • CAGR of the Malic Acid industry during the forecast period
  • Detailed information on factors that will drive the growth and forecasting between 2025 and 2029
  • Precise estimation of the size of the market and its contribution of the industry in focus to the parent market
  • Accurate predictions about upcoming growth and trends and changes in consumer behaviour
  • Growth of the market across APAC, North America, Europe, South America, and Middle East and Africa
  • Thorough analysis of the market's competitive landscape and detailed information about companies
  • Comprehensive analysis of factors that will challenge the malic acid market growth of industry companies

We can help! Our analysts can customize this malic acid market research report to meet your requirements.

Get in touch

1 Executive Summary

  • 1.1 Market overview
    • Executive Summary - Chart on Market Overview
    • Executive Summary - Data Table on Market Overview
    • Executive Summary - Chart on Global Market Characteristics
    • Executive Summary - Chart on Market by Geography
    • Executive Summary - Chart on Market Segmentation by Product
    • Executive Summary - Chart on Market Segmentation by Application
    • Executive Summary - Chart on Market Segmentation by End-user
    • Executive Summary - Chart on Incremental Growth
    • Executive Summary - Data Table on Incremental Growth
    • Executive Summary - Chart on Company Market Positioning

2 Technavio Analysis

  • 2.1 Analysis of price sensitivity, lifecycle, customer purchase basket, adoption rates, and purchase criteria
    • Analysis of price sensitivity, lifecycle, customer purchase basket, adoption rates, and purchase criteria
  • 2.2 Criticality of inputs and Factors of differentiation
    • Overview on criticality of inputs and factors of differentiation
  • 2.3 Factors of disruption
    • Overview on factors of disruption
  • 2.4 Impact of drivers and challenges
    • Impact of drivers and challenges in 2024 and 2029

3 Market Landscape

  • 3.1 Market ecosystem
    • Parent Market
    • Data Table on - Parent Market
  • 3.2 Market characteristics
    • Market characteristics analysis
  • 3.3 Value chain analysis
    • Value chain analysis

4 Market Sizing

  • 4.1 Market definition
    • Offerings of companies included in the market definition
  • 4.2 Market segment analysis
    • Market segments
  • 4.3 Market size 2024
    • 4.4 Market outlook: Forecast for 2024-2029
      • Chart on Global - Market size and forecast 2024-2029 ($ million)
      • Data Table on Global - Market size and forecast 2024-2029 ($ million)
      • Chart on Global Market: Year-over-year growth 2024-2029 (%)
      • Data Table on Global Market: Year-over-year growth 2024-2029 (%)

    5 Historic Market Size

    • 5.1 Global Malic Acid Market 2019 - 2023
      • Historic Market Size - Data Table on Global Malic Acid Market 2019 - 2023 ($ million)
    • 5.2 Product segment analysis 2019 - 2023
      • Historic Market Size - Product Segment 2019 - 2023 ($ million)
    • 5.3 Application segment analysis 2019 - 2023
      • Historic Market Size - Application Segment 2019 - 2023 ($ million)
    • 5.4 End-user segment analysis 2019 - 2023
      • Historic Market Size - End-user Segment 2019 - 2023 ($ million)
    • 5.5 Geography segment analysis 2019 - 2023
      • Historic Market Size - Geography Segment 2019 - 2023 ($ million)
    • 5.6 Country segment analysis 2019 - 2023
      • Historic Market Size - Country Segment 2019 - 2023 ($ million)

    6 Qualitative Analysis

    • 6.1 Impact Analysis of U.S. Tariffs on Global Malic Acid Market

      7 Five Forces Analysis

      • 7.1 Five forces summary
        • Five forces analysis - Comparison between 2024 and 2029
      • 7.2 Bargaining power of buyers
        • Bargaining power of buyers - Impact of key factors 2024 and 2029
      • 7.3 Bargaining power of suppliers
        • Bargaining power of suppliers - Impact of key factors in 2024 and 2029
      • 7.4 Threat of new entrants
        • Threat of new entrants - Impact of key factors in 2024 and 2029
      • 7.5 Threat of substitutes
        • Threat of substitutes - Impact of key factors in 2024 and 2029
      • 7.6 Threat of rivalry
        • Threat of rivalry - Impact of key factors in 2024 and 2029
      • 7.7 Market condition
        • Chart on Market condition - Five forces 2024 and 2029

      8 Market Segmentation by Product

      • 8.1 Market segments
        • Chart on Product - Market share 2024-2029 (%)
        • Data Table on Product - Market share 2024-2029 (%)
      • 8.2 Comparison by Product
        • Chart on Comparison by Product
        • Data Table on Comparison by Product
      • 8.3 L-malic acid - Market size and forecast 2024-2029
        • Chart on L-malic acid - Market size and forecast 2024-2029 ($ million)
        • Data Table on L-malic acid - Market size and forecast 2024-2029 ($ million)
        • Chart on L-malic acid - Year-over-year growth 2024-2029 (%)
        • Data Table on L-malic acid - Year-over-year growth 2024-2029 (%)
      • 8.4 Dl-malic acid - Market size and forecast 2024-2029
        • Chart on Dl-malic acid - Market size and forecast 2024-2029 ($ million)
        • Data Table on Dl-malic acid - Market size and forecast 2024-2029 ($ million)
        • Chart on Dl-malic acid - Year-over-year growth 2024-2029 (%)
        • Data Table on Dl-malic acid - Year-over-year growth 2024-2029 (%)
      • 8.5 D-malic acid - Market size and forecast 2024-2029
        • Chart on D-malic acid - Market size and forecast 2024-2029 ($ million)
        • Data Table on D-malic acid - Market size and forecast 2024-2029 ($ million)
        • Chart on D-malic acid - Year-over-year growth 2024-2029 (%)
        • Data Table on D-malic acid - Year-over-year growth 2024-2029 (%)
      • 8.6 Market opportunity by Product
        • Market opportunity by Product ($ million)
        • Data Table on Market opportunity by Product ($ million)

      9 Market Segmentation by Application

      • 9.1 Market segments
        • Chart on Application - Market share 2024-2029 (%)
        • Data Table on Application - Market share 2024-2029 (%)
      • 9.2 Comparison by Application
        • Chart on Comparison by Application
        • Data Table on Comparison by Application
      • 9.3 Beverages - Market size and forecast 2024-2029
        • Chart on Beverages - Market size and forecast 2024-2029 ($ million)
        • Data Table on Beverages - Market size and forecast 2024-2029 ($ million)
        • Chart on Beverages - Year-over-year growth 2024-2029 (%)
        • Data Table on Beverages - Year-over-year growth 2024-2029 (%)
      • 9.4 Confectionaries and food - Market size and forecast 2024-2029
        • Chart on Confectionaries and food - Market size and forecast 2024-2029 ($ million)
        • Data Table on Confectionaries and food - Market size and forecast 2024-2029 ($ million)
        • Chart on Confectionaries and food - Year-over-year growth 2024-2029 (%)
        • Data Table on Confectionaries and food - Year-over-year growth 2024-2029 (%)
      • 9.5 Personal care and cosmetics - Market size and forecast 2024-2029
        • Chart on Personal care and cosmetics - Market size and forecast 2024-2029 ($ million)
        • Data Table on Personal care and cosmetics - Market size and forecast 2024-2029 ($ million)
        • Chart on Personal care and cosmetics - Year-over-year growth 2024-2029 (%)
        • Data Table on Personal care and cosmetics - Year-over-year growth 2024-2029 (%)
      • 9.6 Others - Market size and forecast 2024-2029
        • Chart on Others - Market size and forecast 2024-2029 ($ million)
        • Data Table on Others - Market size and forecast 2024-2029 ($ million)
        • Chart on Others - Year-over-year growth 2024-2029 (%)
        • Data Table on Others - Year-over-year growth 2024-2029 (%)
      • 9.7 Market opportunity by Application
        • Market opportunity by Application ($ million)
        • Data Table on Market opportunity by Application ($ million)

      10 Market Segmentation by End-user

      • 10.1 Market segments
        • Chart on End-user - Market share 2024-2029 (%)
        • Data Table on End-user - Market share 2024-2029 (%)
      • 10.2 Comparison by End-user
        • Chart on Comparison by End-user
        • Data Table on Comparison by End-user
      • 10.3 Food and beverage processing - Market size and forecast 2024-2029
        • Chart on Food and beverage processing - Market size and forecast 2024-2029 ($ million)
        • Data Table on Food and beverage processing - Market size and forecast 2024-2029 ($ million)
        • Chart on Food and beverage processing - Year-over-year growth 2024-2029 (%)
        • Data Table on Food and beverage processing - Year-over-year growth 2024-2029 (%)
      • 10.4 Pharmaceuticals industry - Market size and forecast 2024-2029
        • Chart on Pharmaceuticals industry - Market size and forecast 2024-2029 ($ million)
        • Data Table on Pharmaceuticals industry - Market size and forecast 2024-2029 ($ million)
        • Chart on Pharmaceuticals industry - Year-over-year growth 2024-2029 (%)
        • Data Table on Pharmaceuticals industry - Year-over-year growth 2024-2029 (%)
      • 10.5 Animal feed industry - Market size and forecast 2024-2029
        • Chart on Animal feed industry - Market size and forecast 2024-2029 ($ million)
        • Data Table on Animal feed industry - Market size and forecast 2024-2029 ($ million)
        • Chart on Animal feed industry - Year-over-year growth 2024-2029 (%)
        • Data Table on Animal feed industry - Year-over-year growth 2024-2029 (%)
      • 10.6 Market opportunity by End-user
        • Market opportunity by End-user ($ million)
        • Data Table on Market opportunity by End-user ($ million)

      11 Customer Landscape

      • 11.1 Customer landscape overview
        • Analysis of price sensitivity, lifecycle, customer purchase basket, adoption rates, and purchase criteria

      12 Geographic Landscape

      • 12.1 Geographic segmentation
        • Chart on Market share by geography 2024-2029 (%)
        • Data Table on Market share by geography 2024-2029 (%)
      • 12.2 Geographic comparison
        • Chart on Geographic comparison
        • Data Table on Geographic comparison
      • 12.3 APAC - Market size and forecast 2024-2029
        • Chart on APAC - Market size and forecast 2024-2029 ($ million)
        • Data Table on APAC - Market size and forecast 2024-2029 ($ million)
        • Chart on APAC - Year-over-year growth 2024-2029 (%)
        • Data Table on APAC - Year-over-year growth 2024-2029 (%)
      • 12.4 North America - Market size and forecast 2024-2029
        • Chart on North America - Market size and forecast 2024-2029 ($ million)
        • Data Table on North America - Market size and forecast 2024-2029 ($ million)
        • Chart on North America - Year-over-year growth 2024-2029 (%)
        • Data Table on North America - Year-over-year growth 2024-2029 (%)
      • 12.5 Europe - Market size and forecast 2024-2029
        • Chart on Europe - Market size and forecast 2024-2029 ($ million)
        • Data Table on Europe - Market size and forecast 2024-2029 ($ million)
        • Chart on Europe - Year-over-year growth 2024-2029 (%)
        • Data Table on Europe - Year-over-year growth 2024-2029 (%)
      • 12.6 South America - Market size and forecast 2024-2029
        • Chart on South America - Market size and forecast 2024-2029 ($ million)
        • Data Table on South America - Market size and forecast 2024-2029 ($ million)
        • Chart on South America - Year-over-year growth 2024-2029 (%)
        • Data Table on South America - Year-over-year growth 2024-2029 (%)
      • 12.7 Middle East and Africa - Market size and forecast 2024-2029
        • Chart on Middle East and Africa - Market size and forecast 2024-2029 ($ million)
        • Data Table on Middle East and Africa - Market size and forecast 2024-2029 ($ million)
        • Chart on Middle East and Africa - Year-over-year growth 2024-2029 (%)
        • Data Table on Middle East and Africa - Year-over-year growth 2024-2029 (%)
      • 12.8 China - Market size and forecast 2024-2029
        • Chart on China - Market size and forecast 2024-2029 ($ million)
        • Data Table on China - Market size and forecast 2024-2029 ($ million)
        • Chart on China - Year-over-year growth 2024-2029 (%)
        • Data Table on China - Year-over-year growth 2024-2029 (%)
      • 12.9 US - Market size and forecast 2024-2029
        • Chart on US - Market size and forecast 2024-2029 ($ million)
        • Data Table on US - Market size and forecast 2024-2029 ($ million)
        • Chart on US - Year-over-year growth 2024-2029 (%)
        • Data Table on US - Year-over-year growth 2024-2029 (%)
      • 12.10 India - Market size and forecast 2024-2029
        • Chart on India - Market size and forecast 2024-2029 ($ million)
        • Data Table on India - Market size and forecast 2024-2029 ($ million)
        • Chart on India - Year-over-year growth 2024-2029 (%)
        • Data Table on India - Year-over-year growth 2024-2029 (%)
      • 12.11 Germany - Market size and forecast 2024-2029
        • Chart on Germany - Market size and forecast 2024-2029 ($ million)
        • Data Table on Germany - Market size and forecast 2024-2029 ($ million)
        • Chart on Germany - Year-over-year growth 2024-2029 (%)
        • Data Table on Germany - Year-over-year growth 2024-2029 (%)
      • 12.12 Mexico - Market size and forecast 2024-2029
        • Chart on Mexico - Market size and forecast 2024-2029 ($ million)
        • Data Table on Mexico - Market size and forecast 2024-2029 ($ million)
        • Chart on Mexico - Year-over-year growth 2024-2029 (%)
        • Data Table on Mexico - Year-over-year growth 2024-2029 (%)
      • 12.13 Japan - Market size and forecast 2024-2029
        • Chart on Japan - Market size and forecast 2024-2029 ($ million)
        • Data Table on Japan - Market size and forecast 2024-2029 ($ million)
        • Chart on Japan - Year-over-year growth 2024-2029 (%)
        • Data Table on Japan - Year-over-year growth 2024-2029 (%)
      • 12.14 France - Market size and forecast 2024-2029
        • Chart on France - Market size and forecast 2024-2029 ($ million)
        • Data Table on France - Market size and forecast 2024-2029 ($ million)
        • Chart on France - Year-over-year growth 2024-2029 (%)
        • Data Table on France - Year-over-year growth 2024-2029 (%)
      • 12.15 South Korea - Market size and forecast 2024-2029
        • Chart on South Korea - Market size and forecast 2024-2029 ($ million)
        • Data Table on South Korea - Market size and forecast 2024-2029 ($ million)
        • Chart on South Korea - Year-over-year growth 2024-2029 (%)
        • Data Table on South Korea - Year-over-year growth 2024-2029 (%)
      • 12.16 Brazil - Market size and forecast 2024-2029
        • Chart on Brazil - Market size and forecast 2024-2029 ($ million)
        • Data Table on Brazil - Market size and forecast 2024-2029 ($ million)
        • Chart on Brazil - Year-over-year growth 2024-2029 (%)
        • Data Table on Brazil - Year-over-year growth 2024-2029 (%)
      • 12.17 South Africa - Market size and forecast 2024-2029
        • Chart on South Africa - Market size and forecast 2024-2029 ($ million)
        • Data Table on South Africa - Market size and forecast 2024-2029 ($ million)
        • Chart on South Africa - Year-over-year growth 2024-2029 (%)
        • Data Table on South Africa - Year-over-year growth 2024-2029 (%)
      • 12.18 Market opportunity by geography
        • Market opportunity by geography ($ million)
        • Data Tables on Market opportunity by geography ($ million)

      13 Drivers, Challenges, and Opportunity/Restraints

      • 13.1 Market drivers
        • 13.2 Market challenges
          • 13.3 Impact of drivers and challenges
            • Impact of drivers and challenges in 2024 and 2029
          • 13.4 Market opportunities/restraints

            14 Competitive Landscape

            • 14.1 Overview
              • 14.2 Competitive Landscape
                • Overview on criticality of inputs and factors of differentiation
              • 14.3 Landscape disruption
                • Overview on factors of disruption
              • 14.4 Industry risks
                • Impact of key risks on business

              15 Competitive Analysis

              • 15.1 Companies profiled
                • Companies covered
              • 15.2 Company ranking index
                • Company ranking index
              • 15.3 Market positioning of companies
                • Matrix on companies position and classification
              • 15.4 Anhui Sealong Biotechnology Co. Ltd.
                • Anhui Sealong Biotechnology Co. Ltd. - Overview
                • Anhui Sealong Biotechnology Co. Ltd. - Product / Service
                • Anhui Sealong Biotechnology Co. Ltd. - Key offerings
                • SWOT
              • 15.5 Bartek Ingredients Inc.
                • Bartek Ingredients Inc. - Overview
                • Bartek Ingredients Inc. - Product / Service
                • Bartek Ingredients Inc. - Key offerings
                • SWOT
              • 15.6 Changmao Biochemical Engineering Co. Ltd.
                • Changmao Biochemical Engineering Co. Ltd. - Overview
                • Changmao Biochemical Engineering Co. Ltd. - Product / Service
                • Changmao Biochemical Engineering Co. Ltd. - Key offerings
                • SWOT
              • 15.7 Corbion N.V.
                • Corbion N.V. - Overview
                • Corbion N.V. - Business segments
                • Corbion N.V. - Key news
                • Corbion N.V. - Key offerings
                • Corbion N.V. - Segment focus
                • SWOT
              • 15.8 Fuso Chemical Co. Ltd.
                • Fuso Chemical Co. Ltd. - Overview
                • Fuso Chemical Co. Ltd. - Product / Service
                • Fuso Chemical Co. Ltd. - Key offerings
                • SWOT
              • 15.9 Isegen South Africa Pty Ltd.
                • Isegen South Africa Pty Ltd. - Overview
                • Isegen South Africa Pty Ltd. - Product / Service
                • Isegen South Africa Pty Ltd. - Key offerings
                • SWOT
              • 15.10 Lonza Group Ltd.
                • Lonza Group Ltd. - Overview
                • Lonza Group Ltd. - Business segments
                • Lonza Group Ltd. - Key news
                • Lonza Group Ltd. - Key offerings
                • Lonza Group Ltd. - Segment focus
                • SWOT
              • 15.11 Muby Chem Ltd.
                • Muby Chem Ltd. - Overview
                • Muby Chem Ltd. - Product / Service
                • Muby Chem Ltd. - Key offerings
                • SWOT
              • 15.12 NACALAI TESQUE INC
                • NACALAI TESQUE INC - Overview
                • NACALAI TESQUE INC - Product / Service
                • NACALAI TESQUE INC - Key offerings
                • SWOT
              • 15.13 Nanjing Lile Biotechnology Co. Ltd
                • Nanjing Lile Biotechnology Co. Ltd - Overview
                • Nanjing Lile Biotechnology Co. Ltd - Product / Service
                • Nanjing Lile Biotechnology Co. Ltd - Key offerings
                • SWOT
              • 15.14 Polynt SpA
                • Polynt SpA - Overview
                • Polynt SpA - Product / Service
                • Polynt SpA - Key offerings
                • SWOT
              • 15.15 Prinova Group LLC
                • Prinova Group LLC - Overview
                • Prinova Group LLC - Product / Service
                • Prinova Group LLC - Key offerings
                • SWOT
              • 15.16 Thirumalai Chemicals Ltd.
                • Thirumalai Chemicals Ltd. - Overview
                • Thirumalai Chemicals Ltd. - Product / Service
                • Thirumalai Chemicals Ltd. - Key offerings
                • SWOT
              • 15.17 YONGSAN CHEMICALS
                • YONGSAN CHEMICALS - Overview
                • YONGSAN CHEMICALS - Product / Service
                • YONGSAN CHEMICALS - Key offerings
                • SWOT
              • 15.18 Zhonglan Industry Co. Ltd.
                • Zhonglan Industry Co. Ltd. - Overview
                • Zhonglan Industry Co. Ltd. - Product / Service
                • Zhonglan Industry Co. Ltd. - Key offerings
                • SWOT

              16 Appendix

              • 16.1 Scope of the report
                • 16.2 Inclusions and exclusions checklist
                  • Inclusions checklist
                  • Exclusions checklist
                • 16.3 Currency conversion rates for US$
                  • Currency conversion rates for US$
                • 16.4 Research methodology
                  • Research methodology
                • 16.5 Data procurement
                  • Information sources
                • 16.6 Data validation
                  • Data validation
                • 16.7 Validation techniques employed for market sizing
                  • Validation techniques employed for market sizing
                • 16.8 Data synthesis
                  • Data synthesis
                • 16.9 360 degree market analysis
                  • 360 degree market analysis
                • 16.10 List of abbreviations
                  • List of abbreviations

                Research Methodology

                Technavio presents a detailed picture of the market by way of study, synthesis, and summation of data from multiple sources. The analysts have presented the various facets of the market with a particular focus on identifying the key industry influencers. The data thus presented is comprehensive, reliable, and the result of extensive research, both primary and secondary.

                INFORMATION SOURCES

                Primary sources

                • Manufacturers and suppliers
                • Channel partners
                • Industry experts
                • Strategic decision makers

                Secondary sources

                • Industry journals and periodicals
                • Government data
                • Financial reports of key industry players
                • Historical data
                • Press releases

                DATA ANALYSIS

                Data Synthesis

                • Collation of data
                • Estimation of key figures
                • Analysis of derived insights

                Data Validation

                • Triangulation with data models
                • Reference against proprietary databases
                • Corroboration with industry experts

                REPORT WRITING

                Qualitative

                • Market drivers
                • Market challenges
                • Market trends
                • Five forces analysis

                Quantitative

                • Market size and forecast
                • Market segmentation
                • Geographical insights
                • Competitive landscape

                Interested in this report?

                Get your sample now to see our research methodology and insights!

                Download Now

                Frequently Asked Questions

                Malic Acid market growth will increase by $ 70.1 mn during 2025-2029.

                The Malic Acid market is expected to grow at a CAGR of 4.9% during 2025-2029.

                Malic Acid market is segmented by Product( L-malic acid, Dl-malic acid, D-malic acid) Application( Beverages, Confectionaries and food, Personal care and cosmetics, Others) End-user( Food and beverage processing, Pharmaceuticals industry, Animal feed industry, South America, Middle East and Africa)

                Anhui Sealong Biotechnology Co. Ltd., Bartek Ingredients Inc., Changmao Biochemical Engineering Co. Ltd., Corbion N.V., Fuso Chemical Co. Ltd., Guangzhou ZIO Chemical Co. Ltd, Isegen South Africa Pty Ltd., Lonza Group Ltd., Muby Chem Ltd., NACALAI TESQUE INC, Nanjing Lile Biotechnology Co. Ltd, Polynt SpA, Prinova Group LLC, Thirumalai Chemicals Ltd., YONGSAN CHEMICALS, Zhonglan Industry Co. Ltd. are a few of the key vendors in the Malic Acid market.

                APAC will register the highest growth rate of 45% among the other regions. Therefore, the Malic Acid market in APAC is expected to garner significant business opportunities for the vendors during the forecast period.

                China, US, India, Germany, Mexico, Japan, France, South Korea, Brazil, South Africa

                • Growing demand in food and beverage industryThe food and beverage industry remains the most influential end-use sector driving demand for malic acid. Recognized for its role as a natural acidulant is the driving factor this market.
                • flavor enhancer is the driving factor this market.
                • and preservative is the driving factor this market.
                • malic acid is widely incorporated into processed foods and beverages. Its tart is the driving factor this market.
                • fruit-like taste profile makes it particularly suitable for applications in confectionery is the driving factor this market.
                • dairy is the driving factor this market.
                • and beverage products. The increasing consumer preference for sour and tangy flavors is the driving factor this market.
                • especially among younger demographics is the driving factor this market.
                • has led to its expanded use in products such as sour gummies is the driving factor this market.
                • hard candies is the driving factor this market.
                • and flavored carbonated drinks. Manufacturers are responding to this trend by formulating products that deliver intense taste experiences is the driving factor this market.
                • with malic acid serving as a key ingredient. Additionally is the driving factor this market.
                • the shift toward clean-label and naturally derived additives has reinforced its appeal is the driving factor this market.
                • as malic acid is naturally present in fruits such as apples and grapes. The growing demand for low-calorie and sugar-reduced products has further elevated its importance. Malic acid enables brands to maintain flavor integrity while reducing sugar content is the driving factor this market.
                • making it a valuable component in health-oriented formulations. Its application in functional beverages is the driving factor this market.
                • including sports drinks and energy powders is the driving factor this market.
                • is also notable. Malic acid enhances flavor profiles and supports metabolic absorption is the driving factor this market.
                • aligning with consumer expectations for performance and wellness. The continued expansion of processed food production in emerging economies and the rising popularity of convenience foods are expected to sustain demand. As food manufacturers innovate to meet evolving consumer preferences is the driving factor this market.
                • malic acid remains integral to product development across multiple categories. is the driving factor this market.

                The Malic Acid market vendors should focus on grabbing business opportunities from the L-malic acid segment as it accounted for the largest market share in the base year.