Food Colors Market Size and Trends
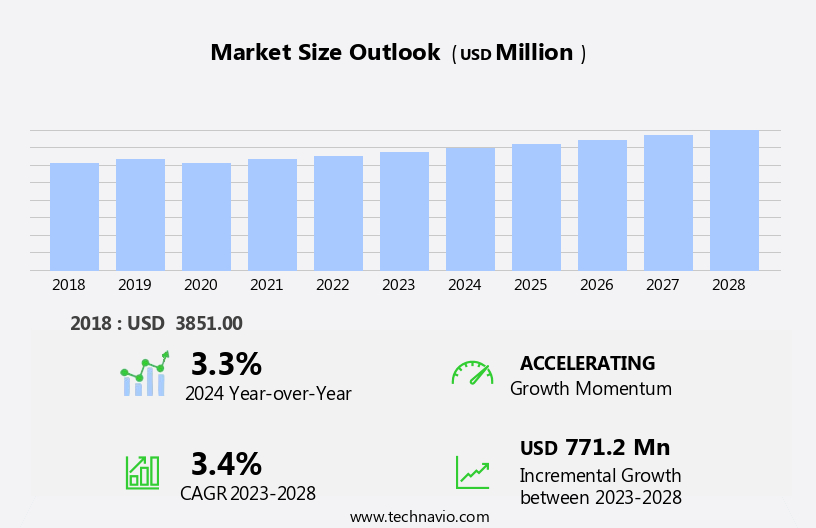
The food colors market size is forecast to increase by USD 771.2 million, at a CAGR of 3.4% between 2023 and 2028. The market is experiencing significant growth due to several key factors. Consumers are increasingly demanding natural food colorants as they prefer clean-label products. Synthetic food colorants, which have potential side effects, are facing restrictions in usage. In response, researchers are exploring new methods for extracting natural food colors using innovative techniques such as ultrasound-assisted extraction. For instance, red cabbage extract is gaining popularity as a natural alternative to synthetic red food colorants. As the market continues to evolve, it is essential for manufacturers to stay informed about the latest trends and raw materials to remain competitive.
The market is a significant sector within the global food industry, playing a crucial role in enhancing the visual appeal of various food products. Food colors are essential additives that contribute to the overall sensory experience of consumers, making them an integral part of food production. Food color usage is driven by several factors, including consumer preferences for vibrant and attractive food products, increasing demand for clean labels, and growing concerns over food adulteration. Innovations in food color technology have led to the development of natural and sustainable food colorants, such as plant-based dyes and non-toxic alternatives. One of the primary concerns in the food colors market is ensuring food color safety. Stringent legislation, such as the U.S. Food and Drug Administration's (FDA) regulations, governs the use of food colors to maintain consumer safety and prevent potential health risks. Food color stability is another critical factor, as food colors must withstand various processing conditions and storage environments without degrading or changing color. Food color perception plays a significant role in consumer preferences. Bright and vivid colors, such as red, blue, and yellow, are often associated with desirable food attributes, such as freshness and ripeness. However, misconceptions about the safety and health implications of food colors persist, leading to a growing demand for natural and sustainable alternatives.
For instance, anthocyanin extraction from red cabbage has emerged as a promising alternative to synthetic food colors. Sustainability is becoming an increasingly important consideration in the food colors market, with a growing emphasis on the use of sustainable food colorants. Plant-based dyes and alternative food colorings derived from natural sources are gaining popularity due to their eco-friendly production and reduced environmental impact. In conclusion, the food colors market is a dynamic and evolving sector, driven by consumer preferences, technological innovations, and regulatory requirements. The market is expected to continue growing, with a focus on natural, sustainable, and safe food colorants that meet the demands of modern consumers.
Market Segmentation
The market research report provides comprehensive data (region-wise segment analysis), with forecasts and estimates in "USD million" for the period 2024-2028, as well as historical data from 2018 - 2022 for the following segments.
- Type
- Natural colors
- Synthetic colors
- Nature identical colors
- Geography
- Europe
- Germany
- UK
- France
- Italy
- North America
- Canada
- US
- APAC
- China
- India
- Japan
- South Korea
- South America
- Middle East and Africa
- Europe
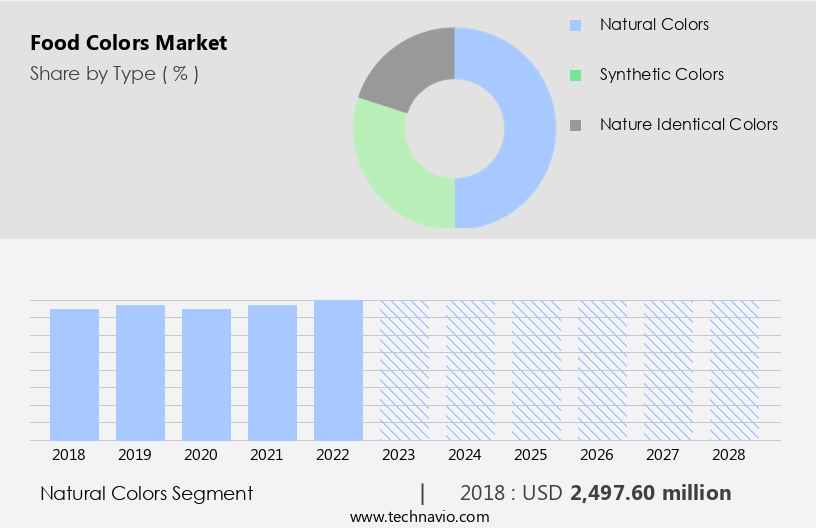
By Type Insights
The natural colors segment is estimated to witness significant growth during the forecast period. Natural food colors are derived from various natural sources including plants, fruits, vegetables, minerals, and algae. These colorants come in different forms such as liquids, powders, pastes, and gels. The natural pigments are extracted from these sources using physical and/or chemical methods. This selective extraction process results in food colorants that are rich in nutrients and safe for consumption in food products. In contrast, synthetic food colors undergo extensive processing, which can raise health concerns. Natural food colors are gaining popularity due to consumer preferences for healthier and more natural food options. However, they may not provide the same vibrant colors as synthetic dyes. Social media has played a significant role in raising awareness about the potential health hazards of synthetic dyes, particularly those containing artificial additives and hyperactive colors. This trend has led to increased demand for natural food colors.
Get a glance at the market share of various segments Download the PDF Sample
The natural colors segment was valued at USD 2.50 billion in 2018. The extraction methods used to obtain natural food colors vary depending on the source material. For instance, annatto is obtained from the seeds of the annatto tree, while carmine is derived from the cochineal insect. The yield of natural food colors is often lower than that of synthetic dyes, which can increase production costs. Despite this, the demand for natural food colors is expected to continue growing as consumers become more health-conscious and demand more transparency in food labeling. In conclusion, natural food colors are a viable alternative to synthetic dyes, offering health benefits and a more natural food experience. The demand for natural food colors is on the rise due to consumer preferences and increased awareness of the potential health hazards of synthetic dyes. While the yield of natural food colors may be lower, their use is expected to continue growing as consumers seek more transparency in food labeling.
Regional Analysis
For more insights on the market share of various regions Download PDF Sample now!
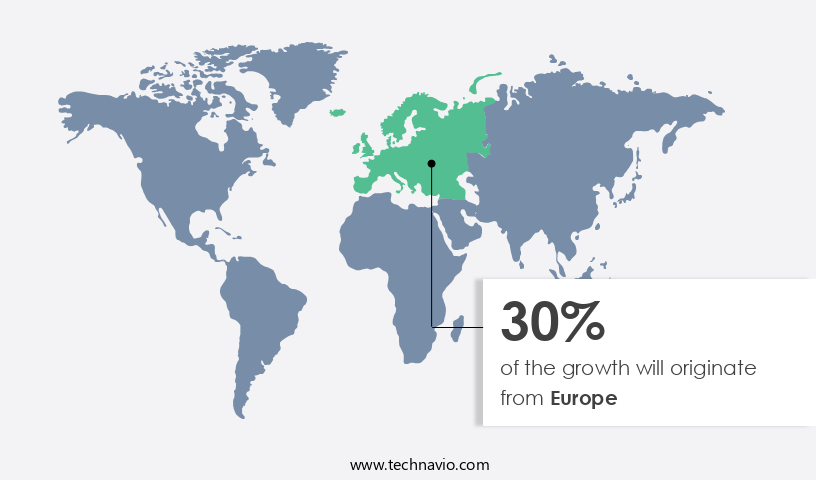
Europe is estimated to contribute 30% to the growth of the global market during the forecast period. Technavio's analysts have elaborately explained the regional trends and drivers that shape the market during the forecast period. In Europe, the consumption of processed ready-to-eat (RTE) food products and ready-to-drink (RTD) beverages is on the rise, particularly in countries like Germany, the UK, and France. The demand for these items is driven by the popularity of baked goods, confectionery, instant foods, convenient meals, and dairy products. Food colorants play a significant role in enhancing the visual appeal of these food and beverage items, leading to their extensive usage in Europe. Moreover, the proliferation of fast-food chains and restaurants in the region further boosts the demand for food colorants. Key European countries, including the UK, Spain, and Germany, house several prominent vendors in the food industry, generating substantial revenue.
Our researchers analyzed the data with 2023 as the base year, along with the key drivers, trends, and challenges. A holistic analysis of drivers will help companies refine their marketing strategies to gain a competitive advantage.
Food Colors Market Driver
Increasing consumer demand for natural food colorants is notably driving market growth. Consumers have been shifting their preferences towards healthier and ethically sourced food and beverage products. The growing concern over the environmental impact of artificial food colors and additives in processed foods is driving the demand for naturally derived colorants.
These natural alternatives have a minimal environmental footprint and are gaining popularity among health-conscious consumers. In addition, market companies are investing in research and development to introduce innovative technologies and produce items that cater to this trend. For example, Thus, such factors are driving the growth of the market during the forecast period.
Food Colors Market Trends
Increasing consumer demand for clean-label products is the key trend in the market. The market is witnessing significant growth due to the increasing consumer preference for clean labeling in food and beverage products. Clean labeling is a labeling practice that discloses the natural and organic ingredients used in the production of food items. This trend is gaining traction as consumers are increasingly demanding transparency in food production and are shunning products with artificial colors and additives. One such natural food colorant that is gaining popularity is red cabbage extract, which is obtained through ultrasound-assisted color extraction from raw red cabbage.
Food manufacturers are incorporating this natural food colorant into their products to cater to the demand for clean labeling and meet consumer expectations. The adoption of this natural food colorant is expected to boost the growth of the food colors market during the forecast period. Thus, such trends will shape the growth of the market during the forecast period.
Food Colors Market Challenge
Restriction on usage of synthetic food colorants due to their potential side effects is the major challenge that affects the growth of the market. Food colors play a significant role in enhancing the visual appeal of various food and beverage products in the market. Synthetic food colors, derived from chemical processes, are widely used due to their vibrant hues and ease of use. In the US, the Food and Drug Administration (FDA) regulates the use of synthetic food colors by assigning them Food, Drugs and Cosmetics (FD&C) numbers as codes for their approval in food, drugs, and cosmetics. This regulatory system ensures transparency and safety for consumers. Similarly, in the European Union (EU), the European Food Safety Authority (EFSA) assigns E numbers as codes for food additives, including synthetic food colors.
Digital media platforms have significantly influenced food consumption patterns, leading to increased awareness of health issues related to synthetic food colors. However, it is essential to note that these food colors are approved by food authorities in various countries and are generally considered safe when used in appropriate quantities. Natural food colors are an alternative option for those concerned about potential health risks associated with synthetic food colors. Hence, the above factors will impede the growth of the market during the forecast period.
Exclusive Customer Landscape
The market forecasting report includes the adoption lifecycle of the market, covering from the innovator's stage to the laggard's stage. It focuses on adoption rates in different regions based on penetration. Furthermore, the report also includes key purchase criteria and drivers of price sensitivity to help companies evaluate and develop their market growth analysis strategies.

Customer Landscape
Key Companies & Market Insights
Companies are implementing various strategies, such as strategic alliances, partnerships, mergers and acquisitions, geographical expansion, and product/service launches, to enhance their presence in the market.
Archer Daniels Midland Co. - The company offers food colorants sourced from fruit, vegetables or other natural sources.
The market research and growth report also includes detailed analyses of the competitive landscape of the market and information about key companies, including:
- AromataGroup Srl
- Avees Products India
- BASF SE
- Cabot Corp.
- Chr Hansen AS
- Dohler GmbH
- FMC Corp.
- Givaudan SA
- GNT Group BV
- IFC Solutions
- Incoltec
- Kolorjet Chemicals Pvt Ltd.
- Koninklijke DSM NV
- Lycored Corp.
- Riken Vitamin Co Ltd.
- Roquette Freres SA
- San-Ei Gen F.F.I. Inc.
- Sensient Technologies Corp.
- Special Ingredients Ltd.
Qualitative and quantitative analysis of companies has been conducted to help clients understand the wider business environment as well as the strengths and weaknesses of key market players. Data is qualitatively analyzed to categorize companies as pure play, category-focused, industry-focused, and diversified; it is quantitatively analyzed to categorize companies as dominant, leading, strong, tentative, and weak.
Food colors play a significant role in enhancing the visual appeal of various food products, from bakery items to beverages. The market is witnessing a rise in demand due to the increasing preference for vibrant and colorful food items among consumers. However, the use of food colors, especially artificial ones, has raised health concerns, with some studies linking them to cancer and other health issues. The food industry relies on both natural and synthetic food colors as raw materials for food processing. Natural food colors, derived from sources like red cabbage, purple sweet potato, and crocin, offer health advantages and better color stability. On the other hand, synthetic colors, such as those used in synthetic dyes, provide better yield and efficiency in the extraction processes.
Despite the health hazards associated with synthetic food colors, their use remains prevalent due to their affordability and ease of use. Food manufacturers are exploring new extraction methods, including ultrasound-assisted extraction, to improve the efficiency of natural food color production. Digital media platforms and social media have significantly influenced consumer expectations, leading to an increased demand for colorful and visually appealing food products. Public schools and institutions are also adopting brightly colored food items to make meals more appealing to children. However, the food industry must address the health concerns associated with food colors, particularly those related to adulteration and hyperactivity, to meet evolving consumer demands.
|
Market Scope |
|
|
Report Coverage |
Details |
|
Page number |
168 |
|
Base year |
2023 |
|
Historic period |
2018 - 2022 |
|
Forecast period |
2024-2028 |
|
Growth momentum & CAGR |
Accelerate at a CAGR of 3.4% |
|
Market Growth 2024-2028 |
USD 771.2 million |
|
Market structure |
Fragmented |
|
YoY growth 2023-2024(%) |
3.3 |
|
Regional analysis |
Europe, North America, APAC, South America, and Middle East and Africa |
|
Performing market contribution |
Europe at 30% |
|
Key countries |
US, China, Germany, UK, Japan, India, South Korea, Canada, France, and Italy |
|
Competitive landscape |
Leading Companies, Market Positioning of Companies, Competitive Strategies, and Industry Risks |
|
Key companies profiled |
Archer Daniels Midland Co., AromataGroup Srl, Avees Products India, BASF SE, Cabot Corp., Chr Hansen AS, Dohler GmbH, FMC Corp., Givaudan SA, GNT Group BV, IFC Solutions, Incoltec, Kolorjet Chemicals Pvt Ltd., Koninklijke DSM NV, Lycored Corp., Riken Vitamin Co Ltd., Roquette Freres SA, San-Ei Gen F.F.I. Inc., Sensient Technologies Corp., and Special Ingredients Ltd. |
|
Market dynamics |
Parent market analysis, Market growth inducers and obstacles, Fast-growing and slow-growing segment analysis, COVID-19 impact and recovery analysis and future consumer dynamics, Market condition analysis for market forecast period |
|
Customization purview |
If our market report has not included the data that you are looking for, you can reach out to our analysts and get segments customized. |
What are the Key Data Covered in this Market Research Report?
- CAGR of the market during the forecast period
- Detailed information on factors that will drive the market growth and forecasting between 2024 and 2028
- Precise estimation of the size of the market and its contribution of the market in focus to the parent market
- Accurate predictions about upcoming market growth and trends and changes in consumer behaviour
- Growth of the market across Europe, North America, APAC, South America, and Middle East and Africa
- Thorough analysis of the market's competitive landscape and detailed information about companies
- Comprehensive analysis of factors that will challenge the growth of market companies
We can help! Our analysts can customize this market research report to meet your requirements.
 RIA -
RIA - 
