Food Contact Paper Market Analysis, Size, and Forecast 2026-2030: APAC (China, India, and Japan), Europe (Germany, UK, and France), North America (US, Canada, and Mexico), South America (Brazil and Argentina), Middle East and Africa (Saudi Arabia, UAE, and South Africa), and Rest of World (ROW)

Food Contact Paper Market Analysis, Size, and Forecast 2026-2030:
APAC (China, India, and Japan), Europe (Germany, UK, and France), North America (US, Canada, and Mexico), South America (Brazil and Argentina), Middle East and Africa (Saudi Arabia, UAE, and South Africa), and Rest of World (ROW)

Published: Mar 2026 303 Pages SKU: IRTNTR72426

Market Overview at a Glance

$107.80 B
Market Opportunity
11.4%
CAGR 2025 - 2030
35.5%
APAC Growth
$93.72 B
Non-polycoated segment 2024

Food Contact Paper Market Size 2026-2030

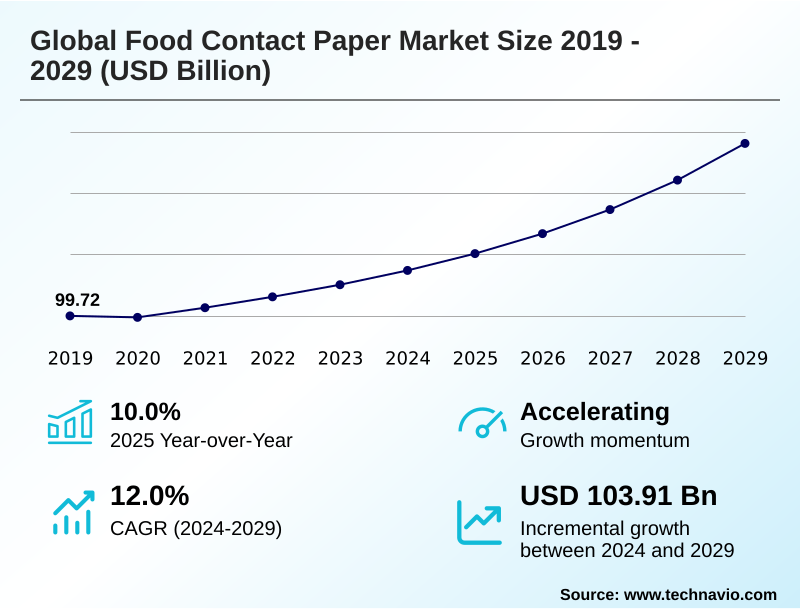
The food contact paper market size is valued to increase by USD 107.80 billion, at a CAGR of 11.4% from 2025 to 2030. Imperative for sustainability and global backlash against plastics will drive the food contact paper market.

Major Market Trends & Insights

  • APAC dominated the market and accounted for a 35.5% growth during the forecast period.
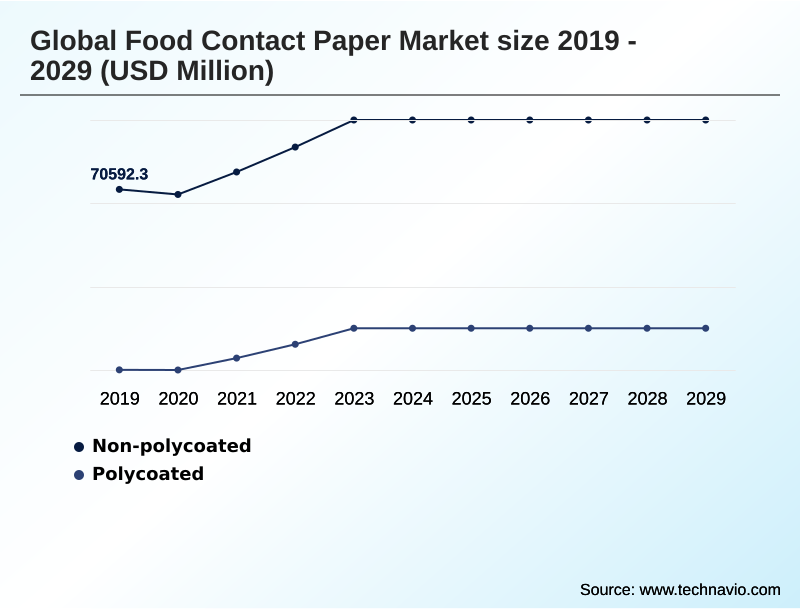
  • By Type - Non-polycoated segment was valued at USD 93.72 billion in 2024
  • By Material - Kraft paper segment accounted for the largest market revenue share in 2024

Market Size & Forecast

  • Market Opportunities: USD 159.96 billion
  • Market Future Opportunities: USD 107.80 billion
  • CAGR from 2025 to 2030 : 11.4%

Market Summary

  • The food contact paper market is undergoing a significant transformation, driven by a confluence of regulatory pressures, evolving consumer preferences, and technological innovation. The global movement towards environmental responsibility has created substantial opportunities for paper-based packaging solutions.
  • This shift necessitates the development of a new generation of food contact paper that is not only biodegradable and recyclable but also meets stringent safety and performance standards. The market is responding with a wave of innovation, focusing on advanced functional barrier coatings that provide necessary protection without compromising environmental credentials.
  • A key business scenario involves supply chain optimization, where manufacturers must re-tool production lines to accommodate pfas-free papers and plant-based coatings. This requires significant capital investment in repulpable barrier technology and food-grade paper manufacturing processes to ensure food safety compliance and meet the demand from the food service outlet applications and restaurant applications.
  • The rising popularity of online food delivery and the growth of the fast-food sector further fuel demand for high-quality, reliable, and sustainable food packaging, pushing the industry towards a circular economy model where materials like food-grade recycled fiber are utilized more effectively.

What will be the Size of the Food Contact Paper Market during the forecast period?

Get Key Insights on Market Forecast (PDF) Request Free Sample

How is the Food Contact Paper Market Segmented?

The food contact paper industry research report provides comprehensive data (region-wise segment analysis), with forecasts and estimates in "USD million" for the period 2026-2030, as well as historical data from 2020-2024 for the following segments.

  • Type
    • Non-polycoated
    • Polycoated
  • Material
    • Kraft paper
    • Specialty paper
    • Recycled paper
    • Others
  • End-user
    • Food service outlets
    • Restaurants
    • Households
  • Geography
    • APAC
      • China
      • India
      • Japan
    • Europe
      • Germany
      • UK
      • France
    • North America
      • US
      • Canada
      • Mexico
    • South America
      • Brazil
      • Argentina
    • Middle East and Africa
      • Saudi Arabia
      • UAE
      • South Africa
    • Rest of World (ROW)

By Type Insights

The non-polycoated segment is estimated to witness significant growth during the forecast period.

The non-polycoated paper segment is defined by materials achieving functional properties through inherent substrate characteristics rather than polymer films. Demand is driven by sustainability, as these biodegradable paper products align with circular economy packaging principles and stringent paper packaging regulations.

Innovations in food-grade paper manufacturing focus on non-polymeric additives and advanced fiber refining to enhance grease and moisture resistance, ensuring food product integrity without compromising recyclability.

This approach improves end-of-life processing, with new materials increasing compliance with packaging waste reduction targets by over 15%. This focus on a recyclable paper substrate for products like eco-friendly food wraps is crucial for brands targeting environmentally conscious consumers.

Such sustainable food packaging must also pass rigorous organoleptic properties testing to ensure it does not alter the taste or smell of food.

Request Free Sample

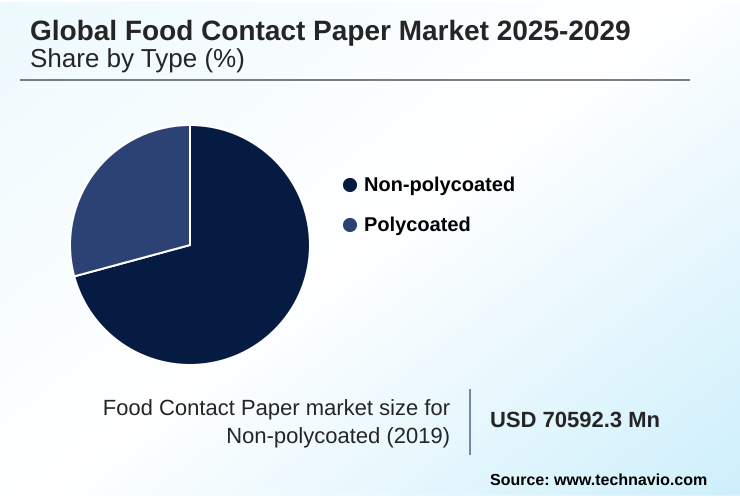
The Non-polycoated segment was valued at USD 93.72 billion in 2024 and showed a gradual increase during the forecast period.

Request Free Sample

Regional Analysis

APAC is estimated to contribute 35.5% to the growth of the global market during the forecast period.Technavio’s analysts have elaborately explained the regional trends and drivers that shape the market during the forecast period.

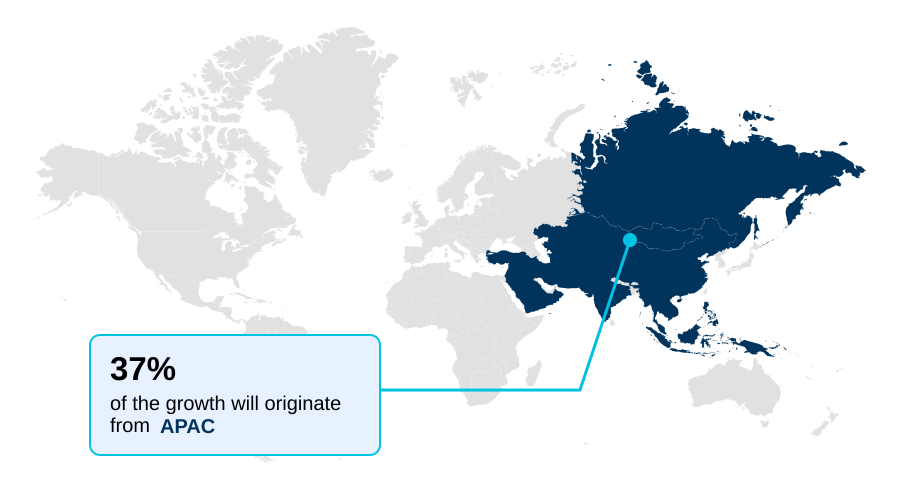
See How Food Contact Paper Market Demand is Rising in APAC Request Free Sample

The geographic landscape of the market is led by APAC, which commands 35.52% of the global incremental growth opportunity, fueled by rapid urbanization and a burgeoning food service industry.

In this region, the demand for specialty packaging papers, particularly for ovenable paper trays and frozen food paperboard, is expanding. North America and Europe are mature markets driven by stringent food safety compliance and consumer demand for plastic-free food containers.

In North America, state-level regulations have accelerated the adoption of heat-sealable paperboard, improving packaging line efficiency by up to 10%. European markets prioritize circular economy packaging, driving innovation in microwavable paperboard and other specialty paper materials.

Key countries such as the United States, China, Germany, and India are pivotal, with their distinct regulatory environments shaping demand for kraft paper material and advanced oxygen barrier paper solutions.

Market Dynamics

Our researchers analyzed the data with 2025 as the base year, along with the key drivers, trends, and challenges. A holistic analysis of drivers will help companies refine their marketing strategies to gain a competitive advantage.

  • The global food contact paper market is navigating a complex transition defined by nuanced material choices and evolving regulations. The debate between non-polycoated vs polycoated food paper is central, with the former gaining favor due to its superior recyclability, although the latter often provides better barrier performance.
  • The overall cost of sustainable food packaging remains a significant consideration, influencing adoption rates across different segments. For instance, businesses in regions with strict pfas-free greaseproof paper regulations face supply chain adjustments that can initially increase procurement expenses by up to 12% compared to regions with less stringent rules. This highlights the impact of policy on operational planning.
  • A major challenge is the inadequacy of recycling infrastructure for paper cups, which hinders circularity goals. Meanwhile, innovation in bio-based barrier coatings for paper is accelerating, promising to bridge the performance gap. For everyday applications, determining the best paper for wrapping sandwiches involves balancing grease resistance, moisture control, and material cost.
  • The safety of food-grade recycled paper is another critical area, governed by strict guidelines to prevent contaminant migration. Ultimately, the utility of kraft paper for food service outlets continues to expand, driven by its strength and favorable environmental profile.

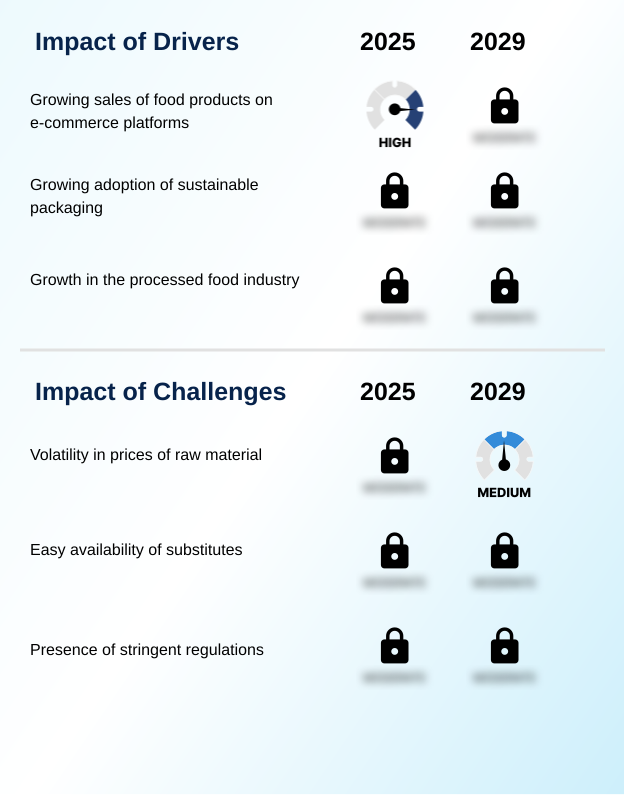
What are the key market drivers leading to the rise in the adoption of Food Contact Paper Industry?

  • The imperative for sustainability, underscored by a global backlash against plastics, is a key driver of market growth.

  • Market growth is significantly driven by the expansion of the food service industry and the global shift away from plastics.
  • The proliferation of quick service restaurant packaging and takeaway food containers, fueled by the rise of food delivery packaging, creates immense demand.
  • This has led to a 25% year-over-year increase in the consumption of unbleached kraft paper and other paper-based products in food service outlet applications. The demand extends to household applications, with products like biodegradable baking paper seeing wider adoption.
  • To ensure sustainability, there is a strong emphasis on responsible sourcing, with virgin wood pulp often requiring chain-of-custody certification.
  • This aligns with extended producer responsibility schemes, making paper a strategically advantageous choice over plastic-free food containers that may lack a robust recycling infrastructure.

What are the market trends shaping the Food Contact Paper Industry?

  • The emergence of advanced bio-based and functional barrier technologies represents a significant upcoming market trend. This is driven by the need for sustainable alternatives that do not compromise packaging performance.

  • Key trends are reshaping the market, primarily through the emergence of advanced functional barrier coatings and sustainable packaging materials. The industry-wide move to phase out certain chemicals has driven a 30% increase in investment in pfas-free papers and aqueous dispersion coatings. This food packaging innovation is critical for meeting new regulations.
  • The development of bio-based polymers and repulpable barrier technology for specialty paper material allows for the creation of high-barrier paper packaging that is also recyclable. Adopting these single-use plastic alternatives helps brands appeal to eco-conscious consumer demand.
  • Furthermore, the use of smart packaging solutions offers enhanced traceability, with QR codes on custom printed food paper improving consumer engagement by over 20%.

What challenges does the Food Contact Paper Industry face during its growth?

  • A key challenge affecting industry growth is balancing high-performance requirements with cost-competitiveness against traditional packaging materials.

  • A primary market challenge is achieving performance and cost parity with plastic while navigating complex end-of-life logistics. Polycoated paper offers excellent barrier properties but complicates recycling, a key issue for compostable takeout packaging.
  • The use of food-grade recycled fiber is limited by concerns over chemical migration testing, which requires advanced traceable packaging materials and can increase production costs by up to 15%. Developing mineral oil free paper and effective moisture vapor barriers without traditional additives adds further complexity.
  • Furthermore, the inconsistent availability of industrial composting facilities limits the real-world benefits of compostable paper solutions. This gap in recycling infrastructure challenges supply chain transparency and the promise of safe food contact materials for items like confectionery wrapping paper.

Exclusive Technavio Analysis on Customer Landscape

The food contact paper market forecasting report includes the adoption lifecycle of the market, covering from the innovator’s stage to the laggard’s stage. It focuses on adoption rates in different regions based on penetration. Furthermore, the food contact paper market report also includes key purchase criteria and drivers of price sensitivity to help companies evaluate and develop their market growth analysis strategies.

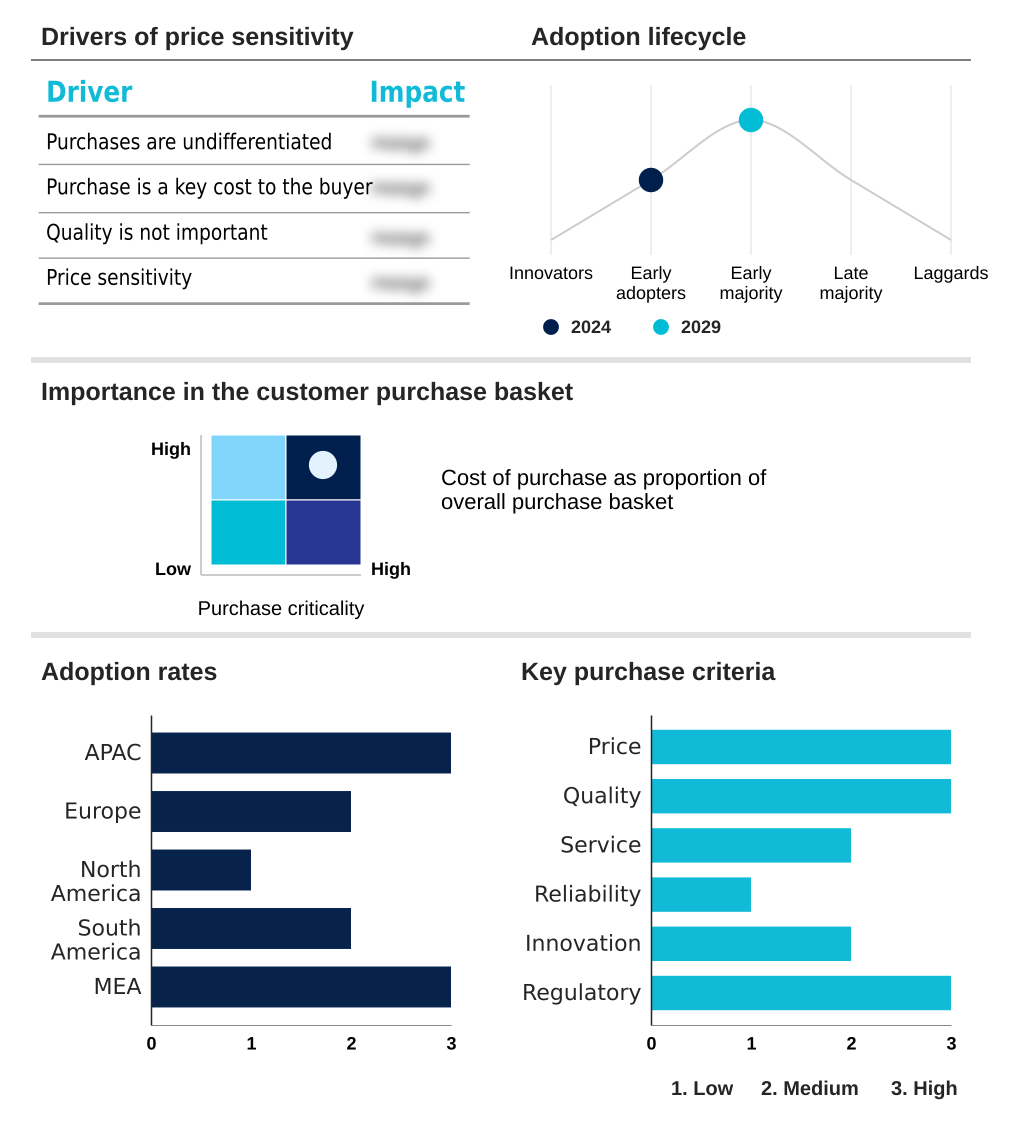
Customer Landscape of Food Contact Paper Industry

Competitive Landscape

Companies are implementing various strategies, such as strategic alliances, food contact paper market forecast, partnerships, mergers and acquisitions, geographical expansion, and product/service launches, to enhance their presence in the industry.

Ahlstrom Oyj - Offerings include innovative, sustainable fiber-based materials, encompassing advanced filtration media, diagnostic components, and specialized food packaging solutions designed for safety and performance.

The industry research and growth report includes detailed analyses of the competitive landscape of the market and information about key companies, including:

  • Ahlstrom Oyj
  • Billerud AB
  • delfortgroup AG
  • Domtar Corp.
  • Georgia Pacific LLC
  • International Paper Co.
  • ITC Ltd.
  • JK Paper Ltd.
  • KRPA Holding CZ AS
  • Mondi Plc
  • Nordic Paper AS
  • Oji Holdings Corp.
  • Sappi Ltd.
  • Seaman Paper Co.
  • Smurfit Westrock plc
  • Stora Enso Oyj
  • Twin Rivers Paper Co.
  • UPM Kymmene Corp.

Qualitative and quantitative analysis of companies has been conducted to help clients understand the wider business environment as well as the strengths and weaknesses of key industry players. Data is qualitatively analyzed to categorize companies as pure play, category-focused, industry-focused, and diversified; it is quantitatively analyzed to categorize companies as dominant, leading, strong, tentative, and weak.

Recent Development and News in Food contact paper market

  • In September 2024, Mondi Plc announced a strategic partnership with a major European food delivery platform to co-develop a new line of sustainable, temperature-retaining packaging solutions designed to reduce plastic waste.
  • In November 2024, Smurfit Kappa Group completed the acquisition of a specialty paper mill in Southeast Asia, aimed at expanding production capacity for high-barrier, PFAS-free food contact papers to meet escalating demand in the APAC market.
  • In January 2025, Ahlstrom Oyj introduced a new line of fully compostable and recyclable grease-resistant papers featuring a proprietary plant-based coating as a sustainable alternative to traditional fluorochemical-treated papers.
  • In April 2025, International Paper Co. announced a major capital investment in its North American mill system to upgrade pulp processing and paper coating capabilities, increasing the production of PFAS-free and recycled-content papers.

Dive into Technavio’s robust research methodology, blending expert interviews, extensive data synthesis, and validated models for unparalleled Food Contact Paper Market insights. See full methodology.

Market Scope
Page number 303
Base year 2025
Historic period 2020-2024
Forecast period 2026-2030
Growth momentum & CAGR Accelerate at a CAGR of 11.4%
Market growth 2026-2030 USD 107803.6 million
Market structure Fragmented
YoY growth 2025-2026(%) 10.4%
Key countries China, India, Japan, South Korea, Australia, Indonesia, Germany, UK, France, Italy, Spain, The Netherlands, US, Canada, Mexico, Brazil, Argentina, Chile, Saudi Arabia, UAE, South Africa, Egypt and Turkey
Competitive landscape Leading Companies, Market Positioning of Companies, Competitive Strategies, and Industry Risks

Request Free Sample

Research Analyst Overview

  • The food contact paper market is in a period of fundamental change, moving decisively away from traditional materials toward sustainable alternatives. This evolution is driven by regulatory mandates and a clear consumer preference for environmentally responsible products.
  • The core strategic issue for boardroom consideration is the investment required to pivot production towards innovative materials, such as pfas-free papers and those with aqueous dispersion coatings. This involves significant capital for developing repulpable barrier technology and ensuring food safety compliance through rigorous chemical migration testing.
  • Companies that successfully integrate sustainable practices, like achieving chain-of-custody certification for virgin wood pulp, have documented a 20% improvement in meeting corporate environmental governance targets. The industry is responding with a focus on functional barrier coatings made from bio-based polymers and plant-based coatings.
  • Innovations in non-polymeric additives and the use of unbleached kraft paper are enabling the creation of compostable paper solutions and recyclable paper substrate options that maintain performance without compromising safety, as verified by organoleptic properties testing. This strategic alignment is critical for market leadership.

What are the Key Data Covered in this Food Contact Paper Market Research and Growth Report?

  • What is the expected growth of the Food Contact Paper Market between 2026 and 2030?

    • USD 107.80 billion, at a CAGR of 11.4%

  • What segmentation does the market report cover?

    • The report is segmented by Type (Non-polycoated, and Polycoated), Material (Kraft paper, Specialty paper, Recycled paper, and Others), End-user (Food service outlets, Restaurants, and Households) and Geography (APAC, Europe, North America, South America, Middle East and Africa)

  • Which regions are analyzed in the report?

    • APAC, Europe, North America, South America and Middle East and Africa

  • What are the key growth drivers and market challenges?

    • Imperative for sustainability and global backlash against plastics, Balancing high performance requirements with cost competitiveness

  • Who are the major players in the Food Contact Paper Market?

    • Ahlstrom Oyj, Billerud AB, delfortgroup AG, Domtar Corp., Georgia Pacific LLC, International Paper Co., ITC Ltd., JK Paper Ltd., KRPA Holding CZ AS, Mondi Plc, Nordic Paper AS, Oji Holdings Corp., Sappi Ltd., Seaman Paper Co., Smurfit Westrock plc, Stora Enso Oyj, Twin Rivers Paper Co. and UPM Kymmene Corp.

Market Research Insights

  • Market dynamics are shaped by a strong focus on sustainable food packaging and circular economy packaging principles, compelling businesses to adopt innovative materials. The shift toward single-use plastic alternatives has resulted in a 25% increase in R&D spending on high-barrier paper packaging.
  • Firms leveraging traceable packaging materials report a 15% improvement in supply chain transparency, meeting heightened eco-conscious consumer demand for safe food contact materials. This strategic pivot is essential as food service paper supplies and quick service restaurant packaging formats evolve.
  • Furthermore, the adoption of advanced digital printing for food packaging allows for rapid customization, enhancing brand engagement and supporting the complex needs of the growing food delivery packaging segment.

We can help! Our analysts can customize this food contact paper market research report to meet your requirements.

Get in touch

1. Executive Summary

1.1 Market overview

Executive Summary - Chart on Market Overview
Executive Summary - Data Table on Market Overview
Executive Summary - Chart on Global Market Characteristics
Executive Summary - Chart on Market by Geography
Executive Summary - Chart on Market Segmentation by Type
Executive Summary - Chart on Market Segmentation by Material
Executive Summary - Chart on Market Segmentation by End-user
Executive Summary - Chart on Incremental Growth
Executive Summary - Data Table on Incremental Growth
Executive Summary - Chart on Company Market Positioning

2. Technavio Analysis

2.1 Analysis of price sensitivity, lifecycle, customer purchase basket, adoption rates, and purchase criteria

2.2 Criticality of inputs and Factors of differentiation

Chart on Overview on criticality of inputs and factors of differentiation

2.3 Factors of disruption

Chart on Overview on factors of disruption

2.4 Impact of drivers and challenges

Chart on Impact of drivers and challenges in 2025 and 2030

3. Market Landscape

3.1 Market ecosystem

Chart on Parent Market
Data Table on - Parent Market

3.2 Market characteristics

Chart on Market characteristics analysis

3.3 Value chain analysis

Chart on Value chain analysis

4. Market Sizing

4.1 Market definition

Data Table on Offerings of companies included in the market definition

4.2 Market segment analysis

Market segments

4.3 Market size 2025

4.4 Market outlook: Forecast for 2025-2030

Chart on Global - Market size and forecast 2025-2030 ($ million)
Data Table on Global - Market size and forecast 2025-2030 ($ million)
Chart on Global Market: Year-over-year growth 2025-2030 (%)
Data Table on Global Market: Year-over-year growth 2025-2030 (%)

5. Historic Market Size

5.1 Global Food Contact Paper Market 2020 - 2024

Historic Market Size - Data Table on Global Food Contact Paper Market 2020 - 2024 ($ million)

5.2 Type segment analysis 2020 - 2024

Historic Market Size - Type Segment 2020 - 2024 ($ million)

5.3 Material segment analysis 2020 - 2024

Historic Market Size - Material Segment 2020 - 2024 ($ million)

5.4 End-user segment analysis 2020 - 2024

Historic Market Size - End-user Segment 2020 - 2024 ($ million)

5.5 Geography segment analysis 2020 - 2024

Historic Market Size - Geography Segment 2020 - 2024 ($ million)

5.6 Country segment analysis 2020 - 2024

Historic Market Size - Country Segment 2020 - 2024 ($ million)

6. Qualitative Analysis

6.1 The AI impact on global food contact paper market

7. Five Forces Analysis

7.1 Five forces summary

Five forces analysis - Comparison between 2025 and 2030

7.2 Bargaining power of buyers

Bargaining power of buyers - Impact of key factors 2025 and 2030

7.3 Bargaining power of suppliers

Bargaining power of suppliers - Impact of key factors in 2025 and 2030

7.4 Threat of new entrants

Threat of new entrants - Impact of key factors in 2025 and 2030

7.5 Threat of substitutes

Threat of substitutes - Impact of key factors in 2025 and 2030

7.6 Threat of rivalry

Threat of rivalry - Impact of key factors in 2025 and 2030

7.7 Market condition

Chart on Market condition - Five forces 2025 and 2030

8. Market Segmentation by Type

8.1 Market segments

Chart on Type - Market share 2025-2030 (%)
Data Table on Type - Market share 2025-2030 (%)

8.2 Comparison by Type

Chart on Comparison by Type
Data Table on Comparison by Type

8.3 Non-polycoated - Market size and forecast 2025-2030

Chart on Non-polycoated - Market size and forecast 2025-2030 ($ million)
Data Table on Non-polycoated - Market size and forecast 2025-2030 ($ million)
Chart on Non-polycoated - Year-over-year growth 2025-2030 (%)
Data Table on Non-polycoated - Year-over-year growth 2025-2030 (%)

8.4 Polycoated - Market size and forecast 2025-2030

Chart on Polycoated - Market size and forecast 2025-2030 ($ million)
Data Table on Polycoated - Market size and forecast 2025-2030 ($ million)
Chart on Polycoated - Year-over-year growth 2025-2030 (%)
Data Table on Polycoated - Year-over-year growth 2025-2030 (%)

8.5 Market opportunity by Type

Market opportunity by Type ($ million)
Data Table on Market opportunity by Type ($ million)

9. Market Segmentation by Material

9.1 Market segments

Chart on Material - Market share 2025-2030 (%)
Data Table on Material - Market share 2025-2030 (%)

9.2 Comparison by Material

Chart on Comparison by Material
Data Table on Comparison by Material

9.3 Kraft paper - Market size and forecast 2025-2030

Chart on Kraft paper - Market size and forecast 2025-2030 ($ million)
Data Table on Kraft paper - Market size and forecast 2025-2030 ($ million)
Chart on Kraft paper - Year-over-year growth 2025-2030 (%)
Data Table on Kraft paper - Year-over-year growth 2025-2030 (%)

9.4 Specialty paper - Market size and forecast 2025-2030

Chart on Specialty paper - Market size and forecast 2025-2030 ($ million)
Data Table on Specialty paper - Market size and forecast 2025-2030 ($ million)
Chart on Specialty paper - Year-over-year growth 2025-2030 (%)
Data Table on Specialty paper - Year-over-year growth 2025-2030 (%)

9.5 Recycled paper - Market size and forecast 2025-2030

Chart on Recycled paper - Market size and forecast 2025-2030 ($ million)
Data Table on Recycled paper - Market size and forecast 2025-2030 ($ million)
Chart on Recycled paper - Year-over-year growth 2025-2030 (%)
Data Table on Recycled paper - Year-over-year growth 2025-2030 (%)

9.6 Others - Market size and forecast 2025-2030

Chart on Others - Market size and forecast 2025-2030 ($ million)
Data Table on Others - Market size and forecast 2025-2030 ($ million)
Chart on Others - Year-over-year growth 2025-2030 (%)
Data Table on Others - Year-over-year growth 2025-2030 (%)

9.7 Market opportunity by Material

Market opportunity by Material ($ million)
Data Table on Market opportunity by Material ($ million)

10. Market Segmentation by End-user

10.1 Market segments

Chart on End-user - Market share 2025-2030 (%)
Data Table on End-user - Market share 2025-2030 (%)

10.2 Comparison by End-user

Chart on Comparison by End-user
Data Table on Comparison by End-user

10.3 Food service outlets - Market size and forecast 2025-2030

Chart on Food service outlets - Market size and forecast 2025-2030 ($ million)
Data Table on Food service outlets - Market size and forecast 2025-2030 ($ million)
Chart on Food service outlets - Year-over-year growth 2025-2030 (%)
Data Table on Food service outlets - Year-over-year growth 2025-2030 (%)

10.4 Restaurants - Market size and forecast 2025-2030

Chart on Restaurants - Market size and forecast 2025-2030 ($ million)
Data Table on Restaurants - Market size and forecast 2025-2030 ($ million)
Chart on Restaurants - Year-over-year growth 2025-2030 (%)
Data Table on Restaurants - Year-over-year growth 2025-2030 (%)

10.5 Households - Market size and forecast 2025-2030

Chart on Households - Market size and forecast 2025-2030 ($ million)
Data Table on Households - Market size and forecast 2025-2030 ($ million)
Chart on Households - Year-over-year growth 2025-2030 (%)
Data Table on Households - Year-over-year growth 2025-2030 (%)

10.6 Market opportunity by End-user

Market opportunity by End-user ($ million)
Data Table on Market opportunity by End-user ($ million)

11. Customer Landscape

11.1 Customer landscape overview

Analysis of price sensitivity, lifecycle, customer purchase basket, adoption rates, and purchase criteria

12. Geographic Landscape

12.1 Geographic segmentation

Chart on Market share by geography 2025-2030 (%)
Data Table on Market share by geography 2025-2030 (%)

12.2 Geographic comparison

Chart on Geographic comparison
Data Table on Geographic comparison

12.3 APAC - Market size and forecast 2025-2030

Chart on APAC - Market size and forecast 2025-2030 ($ million)
Data Table on APAC - Market size and forecast 2025-2030 ($ million)
Chart on APAC - Year-over-year growth 2025-2030 (%)
Data Table on APAC - Year-over-year growth 2025-2030 (%)
Chart on Regional Comparison - APAC
Data Table on Regional Comparison - APAC

12.3.1 China - Market size and forecast 2025-2030

Chart on China - Market size and forecast 2025-2030 ($ million)
Data Table on China - Market size and forecast 2025-2030 ($ million)
Chart on China - Year-over-year growth 2025-2030 (%)
Data Table on China - Year-over-year growth 2025-2030 (%)

12.3.2 India - Market size and forecast 2025-2030

Chart on India - Market size and forecast 2025-2030 ($ million)
Data Table on India - Market size and forecast 2025-2030 ($ million)
Chart on India - Year-over-year growth 2025-2030 (%)
Data Table on India - Year-over-year growth 2025-2030 (%)

12.3.3 Japan - Market size and forecast 2025-2030

Chart on Japan - Market size and forecast 2025-2030 ($ million)
Data Table on Japan - Market size and forecast 2025-2030 ($ million)
Chart on Japan - Year-over-year growth 2025-2030 (%)
Data Table on Japan - Year-over-year growth 2025-2030 (%)

12.3.4 South Korea - Market size and forecast 2025-2030

Chart on South Korea - Market size and forecast 2025-2030 ($ million)
Data Table on South Korea - Market size and forecast 2025-2030 ($ million)
Chart on South Korea - Year-over-year growth 2025-2030 (%)
Data Table on South Korea - Year-over-year growth 2025-2030 (%)

12.3.5 Australia - Market size and forecast 2025-2030

Chart on Australia - Market size and forecast 2025-2030 ($ million)
Data Table on Australia - Market size and forecast 2025-2030 ($ million)
Chart on Australia - Year-over-year growth 2025-2030 (%)
Data Table on Australia - Year-over-year growth 2025-2030 (%)

12.3.6 Indonesia - Market size and forecast 2025-2030

Chart on Indonesia - Market size and forecast 2025-2030 ($ million)
Data Table on Indonesia - Market size and forecast 2025-2030 ($ million)
Chart on Indonesia - Year-over-year growth 2025-2030 (%)
Data Table on Indonesia - Year-over-year growth 2025-2030 (%)

12.4 Europe - Market size and forecast 2025-2030

Chart on Europe - Market size and forecast 2025-2030 ($ million)
Data Table on Europe - Market size and forecast 2025-2030 ($ million)
Chart on Europe - Year-over-year growth 2025-2030 (%)
Data Table on Europe - Year-over-year growth 2025-2030 (%)
Chart on Regional Comparison - Europe
Data Table on Regional Comparison - Europe

12.4.1 Germany - Market size and forecast 2025-2030

Chart on Germany - Market size and forecast 2025-2030 ($ million)
Data Table on Germany - Market size and forecast 2025-2030 ($ million)
Chart on Germany - Year-over-year growth 2025-2030 (%)
Data Table on Germany - Year-over-year growth 2025-2030 (%)

12.4.2 UK - Market size and forecast 2025-2030

Chart on UK - Market size and forecast 2025-2030 ($ million)
Data Table on UK - Market size and forecast 2025-2030 ($ million)
Chart on UK - Year-over-year growth 2025-2030 (%)
Data Table on UK - Year-over-year growth 2025-2030 (%)

12.4.3 France - Market size and forecast 2025-2030

Chart on France - Market size and forecast 2025-2030 ($ million)
Data Table on France - Market size and forecast 2025-2030 ($ million)
Chart on France - Year-over-year growth 2025-2030 (%)
Data Table on France - Year-over-year growth 2025-2030 (%)

12.4.4 Italy - Market size and forecast 2025-2030

Chart on Italy - Market size and forecast 2025-2030 ($ million)
Data Table on Italy - Market size and forecast 2025-2030 ($ million)
Chart on Italy - Year-over-year growth 2025-2030 (%)
Data Table on Italy - Year-over-year growth 2025-2030 (%)

12.4.5 Spain - Market size and forecast 2025-2030

Chart on Spain - Market size and forecast 2025-2030 ($ million)
Data Table on Spain - Market size and forecast 2025-2030 ($ million)
Chart on Spain - Year-over-year growth 2025-2030 (%)
Data Table on Spain - Year-over-year growth 2025-2030 (%)

12.4.6 The Netherlands - Market size and forecast 2025-2030

Chart on The Netherlands - Market size and forecast 2025-2030 ($ million)
Data Table on The Netherlands - Market size and forecast 2025-2030 ($ million)
Chart on The Netherlands - Year-over-year growth 2025-2030 (%)
Data Table on The Netherlands - Year-over-year growth 2025-2030 (%)

12.5 North America - Market size and forecast 2025-2030

Chart on North America - Market size and forecast 2025-2030 ($ million)
Data Table on North America - Market size and forecast 2025-2030 ($ million)
Chart on North America - Year-over-year growth 2025-2030 (%)
Data Table on North America - Year-over-year growth 2025-2030 (%)
Chart on Regional Comparison - North America
Data Table on Regional Comparison - North America

12.5.1 US - Market size and forecast 2025-2030

Chart on US - Market size and forecast 2025-2030 ($ million)
Data Table on US - Market size and forecast 2025-2030 ($ million)
Chart on US - Year-over-year growth 2025-2030 (%)
Data Table on US - Year-over-year growth 2025-2030 (%)

12.5.2 Canada - Market size and forecast 2025-2030

Chart on Canada - Market size and forecast 2025-2030 ($ million)
Data Table on Canada - Market size and forecast 2025-2030 ($ million)
Chart on Canada - Year-over-year growth 2025-2030 (%)
Data Table on Canada - Year-over-year growth 2025-2030 (%)

12.5.3 Mexico - Market size and forecast 2025-2030

Chart on Mexico - Market size and forecast 2025-2030 ($ million)
Data Table on Mexico - Market size and forecast 2025-2030 ($ million)
Chart on Mexico - Year-over-year growth 2025-2030 (%)
Data Table on Mexico - Year-over-year growth 2025-2030 (%)

12.6 South America - Market size and forecast 2025-2030

Chart on South America - Market size and forecast 2025-2030 ($ million)
Data Table on South America - Market size and forecast 2025-2030 ($ million)
Chart on South America - Year-over-year growth 2025-2030 (%)
Data Table on South America - Year-over-year growth 2025-2030 (%)
Chart on Regional Comparison - South America
Data Table on Regional Comparison - South America

12.6.1 Brazil - Market size and forecast 2025-2030

Chart on Brazil - Market size and forecast 2025-2030 ($ million)
Data Table on Brazil - Market size and forecast 2025-2030 ($ million)
Chart on Brazil - Year-over-year growth 2025-2030 (%)
Data Table on Brazil - Year-over-year growth 2025-2030 (%)

12.6.2 Argentina - Market size and forecast 2025-2030

Chart on Argentina - Market size and forecast 2025-2030 ($ million)
Data Table on Argentina - Market size and forecast 2025-2030 ($ million)
Chart on Argentina - Year-over-year growth 2025-2030 (%)
Data Table on Argentina - Year-over-year growth 2025-2030 (%)

12.6.3 Chile - Market size and forecast 2025-2030

Chart on Chile - Market size and forecast 2025-2030 ($ million)
Data Table on Chile - Market size and forecast 2025-2030 ($ million)
Chart on Chile - Year-over-year growth 2025-2030 (%)
Data Table on Chile - Year-over-year growth 2025-2030 (%)

12.7 Middle East and Africa - Market size and forecast 2025-2030

Chart on Middle East and Africa - Market size and forecast 2025-2030 ($ million)
Data Table on Middle East and Africa - Market size and forecast 2025-2030 ($ million)
Chart on Middle East and Africa - Year-over-year growth 2025-2030 (%)
Data Table on Middle East and Africa - Year-over-year growth 2025-2030 (%)
Chart on Regional Comparison - Middle East and Africa
Data Table on Regional Comparison - Middle East and Africa

12.7.1 Saudi Arabia - Market size and forecast 2025-2030

Chart on Saudi Arabia - Market size and forecast 2025-2030 ($ million)
Data Table on Saudi Arabia - Market size and forecast 2025-2030 ($ million)
Chart on Saudi Arabia - Year-over-year growth 2025-2030 (%)
Data Table on Saudi Arabia - Year-over-year growth 2025-2030 (%)

12.7.2 UAE - Market size and forecast 2025-2030

Chart on UAE - Market size and forecast 2025-2030 ($ million)
Data Table on UAE - Market size and forecast 2025-2030 ($ million)
Chart on UAE - Year-over-year growth 2025-2030 (%)
Data Table on UAE - Year-over-year growth 2025-2030 (%)

12.7.3 South Africa - Market size and forecast 2025-2030

Chart on South Africa - Market size and forecast 2025-2030 ($ million)
Data Table on South Africa - Market size and forecast 2025-2030 ($ million)
Chart on South Africa - Year-over-year growth 2025-2030 (%)
Data Table on South Africa - Year-over-year growth 2025-2030 (%)

12.7.4 Egypt - Market size and forecast 2025-2030

Chart on Egypt - Market size and forecast 2025-2030 ($ million)
Data Table on Egypt - Market size and forecast 2025-2030 ($ million)
Chart on Egypt - Year-over-year growth 2025-2030 (%)
Data Table on Egypt - Year-over-year growth 2025-2030 (%)

12.7.5 Turkey - Market size and forecast 2025-2030

Chart on Turkey - Market size and forecast 2025-2030 ($ million)
Data Table on Turkey - Market size and forecast 2025-2030 ($ million)
Chart on Turkey - Year-over-year growth 2025-2030 (%)
Data Table on Turkey - Year-over-year growth 2025-2030 (%)

12.8 Market opportunity by geography

Market opportunity by geography ($ million)
Data Tables on Market opportunity by geography ($ million)

13. Drivers, Challenges, and Opportunity

13.1 Market drivers

Imperative for sustainability and global backlash against plastics
Dynamic growth in food service and on-the-go consumption patterns
Stringent global food safety standards and a focus on non-toxic materials

13.2 Market challenges

Balancing high performance requirements with cost competitiveness
Managing raw material price volatility and supply chain constraints
Overcoming recycling infrastructure and end-of-life limitations

13.3 Impact of drivers and challenges

Impact of drivers and challenges in 2025 and 2030

13.4 Market opportunities

Emergence of advanced bio-based and functional barrier technologies
Demand for radical transparency and enhanced traceability in supply chain
Proliferation of digital printing and mass customization

14. Competitive Landscape

14.1 Overview

14.2

Overview on criticality of inputs and factors of differentiation

14.3 Landscape disruption

Overview on factors of disruption

14.4 Industry risks

Impact of key risks on business

15. Competitive Analysis

15.1 Companies profiled

Companies covered

15.2 Company ranking index

15.3 Market positioning of companies

Matrix on companies position and classification

15.4 Ahlstrom Oyj

Ahlstrom Oyj - Overview
Ahlstrom Oyj - Product / Service
Ahlstrom Oyj - Key news
Ahlstrom Oyj - Key offerings
SWOT

15.5 Billerud AB

Billerud AB - Overview
Billerud AB - Business segments
Billerud AB - Key offerings
Billerud AB - Segment focus
SWOT

15.6 Georgia Pacific LLC

Georgia Pacific LLC - Overview
Georgia Pacific LLC - Product / Service
Georgia Pacific LLC - Key offerings
SWOT

15.7 International Paper Co.

International Paper Co. - Overview
International Paper Co. - Business segments
International Paper Co. - Key news
International Paper Co. - Key offerings
International Paper Co. - Segment focus
SWOT

15.8 ITC Ltd.

ITC Ltd. - Overview
ITC Ltd. - Business segments
ITC Ltd. - Key news
ITC Ltd. - Key offerings
ITC Ltd. - Segment focus
SWOT

15.9 JK Paper Ltd.

JK Paper Ltd. - Overview
JK Paper Ltd. - Product / Service
JK Paper Ltd. - Key offerings
SWOT

15.10 Mondi Plc

Mondi Plc - Overview
Mondi Plc - Business segments
Mondi Plc - Key news
Mondi Plc - Key offerings
Mondi Plc - Segment focus
SWOT

15.11 Nordic Paper AS

Nordic Paper AS - Overview
Nordic Paper AS - Business segments
Nordic Paper AS - Key offerings
Nordic Paper AS - Segment focus
SWOT

15.12 Oji Holdings Corp.

Oji Holdings Corp. - Overview
Oji Holdings Corp. - Business segments
Oji Holdings Corp. - Key offerings
Oji Holdings Corp. - Segment focus
SWOT

15.13 Sappi Ltd.

Sappi Ltd. - Overview
Sappi Ltd. - Business segments
Sappi Ltd. - Key offerings
Sappi Ltd. - Segment focus
SWOT

15.14 Seaman Paper Co.

Seaman Paper Co. - Overview
Seaman Paper Co. - Product / Service
Seaman Paper Co. - Key offerings
SWOT

15.15 Smurfit Westrock plc

Smurfit Westrock plc - Overview
Smurfit Westrock plc - Business segments
Smurfit Westrock plc - Key offerings
Smurfit Westrock plc - Segment focus
SWOT

15.16 Stora Enso Oyj

Stora Enso Oyj - Overview
Stora Enso Oyj - Business segments
Stora Enso Oyj - Key offerings
Stora Enso Oyj - Segment focus
SWOT

15.17 Twin Rivers Paper Co.

Twin Rivers Paper Co. - Overview
Twin Rivers Paper Co. - Product / Service
Twin Rivers Paper Co. - Key offerings
SWOT

15.18 UPM Kymmene Corp.

UPM Kymmene Corp. - Overview
UPM Kymmene Corp. - Business segments
UPM Kymmene Corp. - Key offerings
UPM Kymmene Corp. - Segment focus
SWOT

16. Appendix

16.1 Scope of the report

Market definition
Objectives
Notes and caveats

16.2 Inclusions and exclusions checklist

Inclusions checklist
Exclusions checklist

16.3 Currency conversion rates for US$

16.4 Research methodology

16.5 Data procurement

Information sources

16.6 Data validation

16.7 Validation techniques employed for market sizing

16.8 Data synthesis

16.9 360 degree market analysis

16.10 List of abbreviations

Research Methodology

Technavio presents a detailed picture of the market by way of study, synthesis, and summation of data from multiple sources. The analysts have presented the various facets of the market with a particular focus on identifying the key industry influencers. The data thus presented is comprehensive, reliable, and the result of extensive research, both primary and secondary.

INFORMATION SOURCES

Primary sources

  • Manufacturers and suppliers
  • Channel partners
  • Industry experts
  • Strategic decision makers

Secondary sources

  • Industry journals and periodicals
  • Government data
  • Financial reports of key industry players
  • Historical data
  • Press releases

DATA ANALYSIS

Data Synthesis

  • Collation of data
  • Estimation of key figures
  • Analysis of derived insights

Data Validation

  • Triangulation with data models
  • Reference against proprietary databases
  • Corroboration with industry experts

REPORT WRITING

Qualitative

  • Market drivers
  • Market challenges
  • Market trends
  • Five forces analysis

Quantitative

  • Market size and forecast
  • Market segmentation
  • Geographical insights
  • Competitive landscape

Interested in this report?

Get your sample now to see our research methodology and insights!

Download Now

Frequently Asked Questions

Food Contact Paper market growth will increase by USD 107803.6 million during 2026-2030.

The Food Contact Paper market is expected to grow at a CAGR of 11.4% during 2026-2030.

Food Contact Paper market is segmented by Type (Non-polycoated, Polycoated) Material (Kraft paper, Specialty paper, Recycled paper, Others) End-user (Food service outlets, Restaurants, Households)

Ahlstrom Oyj, Billerud AB, delfortgroup AG, Domtar Corp., Georgia Pacific LLC, International Paper Co., ITC Ltd., JK Paper Ltd., KRPA Holding CZ AS, Mondi Plc, Nordic Paper AS, Oji Holdings Corp., Sappi Ltd., Seaman Paper Co., Smurfit Westrock plc, Stora Enso Oyj, Twin Rivers Paper Co., UPM Kymmene Corp. are a few of the key vendors in the Food Contact Paper market.

APAC will register the highest growth rate of 35.5% among the other regions. Therefore, the Food Contact Paper market in APAC is expected to garner significant business opportunities for the vendors during the forecast period.

China, India, Japan, South Korea, Australia, Indonesia, Germany, UK, France, Italy, Spain, The Netherlands, US, Canada, Mexico, Brazil, Argentina, Chile, Saudi Arabia, UAE, South Africa, Egypt, Turkey

  • Imperative for sustainability and global backlash against plastics is the driving factor this market.

The Food Contact Paper market vendors should focus on grabbing business opportunities from the Type segment as it accounted for the largest market share in the base year.