
Food Emulsifiers Market Size 2026-2030
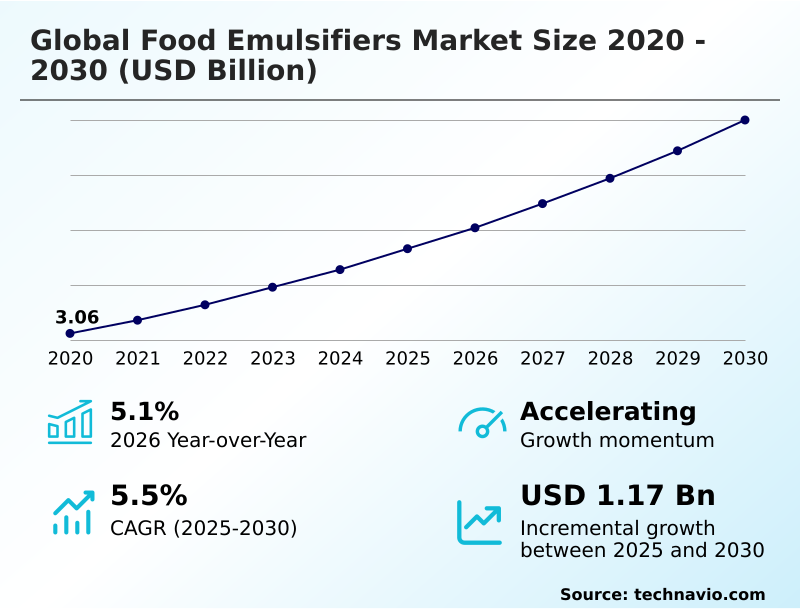
The food emulsifiers market size is valued to increase by USD 1.17 billion, at a CAGR of 5.5% from 2025 to 2030. Growing demand from bakery and confectionery industries will drive the food emulsifiers market.
Major Market Trends & Insights
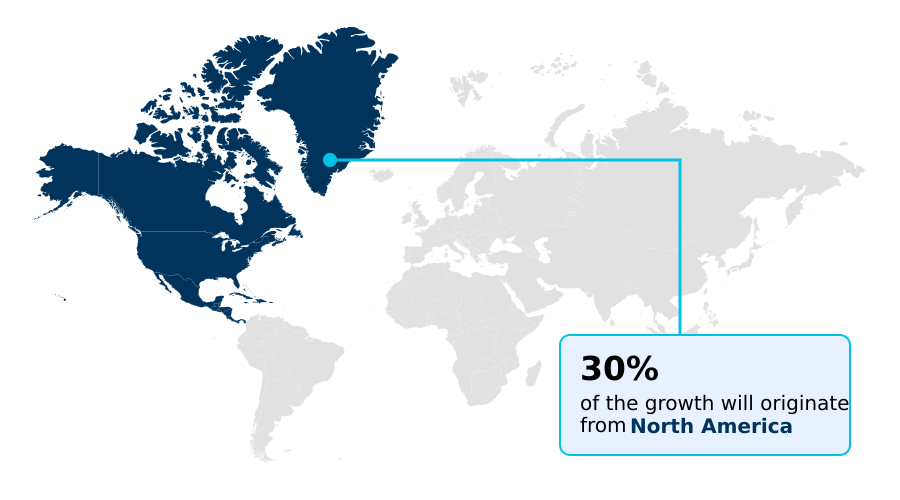
- North America dominated the market and accounted for a 29.6% growth during the forecast period.
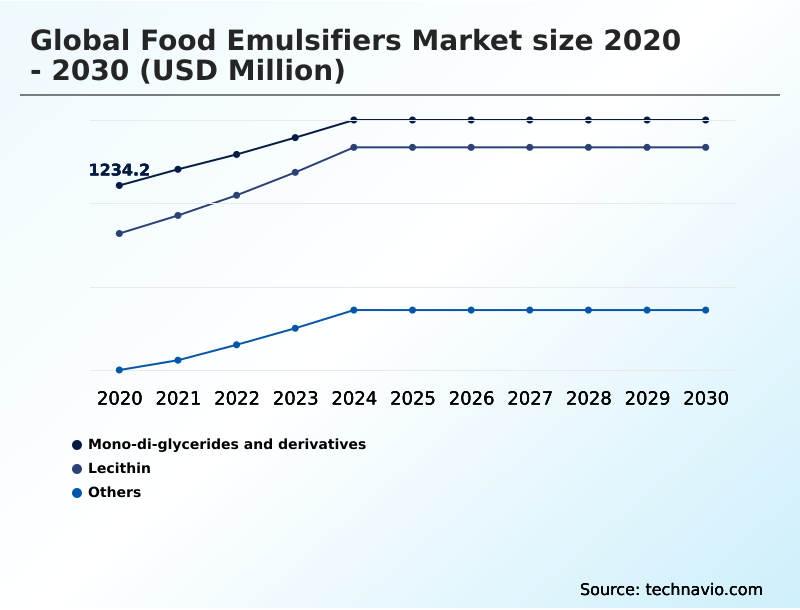
- By Product - Mono-di-glycerides and derivatives segment was valued at USD 1.42 billion in 2024
- By Application - Bakery and confectionery segment accounted for the largest market revenue share in 2024
Market Size & Forecast
- Market Opportunities: USD 1.94 billion
- Market Future Opportunities: USD 1.17 billion
- CAGR from 2025 to 2030 : 5.5%
Market Summary
- The food emulsifiers market is undergoing a significant transformation, driven by consumer demand for processed convenience without compromising on clean-label standards. The primary function of these additives remains critical for ensuring texture modification, viscosity modification, and shelf-life extension in a vast range of products from bakery to dairy alternatives.
- However, there is a clear industry pivot away from purely synthetic emulsifiers toward plant-based emulsifiers and other natural emulsifiers derived from sources like sunflower and rapeseed. This shift addresses growing consumer awareness regarding ingredient transparency and health. A key business scenario involves food manufacturers reformulating low-fat spreads; they must replace traditional trans-fats while maintaining desired fat mimetic properties and mouthfeel.
- This requires sophisticated food microstructure engineering, often utilizing non-gmo emulsifiers and advanced encapsulation technology to deliver functional phospholipids without impacting taste or stability. Navigating volatile raw material supply chains and stringent food safety compliance standards for novel ingredients remains a central challenge for operators in this dynamic environment.
What will be the Size of the Food Emulsifiers Market during the forecast period?
Get Key Insights on Market Forecast (PDF) Get Free Sample
How is the Food Emulsifiers Market Segmented?
The food emulsifiers industry research report provides comprehensive data (region-wise segment analysis), with forecasts and estimates in "USD million" for the period 2026-2030, as well as historical data from 2020-2024 for the following segments.
- Product
- Mono-di-glycerides and derivatives
- Lecithin
- Others
- Application
- Bakery and confectionery
- Convenience foods
- Dairy products
- Others
- Source
- Plant-based
- Synthetic
- Animal-based
- Geography
- APAC
- China
- Japan
- India
- Europe
- Germany
- France
- UK
- North America
- US
- Canada
- Mexico
- South America
- Brazil
- Argentina
- Colombia
- Middle East and Africa
- South Africa
- Saudi Arabia
- UAE
- Rest of World (ROW)
- APAC
By Product Insights
The mono-di-glycerides and derivatives segment is estimated to witness significant growth during the forecast period.
The mono-di-glycerides and derivatives segment remains integral to food processing, primarily due to its functional efficacy in texture modification and shelf-life extension.
These compounds are fundamental for achieving starch complexing and interfacial tension reduction in baked goods, acting as superior dough strengtheners and crumb softeners. Their role as anti-staling agents is critical for maintaining product freshness in the supply chain.
Innovations in this area focus on sustainable sourcing and improving functional performance, such as enhancing fat crystallization control in margarines and spreads.
In industrial applications, optimized use of these derivatives has been shown to improve dough tolerance to mechanical processing by up to 25%, ensuring consistent product quality in high-volume manufacturing environments, thereby underscoring their economic importance.
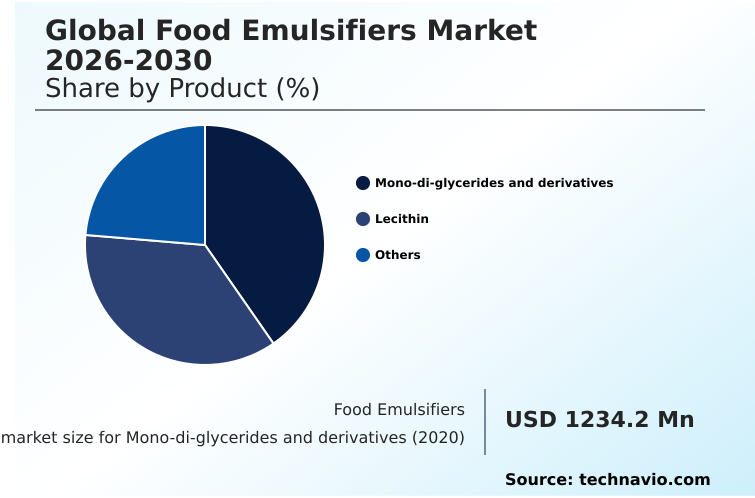
The Mono-di-glycerides and derivatives segment was valued at USD 1.42 billion in 2024 and showed a gradual increase during the forecast period.
Regional Analysis
North America is estimated to contribute 29.6% to the growth of the global market during the forecast period.Technavio’s analysts have elaborately explained the regional trends and drivers that shape the market during the forecast period.
See How Food Emulsifiers Market Demand is Rising in North America Get Free Sample
The geographic landscape of the market is diverse, with North America leading incremental growth, contributing nearly 29.6% of the global expansion.
This is driven by high demand for convenience foods and a mature processing industry focused on innovation in dough conditioning and fat bloom prevention.
In contrast, the APAC region is characterized by rapid growth, fueled by urbanization and increasing adoption of packaged foods that require robust shelf-life extension.
Europe remains a key region, with a strong emphasis on sustainability and regulatory compliance, driving the market for RSPO-certified emulsifiers and ingredients sourced via regenerative sourcing practices.
Firms in this region are achieving up to a 10% reduction in carbon footprint through localized supply chains. Regional innovators in South America and the Middle East are also emerging, tailoring products to meet local tastes and halal certification requirements.
Market Dynamics
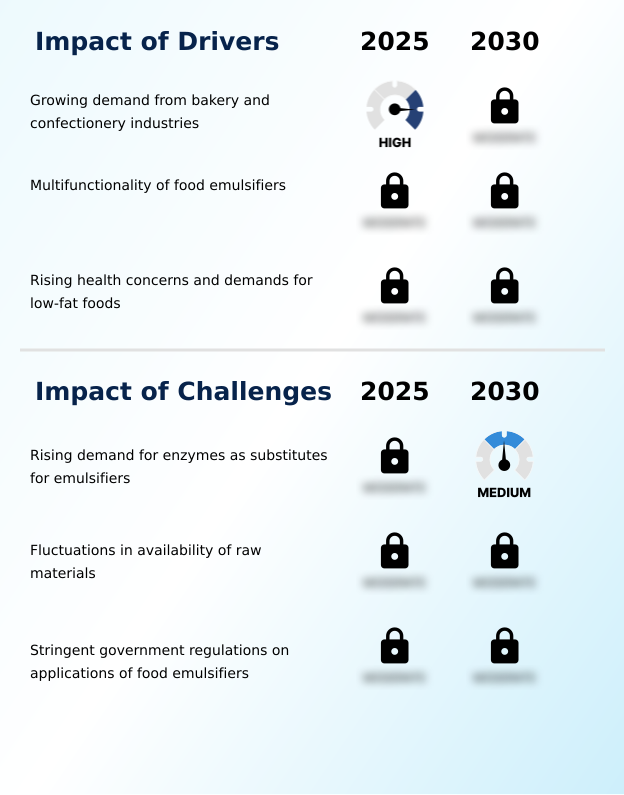
Our researchers analyzed the data with 2025 as the base year, along with the key drivers, trends, and challenges. A holistic analysis of drivers will help companies refine their marketing strategies to gain a competitive advantage.
- Food scientists face complex challenges when developing modern processed foods, necessitating a deep understanding of ingredient functionality. The debate over sunflower lecithin vs soy lecithin performance often centers on allergen concerns and non-GMO availability, influencing choices for natural emulsifiers for clean label baking.
- For plant-based milks, selecting the right emulsifier systems is critical to prevent sedimentation and achieve a desirable mouthfeel. Similarly, improving texture in low-fat dairy products requires specialized agents that can mimic the creaminess of full-fat versions. In spreads, preventing oil separation in natural spreads is a primary goal, often achieved with precisely balanced ingredient systems.
- The role of PGPR in chocolate manufacturing is indispensable for controlling viscosity, just as specific emulsifiers are essential for achieving gluten-free bread volume. For beverage makers, stabilizing high-protein beverage formulations without compromising taste is a significant hurdle. Many manufacturers explore cost-effective synthetic emulsifier alternatives while navigating the complex regulatory status of novel food emulsifiers.
- The ultimate goal is to create stable vegan mayonnaise emulsions or ensure shelf-life extension in packaged snacks. The functionality of polysorbates in ice cream remains a benchmark for texture, though innovations in enzyme technology replacing chemical emulsifiers are gaining traction.
- Formulations leveraging this new technology have demonstrated a 40% faster development cycle compared to traditional methods, showcasing significant operational efficiency gains. This shift is also influenced by sustainable emulsifier sourcing strategies and the specific impact of mono-diglyceride impact on cake softness.
What are the key market drivers leading to the rise in the adoption of Food Emulsifiers Industry?
- The growing demand from the bakery and confectionery industries for ingredients that improve product quality, texture, and consistency is a primary market driver.
- Market growth is significantly driven by the expanding convenience food sector and the rising consumer focus on health and wellness. The need for extended convenience food shelf-life and improved texture in processed goods makes emulsifiers indispensable.
- In parallel, the demand for low-fat food development and effective fat reduction in foods has spurred the use of emulsifiers as fat mimetics.
- These ingredients are crucial for improving mouthfeel in beverages and other products without adding calories, enabling manufacturers to offer healthier options that do not sacrifice sensory appeal.
- For instance, specialized emulsifiers have allowed for a 30% fat reduction in certain dairy products while maintaining creaminess. In the bakery segment, anti-staling agents effectively extend the freshness of bread by up to 7 days, reducing waste.
What are the market trends shaping the Food Emulsifiers Industry?
- Ongoing new product development and innovation are key trends shaping the market. The focus is on delivering ingredients with enhanced functionality and cleaner labels to meet evolving consumer preferences.
- Key market trends are centered on innovation in clean-label ingredient sourcing and the expansion of digital traceability platforms. The demand for plant-based emulsifiers and non-GMO food additives is compelling manufacturers to reformulate products, moving away from synthetic options. This shift is supported by hybrid emulsifier systems and advanced enzymatic processing techniques that deliver comparable functionality with a cleaner profile.
- As a result, companies are adopting AI-driven formulation tools to accelerate development, with some achieving a 15% faster time-to-market for new vegan food formulations. Furthermore, implementing digital traceability has been shown to improve supply chain transparency and efficiency by over 18%, meeting consumer demands for sourcing visibility and enhancing food safety compliance across the board.
What challenges does the Food Emulsifiers Industry face during its growth?
- The rising demand for enzymes as a substitute for traditional emulsifiers presents a significant challenge to market growth, driven largely by consumer demand for clean-label products.
- The market faces considerable challenges from raw material volatility and stringent regulatory frameworks. The reliance on agricultural commodities makes the industry susceptible to price fluctuations, driving the search for sustainable palm oil alternatives and resilient supply chains. Ensuring supply chain transparency and food safety compliance adds another layer of complexity, particularly with the evolving regulatory status of novel food emulsifiers.
- These factors can impact profitability, with raw material price spikes leading to production cost increases of up to 12% in a single quarter for some manufacturers.
- Failure to adhere to strict labeling and composition standards can result in costly product recalls, which have historically affected nearly 5% of new product launches in highly regulated markets, underscoring the critical importance of diligent compliance.
Exclusive Technavio Analysis on Customer Landscape
The food emulsifiers market forecasting report includes the adoption lifecycle of the market, covering from the innovator’s stage to the laggard’s stage. It focuses on adoption rates in different regions based on penetration. Furthermore, the food emulsifiers market report also includes key purchase criteria and drivers of price sensitivity to help companies evaluate and develop their market growth analysis strategies.
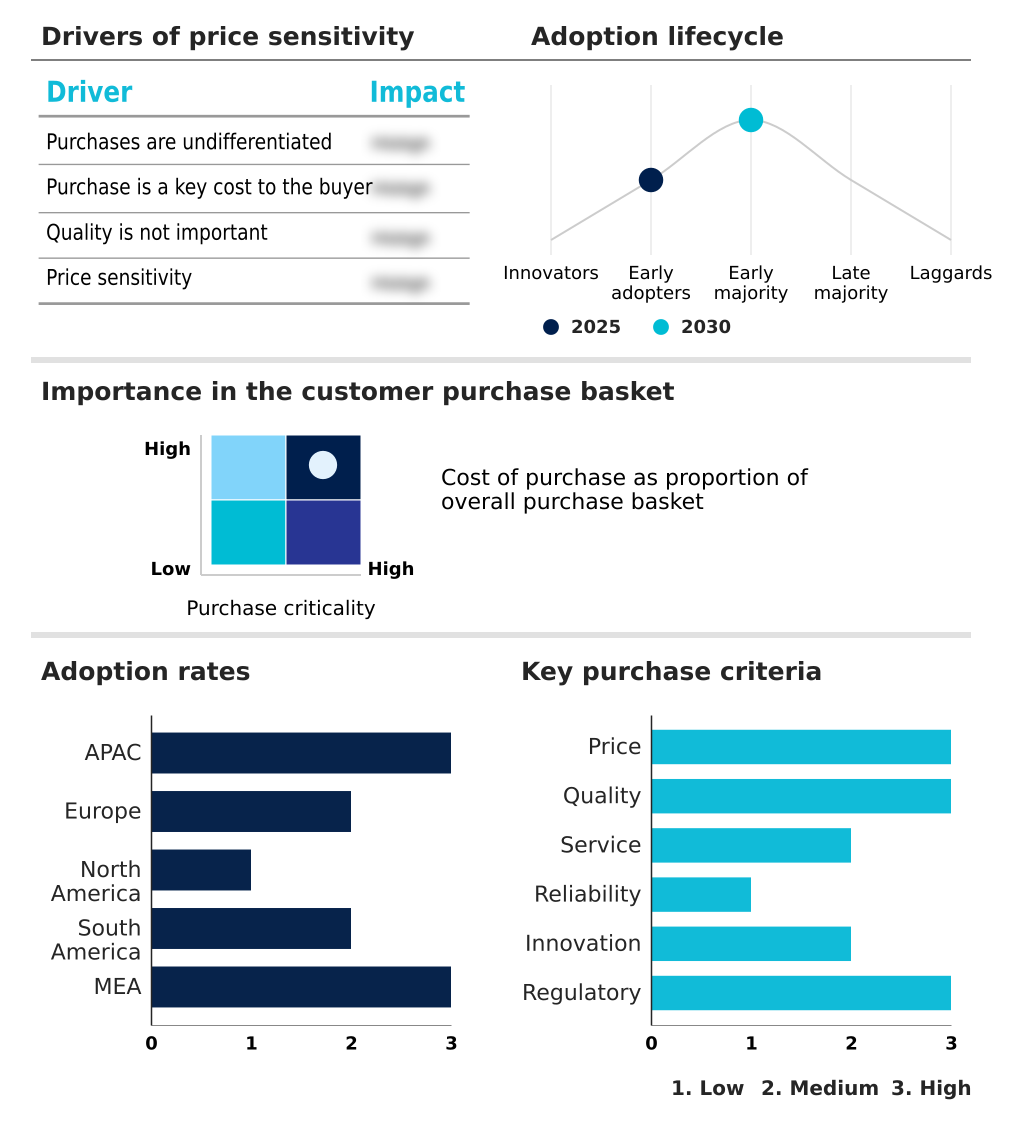
Customer Landscape of Food Emulsifiers Industry
Competitive Landscape
Companies are implementing various strategies, such as strategic alliances, food emulsifiers market forecast, partnerships, mergers and acquisitions, geographical expansion, and product/service launches, to enhance their presence in the industry.
Archer Daniels Midland Co. - Key offerings focus on texture modification and shelf-life extension, leveraging advanced encapsulation technology to ensure superior product stability and functional performance in diverse food systems.
The industry research and growth report includes detailed analyses of the competitive landscape of the market and information about key companies, including:
- Archer Daniels Midland Co.
- Cargill Inc.
- Corbion N.V.
- Croda International Plc
- DSM Firmenich AG
- Estelle Chemicals Pvt. Ltd.
- Evonik Industries AG
- Ingredion Inc.
- Kerry Group Plc
- LASENOR EMUL SL
- Louis Dreyfus Co. BV
- Oleon NV
- Palsgaard AS
- Puratos NV SA
- Riken Vitamin Co Ltd.
- Solvay SA
- Stepan Co.
- Taiyo Kagaku Co. Ltd.
- Univar Solutions Inc.
Qualitative and quantitative analysis of companies has been conducted to help clients understand the wider business environment as well as the strengths and weaknesses of key industry players. Data is qualitatively analyzed to categorize companies as pure play, category-focused, industry-focused, and diversified; it is quantitatively analyzed to categorize companies as dominant, leading, strong, tentative, and weak.
Recent Development and News in Food emulsifiers market
- In September 2024, Cargill Inc. announced the opening of a new production facility dedicated to sunflower lecithin, enhancing its capacity for non-GMO and allergen-free food solutions to meet rising demand for clean-label ingredients.
- In November 2024, Kerry Group Plc launched a new enzyme-emulsifier blend designed to replace synthetic mono- and diglycerides in industrial bread production, allowing manufacturers to achieve cleaner ingredient declarations without compromising on texture or volume.
- In February 2025, Corbion N.V. introduced a clean-label emulsification solution for refrigerated sauces and dressings, engineered to provide superior stability and mouthfeel while replacing titanium dioxide and modified starches.
- In May 2025, DSM Firmenich AG completed the acquisition of a European biotechnology startup specializing in enzymatic emulsifiers, strengthening its portfolio of sustainable, high-performance ingredients for the dairy and bakery sectors.
Dive into Technavio’s robust research methodology, blending expert interviews, extensive data synthesis, and validated models for unparalleled Food Emulsifiers Market insights. See full methodology.
| Market Scope | |
|---|---|
| Page number | 303 |
| Base year | 2025 |
| Historic period | 2020-2024 |
| Forecast period | 2026-2030 |
| Growth momentum & CAGR | Accelerate at a CAGR of 5.5% |
| Market growth 2026-2030 | USD 1171.0 million |
| Market structure | Fragmented |
| YoY growth 2025-2026(%) | 5.1% |
| Key countries | China, Japan, India, South Korea, Australia, Indonesia, Germany, France, UK, Italy, Spain, The Netherlands, US, Canada, Mexico, Brazil, Argentina, Colombia, South Africa, Saudi Arabia, UAE, Egypt and Nigeria |
| Competitive landscape | Leading Companies, Market Positioning of Companies, Competitive Strategies, and Industry Risks |
Research Analyst Overview
- The food emulsifiers market is defined by its critical role in food microstructure engineering, enabling texture modification and shelf-life extension across the industry. Key ingredients such as mono- and diglycerides, lecithin, and sorbitan esters remain fundamental, but the landscape is shifting toward enzymatic emulsifiers and advanced clean-label emulsifiers.
- This transition presents a boardroom-level strategic decision: invest in new technologies like cold-press extraction and chemical solvent-free processing or risk losing market share to more innovative competitors. The adoption of plant-based emulsifiers sourced from non-GMO and RSPO-certified supply chains is no longer optional.
- Successful implementation of these advanced ingredients, which offer superior fat mimetic properties and aeration improvement, is essential for new product development. For instance, companies investing in high-purity functional phospholipids for nutritional applications have reported a 15% improvement in bioavailability, directly impacting product value.
- The industry is moving beyond simple interfacial tension reduction to sophisticated dough conditioning, fat crystallization control, and starch complexing agents that deliver tangible performance benefits.
What are the Key Data Covered in this Food Emulsifiers Market Research and Growth Report?
-
What is the expected growth of the Food Emulsifiers Market between 2026 and 2030?
-
USD 1.17 billion, at a CAGR of 5.5%
-
-
What segmentation does the market report cover?
-
The report is segmented by Product (Mono-di-glycerides and derivatives, Lecithin, and Others), Application (Bakery and confectionery, Convenience foods, Dairy products, and Others), Source (Plant-based, Synthetic, and Animal-based) and Geography (APAC, Europe, North America, South America, Middle East and Africa)
-
-
Which regions are analyzed in the report?
-
APAC, Europe, North America, South America and Middle East and Africa
-
-
What are the key growth drivers and market challenges?
-
Growing demand from bakery and confectionery industries, Rising demand for enzymes as substitutes for emulsifiers
-
-
Who are the major players in the Food Emulsifiers Market?
-
Archer Daniels Midland Co., Cargill Inc., Corbion N.V., Croda International Plc, DSM Firmenich AG, Estelle Chemicals Pvt. Ltd., Evonik Industries AG, Ingredion Inc., Kerry Group Plc, LASENOR EMUL SL, Louis Dreyfus Co. BV, Oleon NV, Palsgaard AS, Puratos NV SA, Riken Vitamin Co Ltd., Solvay SA, Stepan Co., Taiyo Kagaku Co. Ltd. and Univar Solutions Inc.
-
Market Research Insights
- Market dynamics are shaped by a pronounced shift toward clean-label ingredient sourcing and sustainable palm oil alternatives, compelling manufacturers to innovate. Companies are increasingly adopting allergen-free food solutions and trans-fat-free solutions to meet both regulatory mandates and consumer health demands.
- This strategic pivot is delivering measurable results; for instance, optimizing chocolate viscosity control with sunflower-based lecithin has enabled some producers to achieve a 15% reduction in high-cost cocoa butter usage. Similarly, the implementation of advanced hybrid emulsifier systems in convenience foods improves shelf-stability by over 20%, reducing waste and enhancing profitability.
- As AI-driven formulation tools become more accessible, the pace of innovation in vegan food formulation and low-fat product development continues to accelerate, creating new avenues for growth.
We can help! Our analysts can customize this food emulsifiers market research report to meet your requirements.
 RIA -
RIA - 
