Potassium Sorbate Market Analysis, Size, and Forecast 2026-2030: North America (US, Canada, and Mexico), Europe (Germany, France, and UK), APAC (China, India, and Japan), South America (Brazil, Argentina, and Chile), Middle East and Africa (South Africa, Saudi Arabia, and UAE), and Rest of World (ROW)

Potassium Sorbate Market Analysis, Size, and Forecast 2026-2030:
North America (US, Canada, and Mexico), Europe (Germany, France, and UK), APAC (China, India, and Japan), South America (Brazil, Argentina, and Chile), Middle East and Africa (South Africa, Saudi Arabia, and UAE), and Rest of World (ROW)

Published: Oct 2026 324 Pages SKU: IRTNTR72429

Market Overview at a Glance

$68.66 Mn
Market Opportunity
5.5%
CAGR 2025 - 2030
43.6%
North America Growth
$89.56 Mn
Food and beverages segment 2024

Potassium Sorbate Market Size 2026-2030

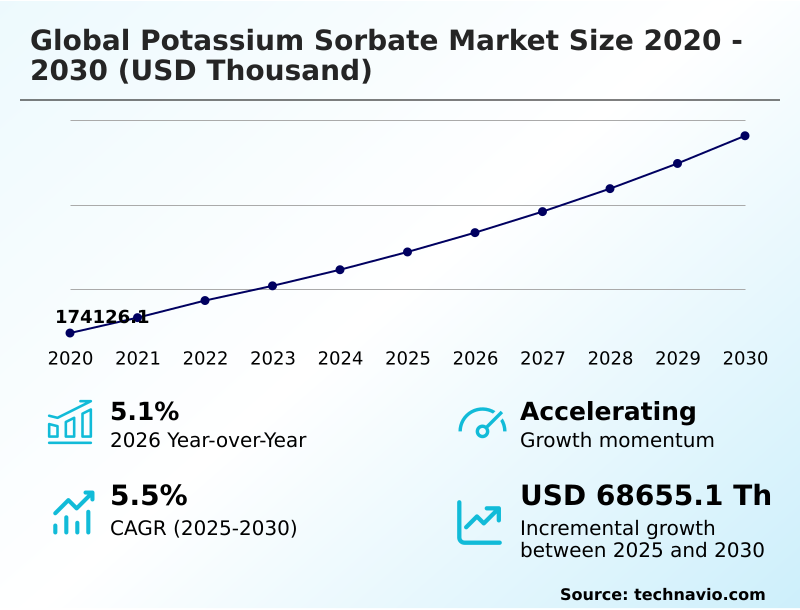
The potassium sorbate market size is valued to increase by USD 68.66 million, at a CAGR of 5.5% from 2025 to 2030. Expansion of global processed food and beverage industry will drive the potassium sorbate market.

Major Market Trends & Insights

  • North America dominated the market and accounted for a 43.6% growth during the forecast period.
  • By End-user - Food and beverages segment was valued at USD 89.56 million in 2024
  • By Form Factor - Powder segment accounted for the largest market revenue share in 2024

Market Size & Forecast

  • Market Opportunities:
  • Market Future Opportunities: USD 68.66 million
  • CAGR from 2025 to 2030 : 5.5%

Market Summary

  • The Potassium Sorbate Market demonstrates resilient demand driven by the critical need for microbial inhibition in modern consumer packaged goods. Food processors and cosmetic formulators rely on this highly effective additive to maintain product integrity across a complex multi-climate distribution network.
  • For instance, in commercial dairy processing, optimizing the integration of liquid preservative blends allows facilities to eliminate secondary batch-mixing stages, thereby reducing continuous processing time by 18% compared to traditional powder dispersion methods. The primary driver propelling this sector is the rapid expansion of the processed food industry, which requires dependable fungistatic protection to ensure long-term shelf stability.
  • Conversely, the market faces significant structural constraints due to supply chain volatility associated with centralized sorbic acid synthesis. Reliance on concentrated manufacturing hubs creates frequent logistical bottlenecks and pricing fluctuations. Despite these procurement challenges, stringent adherence to hazard analysis critical control point protocols ensures that industrial consumers maintain steady order volumes, stabilizing overall consumption patterns across major end-use sectors.

What will be the Size of the Potassium Sorbate Market during the forecast period?
Get Key Insights on Market Forecast (PDF) Get Free Sample

How is the Potassium Sorbate Market Segmented?

The potassium sorbate industry research report provides comprehensive data (region-wise segment analysis), with forecasts and estimates in "USD thousand" for the period 2026-2030, as well as historical data from 2020-2024 for the following segments.

  • End-user
    • Food and beverages
    • Pharmaceuticals
    • Personal care and cosmetics
    • Others
  • Form factor
    • Powder
    • Granular
    • Liquid
  • Distribution channel
    • Direct sales
    • Distributors
    • Specialty suppliers
    • Online channels
    • Others
  • Geography
    • North America
      • US
      • Canada
      • Mexico
    • Europe
      • Germany
      • France
      • UK
      • Italy
      • Spain
      • The Netherlands
    • APAC
      • China
      • India
      • Japan
      • South Korea
      • Indonesia
      • Australia
    • South America
      • Brazil
      • Argentina
      • Chile
    • Middle East and Africa
      • South Africa
      • Saudi Arabia
      • UAE
      • Egypt
      • Turkey

By End-user Insights

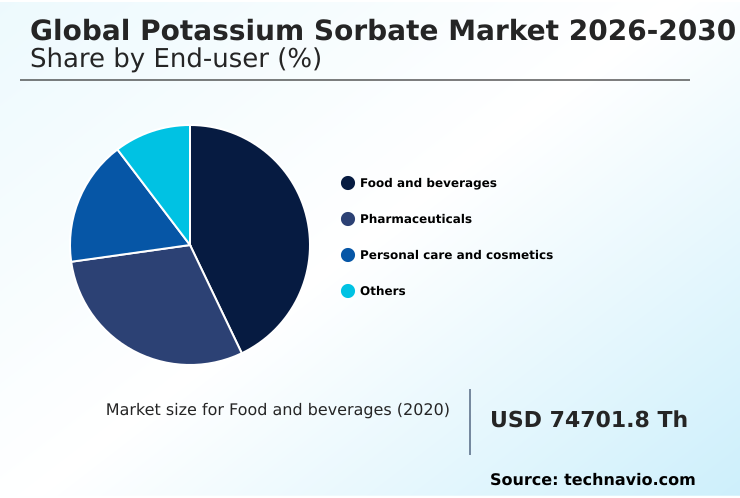
The food and beverages segment is estimated to witness significant growth during the forecast period.

The food and beverages segment represents a fundamental consumption anchor for the Potassium Sorbate Market, driven by the continuous requirement for microbial stability in mass-produced consumables.

Industrial processors rely heavily on this antimicrobial preservative due to its neutral organoleptic profile and high thermal stability during production. In particular, its deployment across an industrial bakery application or carbonated beverage stabilization process ensures prolonged freshness and safety.

Implementation of advanced particulate formats has improved automated dosing accuracy by 15%, significantly reducing airborne dust in manufacturing facilities.

Furthermore, production lines utilizing this targeted mold inhibitor have demonstrated a 20% improvement in continuous throughput compared to traditional batch-mixing preservation techniques.

This operational efficiency allows major food manufacturers to streamline supply chain logistics while preserving strict compliance with international food safety management standards.
Get Free Sample

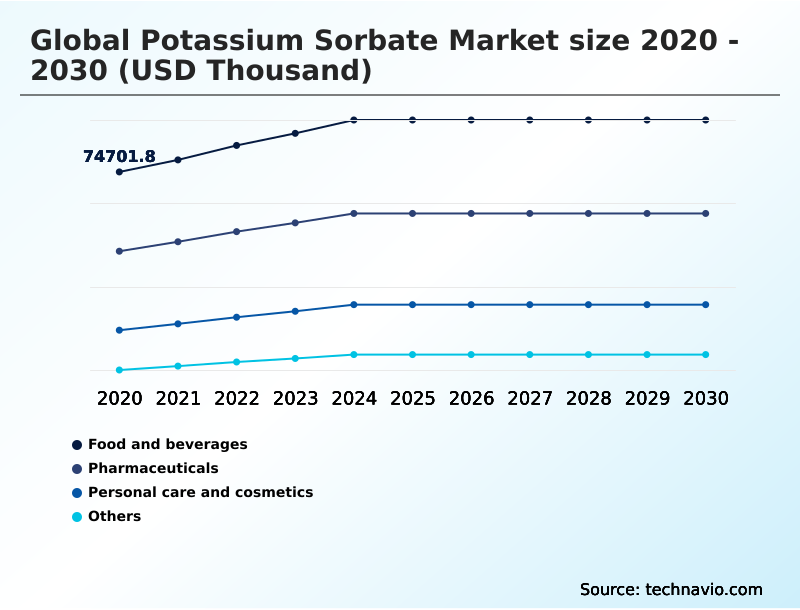
The Food and beverages segment was valued at USD 89.56 million in 2024 and showed a gradual increase during the forecast period.
Get Free Sample

Regional Analysis

North America is estimated to contribute 43.6% to the growth of the global market during the forecast period.Technavio’s analysts have elaborately explained the regional trends and drivers that shape the market during the forecast period.
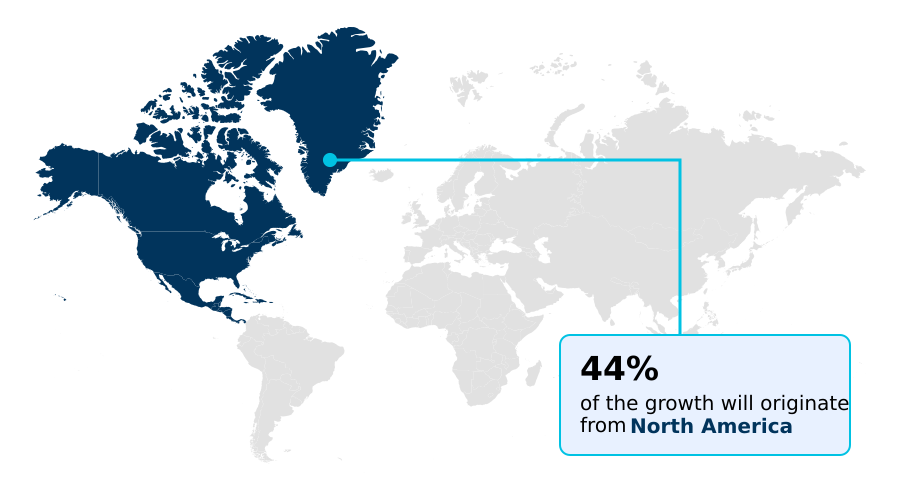
See How Potassium Sorbate Market Demand is Rising in North America Get Free Sample

Regional dynamics within the Potassium Sorbate Market reveal distinct adoption patterns influenced by local processing infrastructure and climatic demands.

North America maintains highly automated supply chains where standardized potassium hydroxide neutralization protocols yield high-purity grades, enabling a 24% higher adoption rate of the granular format compared to the APAC region.

This disparity stems from the heavy reliance of North American commercial canning facility networks on automated dosing to achieve consistent yeast suppression and aqueous solubility.

Conversely, the APAC region demonstrates rapid consumption growth driven by necessary post-harvest loss reduction strategies, though fragmented logistics infrastructure limits continuous production efficiency.

By implementing proactive regional safety stock allocations, European distributors have achieved a 15% reduction in freight-related delays compared to South American fulfillment channels.

Ultimately, these localized strategies enhance supply chain resilience, allowing processors across varied climates to maintain uninterrupted manufacturing schedules and strict compliance with microbiological stability standards.

Market Dynamics

Our researchers analyzed the data with 2025 as the base year, along with the key drivers, trends, and challenges. A holistic analysis of drivers will help companies refine their marketing strategies to gain a competitive advantage.

  • The evolution of formulation science has fundamentally transformed how industrial processors approach long-term product integrity and safety. A central focus remains on achieving extended shelf stability for baked goods, where maintaining moisture content without encouraging fungal proliferation is an absolute operational necessity.
  • By integrating advanced granulation technologies, ingredient manufacturers have prioritized hygroscopicity reduction in granular preservatives, preventing clumping during high-humidity maritime transit and ensuring seamless flowability in automated factory hoppers. This physical enhancement has allowed large-scale bakeries to increase dosing accuracy by a margin of 12% over traditional powdered alternatives, directly lowering ingredient wastage and optimizing inventory planning.
  • Furthermore, the application of these solutions has expanded deeply into the personal care sector. Formulators mandate stringent microbial spoilage prevention in cosmetics to replace controversial synthetic biocides, ensuring that topical emulsions remain safe for consumer use after repeated container opening. However, procurement executives must continually navigate the inherent sorbic acid dependency in supply chains.
  • Because raw material synthesis remains geographically concentrated, localized disruptions frequently force international distributors to hold elevated safety stock buffers to guarantee continuous fulfillment. This strategic inventory buffering mitigates fulfillment risks, ensuring that diverse manufacturing sectors experience uninterrupted access to essential antimicrobial stabilization technologies.
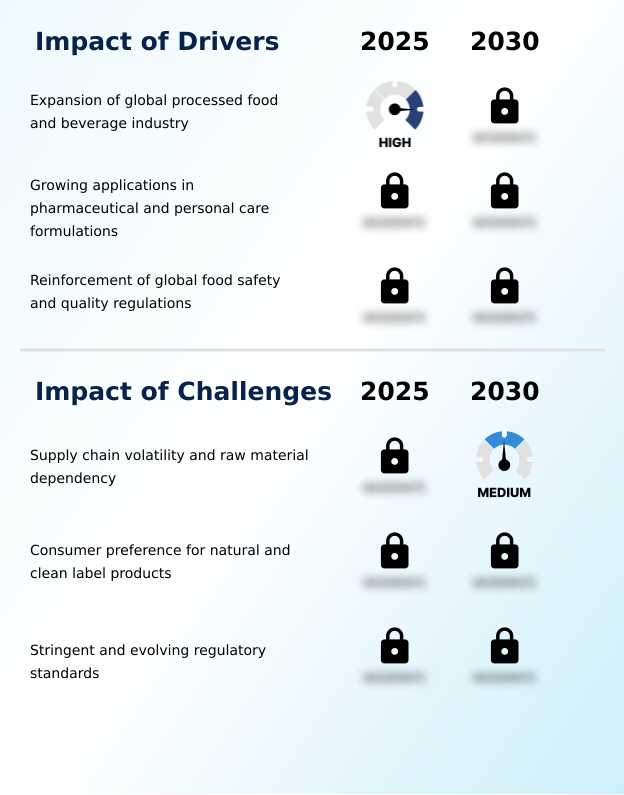
What are the key market drivers leading to the rise in the adoption of Potassium Sorbate Industry?

  • The continuous expansion of the processed food and beverage industry acts as the primary catalyst propelling market demand for reliable preservation solutions.

  • The imperative for extended supply chain durability serves as the primary catalyst accelerating demand within the Potassium Sorbate Market. Massive expansion in global food processing necessitates robust shelf-life extension to ensure products survive complex distribution logistics without degradation.
  • By incorporating highly soluble preservative grades, commercial beverage processors utilizing high-shear mechanical agitation have improved batch homogenization speed by 22%, significantly lowering overall production cycle times.
  • Furthermore, this reliable fungal inhibition allows companies to utilize ambient temperature shipping rather than costly refrigerated freight, subsequently reducing transportation energy expenditures by 15%.
  • This measurable inventory spoilage mitigation directly aligns with stringent food safety management protocols, allowing industrial manufacturers to enhance product safety margins while maximizing operational profitability and reducing preventable downstream retail waste.

What are the market trends shaping the Potassium Sorbate Industry?

  • The ascendancy of clean label and transparent formulations represents a defining trend shaping current market dynamics. This shift compels manufacturers to innovate preservation strategies that balance consumer demand for natural ingredients with essential microbiological stability.

  • Shifting consumer priorities toward ingredient transparency are driving profound technological adaptations within the Potassium Sorbate Market. Formulators are actively developing hybrid stabilization systems that blend traditional antimicrobials with emerging bio-based fermentates to create viable clean-label alternative solutions. This trend forces manufacturers to optimize ingredient compatibility within a continuous manufacturing environment.
  • By adopting advanced cold-process integration techniques, cosmetic and beverage producers have lowered thermal processing energy usage by 18% compared to conventional heat-sterilization methods. Furthermore, the deployment of specialized granular formulations through automated pneumatic transfer conduit systems has reduced airborne dust contamination by 30%, drastically improving occupational safety metrics.
  • These technical shifts enable processing facilities to maintain required microbial suppression thresholds while accelerating production timelines and responding swiftly to shifting consumer preferences for transparent, highly stable formulated products.

What challenges does the Potassium Sorbate Industry face during its growth?

  • Persistent supply chain volatility and a strong dependency on localized raw material production present critical challenges that consistently constrain industry growth and pricing stability.

  • Structural vulnerabilities in localized manufacturing networks present persistent operational hurdles for the Potassium Sorbate Market. The heavy reliance on geographically centralized sorbic acid synthesis creates an inflexible supply chain, making downstream industrial consumers highly susceptible to fulfillment disruptions.
  • When a geopolitical trade dispute or localized environmental shutdown restricts the availability of this critical raw material precursor, procurement costs for refined preservatives can surge unexpectedly. Consequently, distributors have been forced to increase regional safety stock buffers by 20%, tying up critical working capital in standing inventory.
  • Furthermore, continuously evolving regulatory compliance standard frameworks require costly, recurring validation of the toxicological safety profile for new product applications. These stringent administrative requirements can delay product-to-market launch cycles by up to 12%, significantly constraining agile formulation adjustments across the manufacturing sector.

Exclusive Technavio Analysis on Customer Landscape

The potassium sorbate market forecasting report includes the adoption lifecycle of the market, covering from the innovator’s stage to the laggard’s stage. It focuses on adoption rates in different regions based on penetration. Furthermore, the potassium sorbate market report also includes key purchase criteria and drivers of price sensitivity to help companies evaluate and develop their market growth analysis strategies.
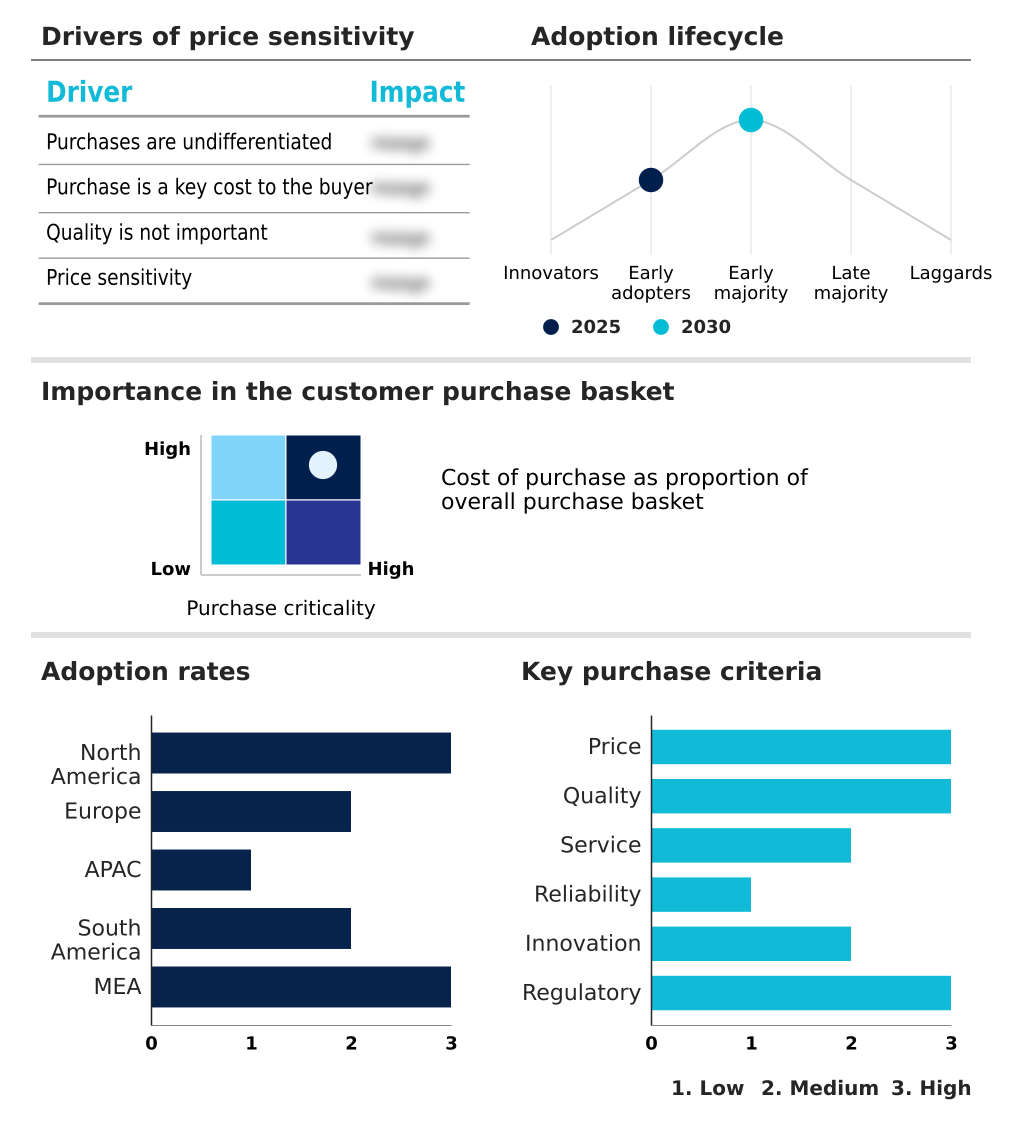
Customer Landscape of Potassium Sorbate Industry

Competitive Landscape

Companies are implementing various strategies, such as strategic alliances, potassium sorbate market forecast, partnerships, mergers and acquisitions, geographical expansion, and product/service launches, to enhance their presence in the industry.

Albemarle Corp. - The company provides high-purity potassium sorbate designed to deliver reliable antimicrobial preservation, extending shelf life and ensuring microbial stability across diverse industrial food and pharmaceutical formulations.

The industry research and growth report includes detailed analyses of the competitive landscape of the market and information about key companies, including:

  • Albemarle Corp.
  • Arkema Group
  • BASF SE
  • Clariant International Ltd.
  • Covestro AG
  • Croda International Plc
  • DIC Corp.
  • Dow Chemical Co.
  • DuPont de Nemours Inc.
  • Eastman Chemical Co.
  • Evonik Industries AG
  • Huntsman International LLC
  • Lanxess AG
  • LyondellBasell Industries N.V.
  • Saudi Basic Industries
  • Shin Etsu Chemical Co. Ltd.
  • Sumitomo Chemical Co. Ltd.
  • Syensqo SA
  • The Mitsubishi Chemical Group
  • Wacker Chemie AG

Qualitative and quantitative analysis of companies has been conducted to help clients understand the wider business environment as well as the strengths and weaknesses of key industry players. Data is qualitatively analyzed to categorize companies as pure play, category-focused, industry-focused, and diversified; it is quantitatively analyzed to categorize companies as dominant, leading, strong, tentative, and weak.

Recent Development and News in Potassium sorbate market

  • In the Specialty Chemicals industry, the rapid transition toward bio-based fermentates and natural extract technologies accelerated the diversification of preservation portfolios, directly impacting Potassium Sorbate demand by forcing manufacturers to optimize hybrid synthetic-natural stabilization systems.
  • Stringent environmental regulations targeting volatile organic compounds compelled formulators to increase reliance on water-soluble organic acid salts, driving elevated utilization of established chemical preservatives across industrial coatings and agricultural applications.
  • Logistical disruptions and raw material precursor shortages exposed critical vulnerabilities in localized manufacturing networks, prompting international distributors to enhance supply chain resilience by establishing decentralized warehouse infrastructure and increasing regional safety stock reserves for essential food additives.
  • The widespread implementation of advanced digital procurement platform architectures across the chemical distribution sector streamlined multi-ingredient sourcing, improving the speed and efficiency with which tier-one industrial consumer networks acquired bulk preservation ingredients.

Dive into Technavio’s robust research methodology, blending expert interviews, extensive data synthesis, and validated models for unparalleled Potassium Sorbate Market insights. See full methodology.

Market Scope
Page number 324
Base year 2025
Historic period 2020-2024
Forecast period 2026-2030
Growth momentum & CAGR Accelerate at a CAGR of 5.5%
Market growth 2026-2030 USD 68655.1 thousand
Market structure Fragmented
YoY growth 2025-2026(%) 5.1%
Key countries US, Canada, Mexico, Germany, France, UK, Italy, Spain, The Netherlands, China, India, Japan, South Korea, Indonesia, Australia, Brazil, Argentina, Chile, South Africa, Saudi Arabia, UAE, Egypt and Turkey
Competitive landscape Leading Companies, Market Positioning of Companies, Competitive Strategies, and Industry Risks

Request Free Sample

Research Analyst Overview

  • The Potassium Sorbate Market is undergoing a sophisticated transition as industrial formulators optimize microbiological defense mechanisms against tightening regulatory frameworks. Modern processors are increasingly leveraging microencapsulation technology to mask flavor profiles and control the release of active antimicrobial agents, particularly enhancing dairy product preservation and complex food matrices.
  • By utilizing synergistic organic acids, manufacturers provide broad-spectrum aerobic bacteria control without elevating production costs. This strategic shift is highly evident in the pharmaceutical sector, where precise excipient stabilization in a pharmaceutical liquid formulation is non-negotiable for patient safety. Facilities transitioning to a pre-dissolved liquid format have achieved a 25% reduction in batch-mixing cycle times, significantly enhancing overall facility throughput.
  • Furthermore, the integration of high-purity grades for topical emulsion preservation ensures robust defense against yeast and mold in high-moisture personal care products. These technological advancements empower formulation teams to strategically align their portfolios with any clean-label mandate while achieving a superior broad-spectrum antimicrobial resilience across diverse global supply chains.

What are the Key Data Covered in this Potassium Sorbate Market Research and Growth Report?

  • What is the expected growth of the Potassium Sorbate Market between 2026 and 2030?

    • USD 68.66 million, at a CAGR of 5.5%

  • What segmentation does the market report cover?

    • The report is segmented by End-user (Food and beverages, Pharmaceuticals, Personal care and cosmetics, and Others), Form Factor (Powder, Granular, and Liquid), Distribution Channel (Direct sales, Distributors, Specialty suppliers, Online channels, and Others) and Geography (North America, Europe, APAC, South America, Middle East and Africa)

  • Which regions are analyzed in the report?

    • North America, Europe, APAC, South America and Middle East and Africa

  • What are the key growth drivers and market challenges?

    • Expansion of global processed food and beverage industry, Supply chain volatility and raw material dependency

  • Who are the major players in the Potassium Sorbate Market?

    • Albemarle Corp., Arkema Group, BASF SE, Clariant International Ltd., Covestro AG, Croda International Plc, DIC Corp., Dow Chemical Co., DuPont de Nemours Inc., Eastman Chemical Co., Evonik Industries AG, Huntsman International LLC, Lanxess AG, LyondellBasell Industries N.V., Saudi Basic Industries, Shin Etsu Chemical Co. Ltd., Sumitomo Chemical Co. Ltd., Syensqo SA, The Mitsubishi Chemical Group and Wacker Chemie AG

Market Research Insights

  • The Potassium Sorbate Market exhibits sustained operational integration as formulators seek advanced microbiological stabilization methods. Modern chemical procurement strategies have prioritized the toxicological safety profile of these additives, allowing manufacturers to align with strict public health directives. By adopting closed-loop inline injection systems for liquid formats, industrial bottling facilities have reduced chemical handling errors by 22%, significantly enhancing worker safety.
  • Furthermore, transitioning to high-purity granular grades for ambient temperature shipping has lowered inventory spoilage rates by 14% compared to standard powder alternatives. These efficiency gains demonstrate how cold-process integration capabilities allow commercial processors to lower energy consumption by 11%, ultimately improving return on investment without compromising product shelf life.

We can help! Our analysts can customize this potassium sorbate market research report to meet your requirements.

Get in touch

1. Executive Summary

1.1 Market overview

Executive Summary - Chart on Market Overview
Executive Summary - Data Table on Market Overview
Executive Summary - Chart on Global Market Characteristics
Executive Summary - Chart on Market by Geography
Executive Summary - Chart on Market Segmentation by End-user
Executive Summary - Chart on Market Segmentation by Form Factor
Executive Summary - Chart on Market Segmentation by Distribution Channel
Executive Summary - Chart on Incremental Growth
Executive Summary - Data Table on Incremental Growth
Executive Summary - Chart on Company Market Positioning

2. Technavio Analysis

2.1 Analysis of price sensitivity, lifecycle, customer purchase basket, adoption rates, and purchase criteria

2.2 Criticality of inputs and Factors of differentiation

Chart on Overview on criticality of inputs and factors of differentiation

2.3 Factors of disruption

Chart on Overview on factors of disruption

2.4 Impact of drivers and challenges

Chart on Impact of drivers and challenges in 2025 and 2030

3. Market Landscape

3.1 Market ecosystem

Chart on Parent Market
Data Table on - Parent Market

3.2 Market characteristics

Chart on Market characteristics analysis

3.3 Value chain analysis

Chart on Value chain analysis

4. Market Sizing

4.1 Market definition

Data Table on Offerings of companies included in the market definition

4.2 Market segment analysis

Market segments

4.3 Market size 2025

4.4 Market outlook: Forecast for 2025-2030

Chart on Global - Market size and forecast 2025-2030 ($ thousand)
Data Table on Global - Market size and forecast 2025-2030 ($ thousand)
Chart on Global Market: Year-over-year growth 2025-2030 (%)
Data Table on Global Market: Year-over-year growth 2025-2030 (%)

5. Historic Market Size

5.1 Global Potassium Sorbate Market 2020 - 2024

Historic Market Size - Data Table on Global Potassium Sorbate Market 2020 - 2024 ($ thousand)

5.2 End-user segment analysis 2020 - 2024

Historic Market Size - End-user Segment 2020 - 2024 ($ thousand)

5.3 Form Factor segment analysis 2020 - 2024

Historic Market Size - Form Factor Segment 2020 - 2024 ($ thousand)

5.4 Distribution Channel segment analysis 2020 - 2024

Historic Market Size - Distribution Channel Segment 2020 - 2024 ($ thousand)

5.5 Geography segment analysis 2020 - 2024

Historic Market Size - Geography Segment 2020 - 2024 ($ thousand)

5.6 Country segment analysis 2020 - 2024

Historic Market Size - Country Segment 2020 - 2024 ($ thousand)

6. Qualitative Analysis

6.1 Impact of AI on Global Potassium Sorbate Market

6.2 Impact of Geopolitical Conflicts on Global Potassium Sorbate Market

7. Five Forces Analysis

7.1 Five forces summary

Five forces analysis - Comparison between 2025 and 2030

7.2 Bargaining power of buyers

Bargaining power of buyers - Impact of key factors 2025 and 2030

7.3 Bargaining power of suppliers

Bargaining power of suppliers - Impact of key factors in 2025 and 2030

7.4 Threat of new entrants

Threat of new entrants - Impact of key factors in 2025 and 2030

7.5 Threat of substitutes

Threat of substitutes - Impact of key factors in 2025 and 2030

7.6 Threat of rivalry

Threat of rivalry - Impact of key factors in 2025 and 2030

7.7 Market condition

Chart on Market condition - Five forces 2025 and 2030

8. Market Segmentation by End-user

8.1 Market segments

Chart on End-user - Market share 2025-2030 (%)
Data Table on End-user - Market share 2025-2030 (%)

8.2 Comparison by End-user

Chart on Comparison by End-user
Data Table on Comparison by End-user

8.3 Food and beverages - Market size and forecast 2025-2030

Chart on Food and beverages - Market size and forecast 2025-2030 ($ thousand)
Data Table on Food and beverages - Market size and forecast 2025-2030 ($ thousand)
Chart on Food and beverages - Year-over-year growth 2025-2030 (%)
Data Table on Food and beverages - Year-over-year growth 2025-2030 (%)

8.4 Pharmaceuticals - Market size and forecast 2025-2030

Chart on Pharmaceuticals - Market size and forecast 2025-2030 ($ thousand)
Data Table on Pharmaceuticals - Market size and forecast 2025-2030 ($ thousand)
Chart on Pharmaceuticals - Year-over-year growth 2025-2030 (%)
Data Table on Pharmaceuticals - Year-over-year growth 2025-2030 (%)

8.5 Personal care and cosmetics - Market size and forecast 2025-2030

Chart on Personal care and cosmetics - Market size and forecast 2025-2030 ($ thousand)
Data Table on Personal care and cosmetics - Market size and forecast 2025-2030 ($ thousand)
Chart on Personal care and cosmetics - Year-over-year growth 2025-2030 (%)
Data Table on Personal care and cosmetics - Year-over-year growth 2025-2030 (%)

8.6 Others - Market size and forecast 2025-2030

Chart on Others - Market size and forecast 2025-2030 ($ thousand)
Data Table on Others - Market size and forecast 2025-2030 ($ thousand)
Chart on Others - Year-over-year growth 2025-2030 (%)
Data Table on Others - Year-over-year growth 2025-2030 (%)

8.7 Market opportunity by End-user

Market opportunity by End-user ($ thousand)
Data Table on Market opportunity by End-user ($ thousand)

9. Market Segmentation by Form Factor

9.1 Market segments

Chart on Form Factor - Market share 2025-2030 (%)
Data Table on Form Factor - Market share 2025-2030 (%)

9.2 Comparison by Form Factor

Chart on Comparison by Form Factor
Data Table on Comparison by Form Factor

9.3 Powder - Market size and forecast 2025-2030

Chart on Powder - Market size and forecast 2025-2030 ($ thousand)
Data Table on Powder - Market size and forecast 2025-2030 ($ thousand)
Chart on Powder - Year-over-year growth 2025-2030 (%)
Data Table on Powder - Year-over-year growth 2025-2030 (%)

9.4 Granular - Market size and forecast 2025-2030

Chart on Granular - Market size and forecast 2025-2030 ($ thousand)
Data Table on Granular - Market size and forecast 2025-2030 ($ thousand)
Chart on Granular - Year-over-year growth 2025-2030 (%)
Data Table on Granular - Year-over-year growth 2025-2030 (%)

9.5 Liquid - Market size and forecast 2025-2030

Chart on Liquid - Market size and forecast 2025-2030 ($ thousand)
Data Table on Liquid - Market size and forecast 2025-2030 ($ thousand)
Chart on Liquid - Year-over-year growth 2025-2030 (%)
Data Table on Liquid - Year-over-year growth 2025-2030 (%)

9.6 Market opportunity by Form Factor

Market opportunity by Form Factor ($ thousand)
Data Table on Market opportunity by Form Factor ($ thousand)

10. Market Segmentation by Distribution Channel

10.1 Market segments

Chart on Distribution Channel - Market share 2025-2030 (%)
Data Table on Distribution Channel - Market share 2025-2030 (%)

10.2 Comparison by Distribution Channel

Chart on Comparison by Distribution Channel
Data Table on Comparison by Distribution Channel

10.3 Direct sales - Market size and forecast 2025-2030

Chart on Direct sales - Market size and forecast 2025-2030 ($ thousand)
Data Table on Direct sales - Market size and forecast 2025-2030 ($ thousand)
Chart on Direct sales - Year-over-year growth 2025-2030 (%)
Data Table on Direct sales - Year-over-year growth 2025-2030 (%)

10.4 Distributors - Market size and forecast 2025-2030

Chart on Distributors - Market size and forecast 2025-2030 ($ thousand)
Data Table on Distributors - Market size and forecast 2025-2030 ($ thousand)
Chart on Distributors - Year-over-year growth 2025-2030 (%)
Data Table on Distributors - Year-over-year growth 2025-2030 (%)

10.5 Specialty suppliers - Market size and forecast 2025-2030

Chart on Specialty suppliers - Market size and forecast 2025-2030 ($ thousand)
Data Table on Specialty suppliers - Market size and forecast 2025-2030 ($ thousand)
Chart on Specialty suppliers - Year-over-year growth 2025-2030 (%)
Data Table on Specialty suppliers - Year-over-year growth 2025-2030 (%)

10.6 Online channels - Market size and forecast 2025-2030

Chart on Online channels - Market size and forecast 2025-2030 ($ thousand)
Data Table on Online channels - Market size and forecast 2025-2030 ($ thousand)
Chart on Online channels - Year-over-year growth 2025-2030 (%)
Data Table on Online channels - Year-over-year growth 2025-2030 (%)

10.7 Others - Market size and forecast 2025-2030

Chart on Others - Market size and forecast 2025-2030 ($ thousand)
Data Table on Others - Market size and forecast 2025-2030 ($ thousand)
Chart on Others - Year-over-year growth 2025-2030 (%)
Data Table on Others - Year-over-year growth 2025-2030 (%)

10.8 Market opportunity by Distribution Channel

Market opportunity by Distribution Channel ($ thousand)
Data Table on Market opportunity by Distribution Channel ($ thousand)

11. Customer Landscape

11.1 Customer landscape overview

Analysis of price sensitivity, lifecycle, customer purchase basket, adoption rates, and purchase criteria

12. Geographic Landscape

12.1 Geographic segmentation

Chart on Market share by geography 2025-2030 (%)
Data Table on Market share by geography 2025-2030 (%)

12.2 Geographic comparison

Chart on Geographic comparison
Data Table on Geographic comparison

12.3 North America - Market size and forecast 2025-2030

Chart on North America - Market size and forecast 2025-2030 ($ thousand)
Data Table on North America - Market size and forecast 2025-2030 ($ thousand)
Chart on North America - Year-over-year growth 2025-2030 (%)
Data Table on North America - Year-over-year growth 2025-2030 (%)
Chart on Regional Comparison - North America
Data Table on Regional Comparison - North America

12.3.1 US - Market size and forecast 2025-2030

Chart on US - Market size and forecast 2025-2030 ($ thousand)
Data Table on US - Market size and forecast 2025-2030 ($ thousand)
Chart on US - Year-over-year growth 2025-2030 (%)
Data Table on US - Year-over-year growth 2025-2030 (%)

12.3.2 Canada - Market size and forecast 2025-2030

Chart on Canada - Market size and forecast 2025-2030 ($ thousand)
Data Table on Canada - Market size and forecast 2025-2030 ($ thousand)
Chart on Canada - Year-over-year growth 2025-2030 (%)
Data Table on Canada - Year-over-year growth 2025-2030 (%)

12.3.3 Mexico - Market size and forecast 2025-2030

Chart on Mexico - Market size and forecast 2025-2030 ($ thousand)
Data Table on Mexico - Market size and forecast 2025-2030 ($ thousand)
Chart on Mexico - Year-over-year growth 2025-2030 (%)
Data Table on Mexico - Year-over-year growth 2025-2030 (%)

12.4 Europe - Market size and forecast 2025-2030

Chart on Europe - Market size and forecast 2025-2030 ($ thousand)
Data Table on Europe - Market size and forecast 2025-2030 ($ thousand)
Chart on Europe - Year-over-year growth 2025-2030 (%)
Data Table on Europe - Year-over-year growth 2025-2030 (%)
Chart on Regional Comparison - Europe
Data Table on Regional Comparison - Europe

12.4.1 Germany - Market size and forecast 2025-2030

Chart on Germany - Market size and forecast 2025-2030 ($ thousand)
Data Table on Germany - Market size and forecast 2025-2030 ($ thousand)
Chart on Germany - Year-over-year growth 2025-2030 (%)
Data Table on Germany - Year-over-year growth 2025-2030 (%)

12.4.2 France - Market size and forecast 2025-2030

Chart on France - Market size and forecast 2025-2030 ($ thousand)
Data Table on France - Market size and forecast 2025-2030 ($ thousand)
Chart on France - Year-over-year growth 2025-2030 (%)
Data Table on France - Year-over-year growth 2025-2030 (%)

12.4.3 UK - Market size and forecast 2025-2030

Chart on UK - Market size and forecast 2025-2030 ($ thousand)
Data Table on UK - Market size and forecast 2025-2030 ($ thousand)
Chart on UK - Year-over-year growth 2025-2030 (%)
Data Table on UK - Year-over-year growth 2025-2030 (%)

12.4.4 Italy - Market size and forecast 2025-2030

Chart on Italy - Market size and forecast 2025-2030 ($ thousand)
Data Table on Italy - Market size and forecast 2025-2030 ($ thousand)
Chart on Italy - Year-over-year growth 2025-2030 (%)
Data Table on Italy - Year-over-year growth 2025-2030 (%)

12.4.5 Spain - Market size and forecast 2025-2030

Chart on Spain - Market size and forecast 2025-2030 ($ thousand)
Data Table on Spain - Market size and forecast 2025-2030 ($ thousand)
Chart on Spain - Year-over-year growth 2025-2030 (%)
Data Table on Spain - Year-over-year growth 2025-2030 (%)

12.4.6 The Netherlands - Market size and forecast 2025-2030

Chart on The Netherlands - Market size and forecast 2025-2030 ($ thousand)
Data Table on The Netherlands - Market size and forecast 2025-2030 ($ thousand)
Chart on The Netherlands - Year-over-year growth 2025-2030 (%)
Data Table on The Netherlands - Year-over-year growth 2025-2030 (%)

12.5 APAC - Market size and forecast 2025-2030

Chart on APAC - Market size and forecast 2025-2030 ($ thousand)
Data Table on APAC - Market size and forecast 2025-2030 ($ thousand)
Chart on APAC - Year-over-year growth 2025-2030 (%)
Data Table on APAC - Year-over-year growth 2025-2030 (%)
Chart on Regional Comparison - APAC
Data Table on Regional Comparison - APAC

12.5.1 China - Market size and forecast 2025-2030

Chart on China - Market size and forecast 2025-2030 ($ thousand)
Data Table on China - Market size and forecast 2025-2030 ($ thousand)
Chart on China - Year-over-year growth 2025-2030 (%)
Data Table on China - Year-over-year growth 2025-2030 (%)

12.5.2 India - Market size and forecast 2025-2030

Chart on India - Market size and forecast 2025-2030 ($ thousand)
Data Table on India - Market size and forecast 2025-2030 ($ thousand)
Chart on India - Year-over-year growth 2025-2030 (%)
Data Table on India - Year-over-year growth 2025-2030 (%)

12.5.3 Japan - Market size and forecast 2025-2030

Chart on Japan - Market size and forecast 2025-2030 ($ thousand)
Data Table on Japan - Market size and forecast 2025-2030 ($ thousand)
Chart on Japan - Year-over-year growth 2025-2030 (%)
Data Table on Japan - Year-over-year growth 2025-2030 (%)

12.5.4 South Korea - Market size and forecast 2025-2030

Chart on South Korea - Market size and forecast 2025-2030 ($ thousand)
Data Table on South Korea - Market size and forecast 2025-2030 ($ thousand)
Chart on South Korea - Year-over-year growth 2025-2030 (%)
Data Table on South Korea - Year-over-year growth 2025-2030 (%)

12.5.5 Indonesia - Market size and forecast 2025-2030

Chart on Indonesia - Market size and forecast 2025-2030 ($ thousand)
Data Table on Indonesia - Market size and forecast 2025-2030 ($ thousand)
Chart on Indonesia - Year-over-year growth 2025-2030 (%)
Data Table on Indonesia - Year-over-year growth 2025-2030 (%)

12.5.6 Australia - Market size and forecast 2025-2030

Chart on Australia - Market size and forecast 2025-2030 ($ thousand)
Data Table on Australia - Market size and forecast 2025-2030 ($ thousand)
Chart on Australia - Year-over-year growth 2025-2030 (%)
Data Table on Australia - Year-over-year growth 2025-2030 (%)

12.6 South America - Market size and forecast 2025-2030

Chart on South America - Market size and forecast 2025-2030 ($ thousand)
Data Table on South America - Market size and forecast 2025-2030 ($ thousand)
Chart on South America - Year-over-year growth 2025-2030 (%)
Data Table on South America - Year-over-year growth 2025-2030 (%)
Chart on Regional Comparison - South America
Data Table on Regional Comparison - South America

12.6.1 Brazil - Market size and forecast 2025-2030

Chart on Brazil - Market size and forecast 2025-2030 ($ thousand)
Data Table on Brazil - Market size and forecast 2025-2030 ($ thousand)
Chart on Brazil - Year-over-year growth 2025-2030 (%)
Data Table on Brazil - Year-over-year growth 2025-2030 (%)

12.6.2 Argentina - Market size and forecast 2025-2030

Chart on Argentina - Market size and forecast 2025-2030 ($ thousand)
Data Table on Argentina - Market size and forecast 2025-2030 ($ thousand)
Chart on Argentina - Year-over-year growth 2025-2030 (%)
Data Table on Argentina - Year-over-year growth 2025-2030 (%)

12.6.3 Chile - Market size and forecast 2025-2030

Chart on Chile - Market size and forecast 2025-2030 ($ thousand)
Data Table on Chile - Market size and forecast 2025-2030 ($ thousand)
Chart on Chile - Year-over-year growth 2025-2030 (%)
Data Table on Chile - Year-over-year growth 2025-2030 (%)

12.7 Middle East and Africa - Market size and forecast 2025-2030

Chart on Middle East and Africa - Market size and forecast 2025-2030 ($ thousand)
Data Table on Middle East and Africa - Market size and forecast 2025-2030 ($ thousand)
Chart on Middle East and Africa - Year-over-year growth 2025-2030 (%)
Data Table on Middle East and Africa - Year-over-year growth 2025-2030 (%)
Chart on Regional Comparison - Middle East and Africa
Data Table on Regional Comparison - Middle East and Africa

12.7.1 South Africa - Market size and forecast 2025-2030

Chart on South Africa - Market size and forecast 2025-2030 ($ thousand)
Data Table on South Africa - Market size and forecast 2025-2030 ($ thousand)
Chart on South Africa - Year-over-year growth 2025-2030 (%)
Data Table on South Africa - Year-over-year growth 2025-2030 (%)

12.7.2 Saudi Arabia - Market size and forecast 2025-2030

Chart on Saudi Arabia - Market size and forecast 2025-2030 ($ thousand)
Data Table on Saudi Arabia - Market size and forecast 2025-2030 ($ thousand)
Chart on Saudi Arabia - Year-over-year growth 2025-2030 (%)
Data Table on Saudi Arabia - Year-over-year growth 2025-2030 (%)

12.7.3 UAE - Market size and forecast 2025-2030

Chart on UAE - Market size and forecast 2025-2030 ($ thousand)
Data Table on UAE - Market size and forecast 2025-2030 ($ thousand)
Chart on UAE - Year-over-year growth 2025-2030 (%)
Data Table on UAE - Year-over-year growth 2025-2030 (%)

12.7.4 Egypt - Market size and forecast 2025-2030

Chart on Egypt - Market size and forecast 2025-2030 ($ thousand)
Data Table on Egypt - Market size and forecast 2025-2030 ($ thousand)
Chart on Egypt - Year-over-year growth 2025-2030 (%)
Data Table on Egypt - Year-over-year growth 2025-2030 (%)

12.7.5 Turkey - Market size and forecast 2025-2030

Chart on Turkey - Market size and forecast 2025-2030 ($ thousand)
Data Table on Turkey - Market size and forecast 2025-2030 ($ thousand)
Chart on Turkey - Year-over-year growth 2025-2030 (%)
Data Table on Turkey - Year-over-year growth 2025-2030 (%)

12.8 Market opportunity by geography

Market opportunity by geography ($ thousand)
Data Tables on Market opportunity by geography ($ thousand)

13. Drivers, Challenges, and Opportunity

13.1 Market drivers

Expansion of global processed food and beverage industry
Growing applications in pharmaceutical and personal care formulations
Reinforcement of global food safety and quality regulations

13.2 Market challenges

Supply chain volatility and raw material dependency
Consumer preference for natural and clean label products
Stringent and evolving regulatory standards

13.3 Impact of drivers and challenges

Impact of drivers and challenges in 2025 and 2030

13.4 Market opportunities

Ascendancy of clean label and transparent formulations
Technological advancements in formulation and delivery
Shifting production landscapes and supply chain optimization

14. Competitive Landscape

14.1 Overview

14.2

Overview on criticality of inputs and factors of differentiation

14.3 Landscape disruption

Overview on factors of disruption

14.4 Industry risks

Impact of key risks on business

15. Competitive Analysis

15.1 Companies profiled

Companies covered

15.2 Company ranking index

15.3 Market positioning of companies

Matrix on companies position and classification

15.4 Arkema Group

Arkema Group - Overview
Arkema Group - Business segments
Arkema Group - Key news
Arkema Group - Key offerings
Arkema Group - Segment focus
SWOT

15.5 BASF SE

BASF SE - Overview
BASF SE - Business segments
BASF SE - Key news
BASF SE - Key offerings
BASF SE - Segment focus
SWOT

15.6 Covestro AG

Covestro AG - Overview
Covestro AG - Business segments
Covestro AG - Key news
Covestro AG - Key offerings
Covestro AG - Segment focus
SWOT

15.7 DIC Corp.

DIC Corp. - Overview
DIC Corp. - Business segments
DIC Corp. - Key news
DIC Corp. - Key offerings
DIC Corp. - Segment focus
SWOT

15.8 Dow Chemical Co.

Dow Chemical Co. - Overview
Dow Chemical Co. - Business segments
Dow Chemical Co. - Key news
Dow Chemical Co. - Key offerings
Dow Chemical Co. - Segment focus
SWOT

15.9 DuPont de Nemours Inc.

DuPont de Nemours Inc. - Overview
DuPont de Nemours Inc. - Business segments
DuPont de Nemours Inc. - Key news
DuPont de Nemours Inc. - Key offerings
DuPont de Nemours Inc. - Segment focus
SWOT

15.10 Eastman Chemical Co.

Eastman Chemical Co. - Overview
Eastman Chemical Co. - Business segments
Eastman Chemical Co. - Key offerings
Eastman Chemical Co. - Segment focus
SWOT

15.11 Evonik Industries AG

Evonik Industries AG - Overview
Evonik Industries AG - Business segments
Evonik Industries AG - Key news
Evonik Industries AG - Key offerings
Evonik Industries AG - Segment focus
SWOT

15.12 Lanxess AG

Lanxess AG - Overview
Lanxess AG - Business segments
Lanxess AG - Key offerings
Lanxess AG - Segment focus
SWOT

15.13 LyondellBasell Industries N.V.

LyondellBasell Industries N.V. - Overview
LyondellBasell Industries N.V. - Business segments
LyondellBasell Industries N.V. - Key news
LyondellBasell Industries N.V. - Key offerings
LyondellBasell Industries N.V. - Segment focus
SWOT

15.14 Saudi Basic Industries

Saudi Basic Industries - Overview
Saudi Basic Industries - Business segments
Saudi Basic Industries - Key offerings
Saudi Basic Industries - Segment focus
SWOT

15.15 Shin Etsu Chemical Co. Ltd.

Shin Etsu Chemical Co. Ltd. - Overview
Shin Etsu Chemical Co. Ltd. - Business segments
Shin Etsu Chemical Co. Ltd. - Key offerings
Shin Etsu Chemical Co. Ltd. - Segment focus
SWOT

15.16 Sumitomo Chemical Co. Ltd.

Sumitomo Chemical Co. Ltd. - Overview
Sumitomo Chemical Co. Ltd. - Business segments
Sumitomo Chemical Co. Ltd. - Key offerings
Sumitomo Chemical Co. Ltd. - Segment focus
SWOT

15.17 Syensqo SA

Syensqo SA - Overview
Syensqo SA - Business segments
Syensqo SA - Key news
Syensqo SA - Key offerings
Syensqo SA - Segment focus
SWOT

15.18 The Mitsubishi Chemical Group

The Mitsubishi Chemical Group - Overview
The Mitsubishi Chemical Group - Business segments
The Mitsubishi Chemical Group - Key news
The Mitsubishi Chemical Group - Key offerings
The Mitsubishi Chemical Group - Segment focus
SWOT

16. Appendix

16.1 Scope of the report

Market definition
Objectives
Notes and caveats

16.2 Inclusions and exclusions checklist

Inclusions checklist
Exclusions checklist

16.3 Currency conversion rates for US$

16.4 Research methodology

16.5 Data procurement

Information sources

16.6 Data validation

16.7 Validation techniques employed for market sizing

16.8 Data synthesis

16.9 360 degree market analysis

16.10 List of abbreviations

Research Methodology

Technavio presents a detailed picture of the market by way of study, synthesis, and summation of data from multiple sources. The analysts have presented the various facets of the market with a particular focus on identifying the key industry influencers. The data thus presented is comprehensive, reliable, and the result of extensive research, both primary and secondary.

INFORMATION SOURCES

Primary sources

  • Manufacturers and suppliers
  • Channel partners
  • Industry experts
  • Strategic decision makers

Secondary sources

  • Industry journals and periodicals
  • Government data
  • Financial reports of key industry players
  • Historical data
  • Press releases

DATA ANALYSIS

Data Synthesis

  • Collation of data
  • Estimation of key figures
  • Analysis of derived insights

Data Validation

  • Triangulation with data models
  • Reference against proprietary databases
  • Corroboration with industry experts

REPORT WRITING

Qualitative

  • Market drivers
  • Market challenges
  • Market trends
  • Five forces analysis

Quantitative

  • Market size and forecast
  • Market segmentation
  • Geographical insights
  • Competitive landscape

Interested in this report?

Get your sample now to see our research methodology and insights!

Download Now

Frequently Asked Questions

Potassium Sorbate market growth will increase by USD 68655.1 thousand thousand during 2026-2030.

The Potassium Sorbate market is expected to grow at a CAGR of 5.5% during 2026-2030.

Potassium Sorbate market is segmented by End-user (Food and beverages, Pharmaceuticals, Personal care and cosmetics, Others) Form factor (Powder, Granular, Liquid) Distribution channel (Direct sales, Distributors, Specialty suppliers, Online channels, Others)

Albemarle Corp., Arkema Group, BASF SE, Clariant International Ltd., Covestro AG, Croda International Plc, DIC Corp., Dow Chemical Co., DuPont de Nemours Inc., Eastman Chemical Co., Evonik Industries AG, Huntsman International LLC, Lanxess AG, LyondellBasell Industries N.V., Saudi Basic Industries, Shin Etsu Chemical Co. Ltd., Sumitomo Chemical Co. Ltd., Syensqo SA, The Mitsubishi Chemical Group, Wacker Chemie AG are a few of the key vendors in the Potassium Sorbate market.

North America will register the highest growth rate of 43.6% among the other regions. Therefore, the Potassium Sorbate market in North America is expected to garner significant business opportunities for the vendors during the forecast period.

US, Canada, Mexico, Germany, France, UK, Italy, Spain, The Netherlands, China, India, Japan, South Korea, Indonesia, Australia, Brazil, Argentina, Chile, South Africa, Saudi Arabia, UAE, Egypt, Turkey

  • Expansion of global processed food and beverage industry is the driving factor this market.

The Potassium Sorbate market vendors should focus on grabbing business opportunities from the End-user segment as it accounted for the largest market share in the base year.
RIA - Research AI Assistant
Ask RIA
