Forensic Equipment Supplies Market Size 2025-2029
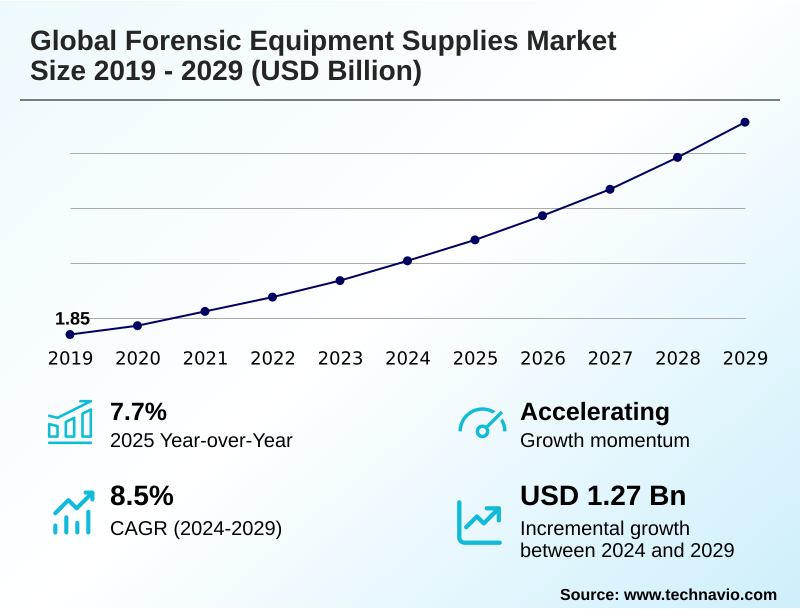
The forensic equipment supplies market size is valued to increase by USD 1.27 billion, at a CAGR of 8.5% from 2024 to 2029. Regular use of toxicology testing in pharmaceutical and biotechnology industries will drive the forensic equipment supplies market.
Major Market Trends & Insights
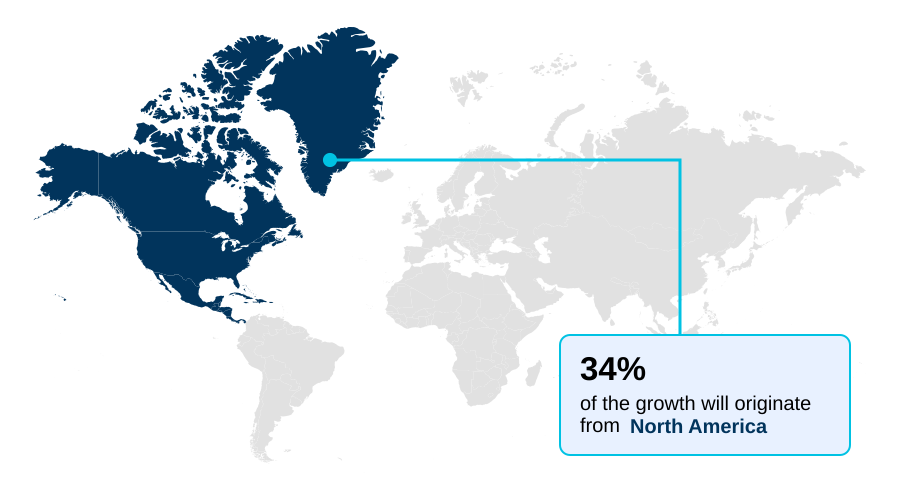
- North America dominated the market and accounted for a 34.5% growth during the forecast period.
- By Application - Drug testing segment was valued at USD 722.1 million in 2023
- By End-user - Law enforcement agencies segment accounted for the largest market revenue share in 2023
Market Size & Forecast
- Market Opportunities: USD 1.93 billion
- Market Future Opportunities: USD 1.27 billion
- CAGR from 2024 to 2029 : 8.5%
Market Summary
What will be the Size of the Forensic Equipment Supplies Market during the forecast period?
Get Key Insights on Market Forecast (PDF) Get Free Sample
How is the Forensic Equipment Supplies Market Segmented?
The forensic equipment supplies industry research report provides comprehensive data (region-wise segment analysis), with forecasts and estimates in "USD million" for the period 2025-2029, as well as historical data from 2019-2023 for the following segments.
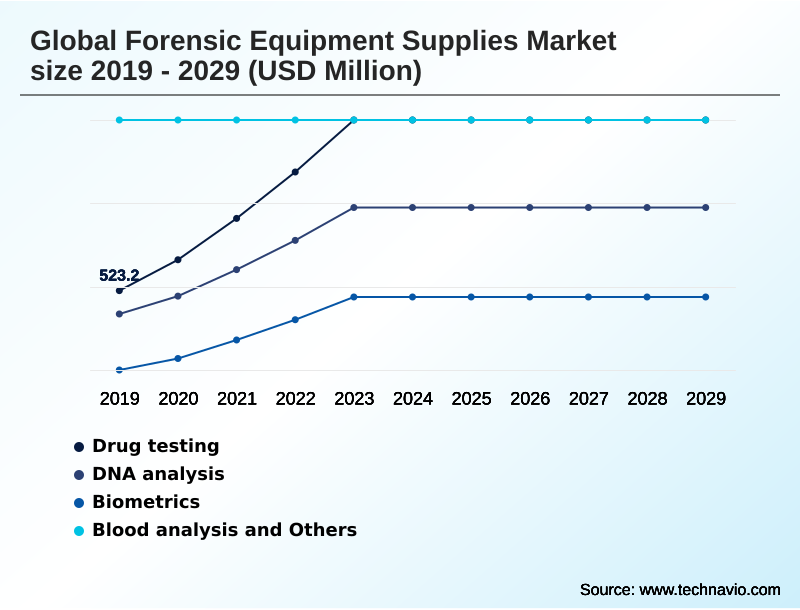
- Application
- Drug testing
- DNA analysis
- Biometrics
- Blood analysis
- Others
- End-user
- Law enforcement agencies
- Healthcare
- Others
- Product
- Reagents and consumables
- Instruments
- Low temperature storage devices
- Evidence drying cabinets
- Geography
- North America
- US
- Canada
- Mexico
- Europe
- UK
- Germany
- France
- Asia
- Rest of World (ROW)
- North America
By Application Insights
The drug testing segment is estimated to witness significant growth during the forecast period.
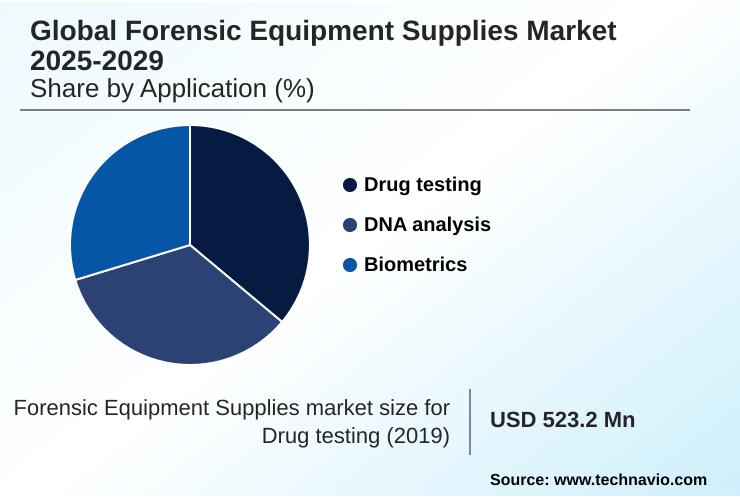
The Drug testing segment was valued at USD 722.1 million in 2023 and showed a gradual increase during the forecast period.
Regional Analysis
North America is estimated to contribute 34.5% to the growth of the global market during the forecast period.Technavio’s analysts have elaborately explained the regional trends and drivers that shape the market during the forecast period.
See How Forensic Equipment Supplies Market Demand is Rising in North America Get Free Sample
Market Dynamics
Our researchers analyzed the data with 2024 as the base year, along with the key drivers, trends, and challenges. A holistic analysis of drivers will help companies refine their marketing strategies to gain a competitive advantage.
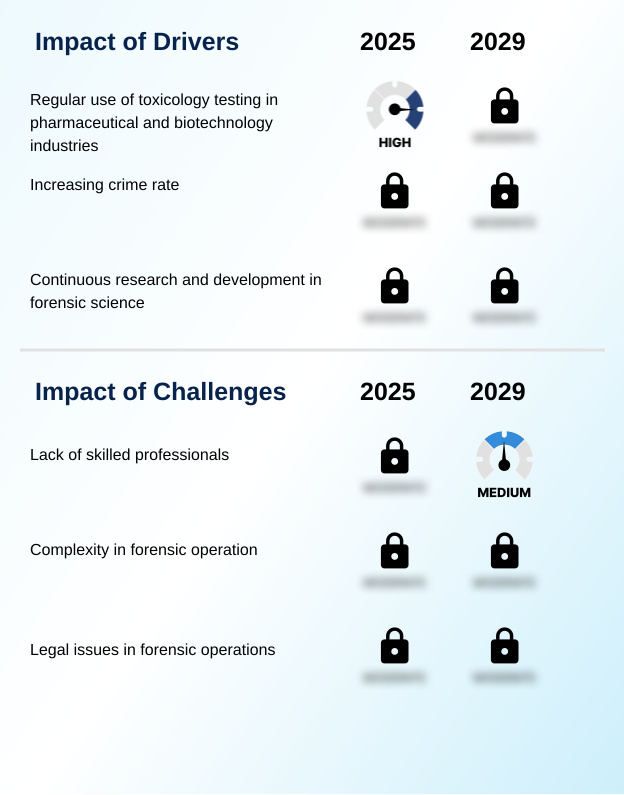
What are the key market drivers leading to the rise in the adoption of Forensic Equipment Supplies Industry?
What are the market trends shaping the Forensic Equipment Supplies Industry?
What challenges does the Forensic Equipment Supplies Industry face during its growth?
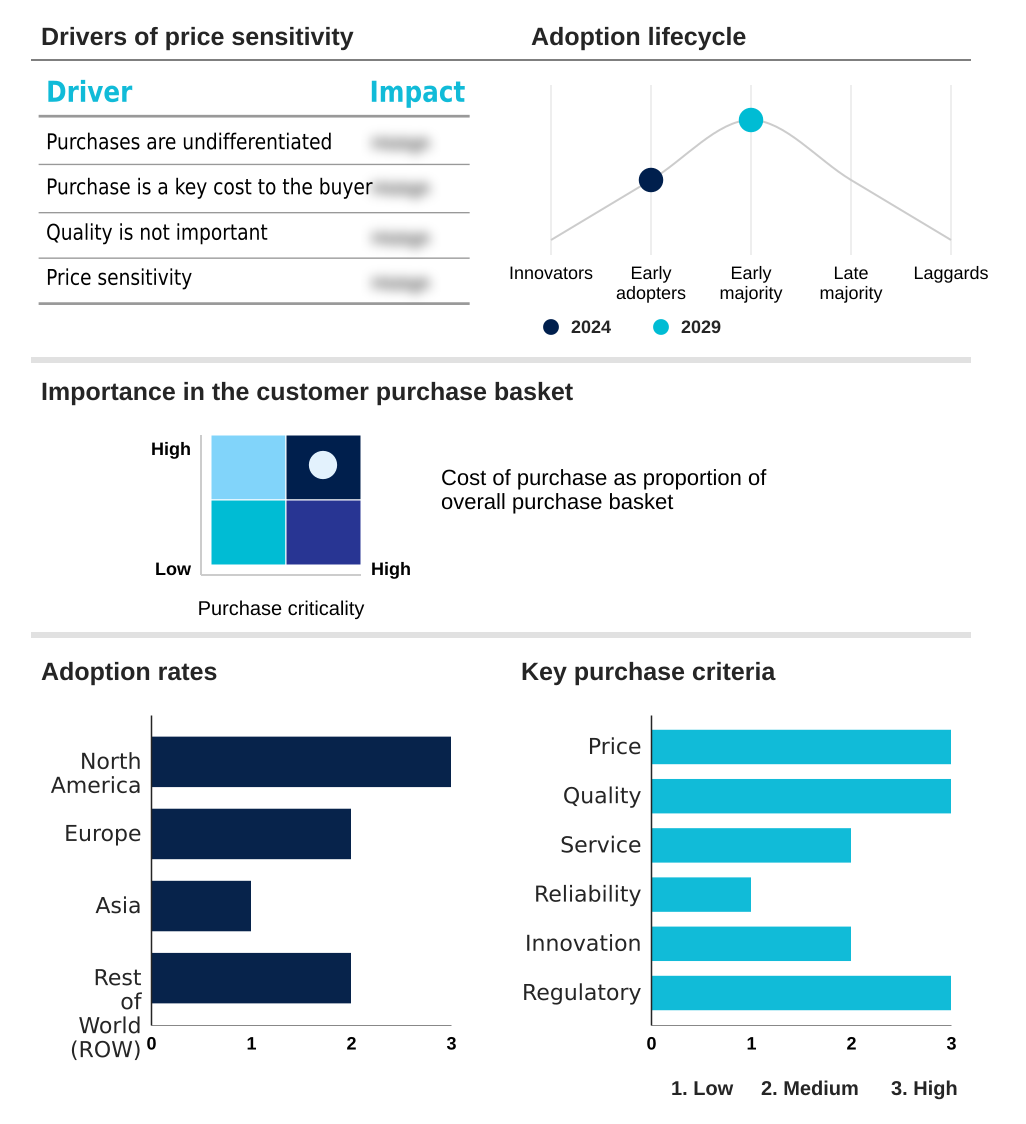
Exclusive Technavio Analysis on Customer Landscape
The forensic equipment supplies market forecasting report includes the adoption lifecycle of the market, covering from the innovator’s stage to the laggard’s stage. It focuses on adoption rates in different regions based on penetration. Furthermore, the forensic equipment supplies market report also includes key purchase criteria and drivers of price sensitivity to help companies evaluate and develop their market growth analysis strategies.
Customer Landscape of Forensic Equipment Supplies Industry
Competitive Landscape
Companies are implementing various strategies, such as strategic alliances, forensic equipment supplies market forecast, partnerships, mergers and acquisitions, geographical expansion, and product/service launches, to enhance their presence in the industry.
Adirolabs Labs Pvt. Ltd. -
The industry research and growth report includes detailed analyses of the competitive landscape of the market and information about key companies, including:
- Adirolabs Labs Pvt. Ltd.
- Agilent Technologies Inc.
- Air Science USA LLC
- Arrowhead Forensics
- Attestor Forensics GmbH
- BVDA International BV
- Crime Scene Investigation Equipment Ltd
- Danaher Corp.
- Eurofins Scientific SE
- General Electric Co.
- HORIBA Ltd.
- Illumina Inc.
- Labconco Corp.
- Lynn Peavey Co.
- PerkinElmer US LLC
- QIAGEN N.V.
- Safariland LLC
- Thermo Fisher Scientific Inc.
- Tritech Forensics Inc.
- Waters Corp.
Qualitative and quantitative analysis of companies has been conducted to help clients understand the wider business environment as well as the strengths and weaknesses of key industry players. Data is qualitatively analyzed to categorize companies as pure play, category-focused, industry-focused, and diversified; it is quantitatively analyzed to categorize companies as dominant, leading, strong, tentative, and weak.
Recent Development and News in Forensic equipment supplies market
Dive into Technavio’s robust research methodology, blending expert interviews, extensive data synthesis, and validated models for unparalleled Forensic Equipment Supplies Market insights. See full methodology.
| Market Scope | |
|---|---|
| Page number | 289 |
| Base year | 2024 |
| Historic period | 2019-2023 |
| Forecast period | 2025-2029 |
| Growth momentum & CAGR | Accelerate at a CAGR of 8.5% |
| Market growth 2025-2029 | USD 1268.9 million |
| Market structure | Fragmented |
| YoY growth 2024-2025(%) | 7.7% |
| Key countries | US, Canada, Mexico, UK, Germany, France, Italy, The Netherlands, Spain, China, Japan, India, South Korea, Thailand, Brazil, Saudi Arabia, UAE, Argentina, Colombia, South Africa, Israel and Turkey |
| Competitive landscape | Leading Companies, Market Positioning of Companies, Competitive Strategies, and Industry Risks |
Research Analyst Overview
What are the Key Data Covered in this Forensic Equipment Supplies Market Research and Growth Report?
-
What is the expected growth of the Forensic Equipment Supplies Market between 2025 and 2029?
-
USD 1.27 billion, at a CAGR of 8.5%
-
-
What segmentation does the market report cover?
-
The report is segmented by Application (Drug testing, DNA analysis, Biometrics, Blood analysis and Others), End-user (Law enforcement agencies, Healthcare and Others), Product (Reagents and consumables, Instruments, Low temperature storage devices and Evidence drying cabinets) and Geography (North America, Europe, Asia, Rest of World (ROW))
-
-
Which regions are analyzed in the report?
-
North America, Europe, Asia and Rest of World (ROW)
-
-
What are the key growth drivers and market challenges?
-
Regular use of toxicology testing in pharmaceutical and biotechnology industries, Lack of skilled professionals
-
-
Who are the major players in the Forensic Equipment Supplies Market?
-
Adirolabs Labs Pvt. Ltd., Agilent Technologies Inc., Air Science USA LLC, Arrowhead Forensics, Attestor Forensics GmbH, BVDA International BV, Crime Scene Investigation Equipment Ltd, Danaher Corp., Eurofins Scientific SE, General Electric Co., HORIBA Ltd., Illumina Inc., Labconco Corp., Lynn Peavey Co., PerkinElmer US LLC, QIAGEN N.V., Safariland LLC, Thermo Fisher Scientific Inc., Tritech Forensics Inc. and Waters Corp.
-
Market Research Insights
We can help! Our analysts can customize this forensic equipment supplies market research report to meet your requirements.
 RIA -
RIA - 
