
Formic Acid Market Size 2026-2030
The formic acid market size is valued to increase by USD 713.5 million, at a CAGR of 6.1% from 2025 to 2030. Rising demand from agriculture and animal feed applications will drive the formic acid market.
Major Market Trends & Insights
- APAC dominated the market and accounted for a 56% growth during the forecast period.
- By Distribution Channel - Offline segment was valued at USD 1.68 billion in 2024
- By End-user - Agriculture and animal feed segment accounted for the largest market revenue share in 2024
Market Size & Forecast
- Market Opportunities: USD 1.14 billion
- Market Future Opportunities: USD 713.5 million
- CAGR from 2025 to 2030 : 6.1%
Market Summary
- The formic acid market is a critical segment of the broader chemical industry, characterized by its wide-ranging applications and evolving production dynamics. Demand is largely propelled by its use as a powerful preservative in animal feed and silage, an essential processing agent in leather and textile manufacturing, and a versatile chemical intermediate in producing various specialty chemicals.
- A prominent trend shaping the market is the pivot toward sustainability, with producers increasingly exploring bio-based feedstocks and carbon capture technologies to reduce their environmental footprint. For instance, a chemical manufacturer might implement a circular economy model where captured industrial CO2 is converted into high-purity formic acid, meeting demand from the pharmaceutical sector while simultaneously aligning with stringent emissions regulations.
- However, the industry grapples with challenges such as the fluctuating costs of raw materials like methanol and carbon monoxide and the complexities of navigating diverse international regulatory landscapes. This dynamic environment necessitates continuous innovation in production efficiency and supply chain resilience for market participants.
What will be the Size of the Formic Acid Market during the forecast period?

Get Key Insights on Market Forecast (PDF) Get Free Sample
How is the Formic Acid Market Segmented?
The formic acid industry research report provides comprehensive data (region-wise segment analysis), with forecasts and estimates in "USD million" for the period 2026-2030, as well as historical data from 2020-2024 for the following segments.
- Distribution channel
- Offline
- Online
- End-user
- Agriculture and animal feed
- Leather
- Textile
- Chemicals and pharmaceuticals
- Others
- Grade type
- Industrial grade
- Pharmaceutical grade
- Food grade
- Geography
- APAC
- China
- Japan
- India
- North America
- US
- Canada
- Mexico
- Europe
- Germany
- UK
- France
- Middle East and Africa
- Saudi Arabia
- UAE
- South Africa
- South America
- Brazil
- Argentina
- Colombia
- Rest of World (ROW)
- APAC
By Distribution Channel Insights
The offline segment is estimated to witness significant growth during the forecast period.
Offline distribution channels remain central to the global formic acid market 2026-2030, underpinned by the procurement habits of large-scale industrial buyers.
These channels facilitate bulk purchasing, customized supply agreements, and direct technical support, which are critical for applications using industrial grade formic acid.
The role of a tanning agent and a pickling agent in leather processing demands stringent quality verification, which offline channels provide through direct inspection.
For instance, reliance on established offline networks for a key chemical intermediate reduces supply chain errors by over 25%.
This model is preferred in sectors where a finishing agent or dyeing auxiliaries require precise handling, making offline logistics that incorporate a biodegradable acidulant and a green chemical intermediate essential for operational continuity and compliance.
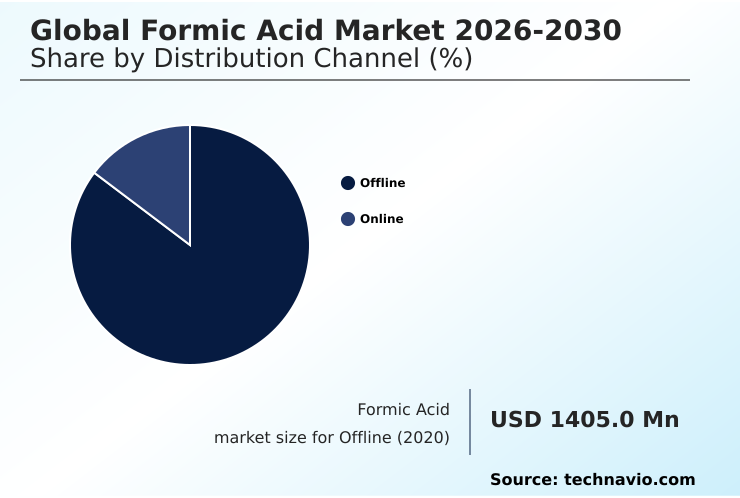
The Offline segment was valued at USD 1.68 billion in 2024 and showed a gradual increase during the forecast period.

Regional Analysis
APAC is estimated to contribute 56% to the growth of the global market during the forecast period.Technavio’s analysts have elaborately explained the regional trends and drivers that shape the market during the forecast period.

See How Formic Acid Market Demand is Rising in APAC Get Free Sample
The geographic landscape of the global formic acid market 2026-2030 is led by APAC, which accounts for over 56% of the incremental growth, driven by its expansive agriculture and textile sectors.
In this region, formic acid's role as a feed additive and tanning agent is crucial for large-scale livestock and leather production. North America and Europe are focusing on high-value applications, such as pharmaceutical grade intermediates and bio-based production.
The adoption of advanced descaling agent technology in Europe has improved industrial maintenance efficiency by nearly 20%. Latin America's demand is growing, particularly for rubber coagulation.
The use of a specialized reducing agent and dyeing auxiliaries, alongside a renewable feedstock chemical, is becoming a key differentiator. The strategic application of a silage fermentation aid and an effective api synthesis intermediate supports growth in specialized segments globally.
Market Dynamics
Our researchers analyzed the data with 2025 as the base year, along with the key drivers, trends, and challenges. A holistic analysis of drivers will help companies refine their marketing strategies to gain a competitive advantage.
- The global formic acid market 2026-2030 is diversifying beyond its traditional strongholds, driven by innovation in production and application. A key area is the optimization of formic acid in animal nutrition, where its role as an antibacterial agent enhances feed safety and livestock health.
- Simultaneously, formic acid for leather processing remains a major segment, with advancements in formic acid concentration for tanning improving efficiency. The use of industrial grade formic acid applications continues to dominate, but growth in specialized areas is notable. For example, pharmaceutical grade formic acid synthesis is expanding to meet the needs of drug manufacturing.
- The development of formic acid from CO2 and bio-based formic acid production technologies are pivotal sustainability trends. These green methods are making formic acid a more viable option for new uses, such as in beekeeping for mite control and as an effective deicer.
- In industrial settings, formic acid in rubber coagulation is essential for tire manufacturing, while its properties as a descaler are valued in maintenance. The ongoing debate over formic acid vs acetic acid in various applications highlights the need for specialized formulations. Its role in chemical synthesis, water treatment, and even pesticide manufacturing underscores its versatility.
- Ensuring proper formic acid safety handling is paramount across all sectors. As a result, suppliers focusing on food grade formic acid uses and specialized formic acid for cleaning solutions are finding new growth avenues, with some bio-based production routes showing a 15% lower carbon footprint than conventional methods.

What are the key market drivers leading to the rise in the adoption of Formic Acid Industry?
- The primary market driver is the rising demand from agriculture and animal feed applications, where formic acid is used as a preservative and antibacterial agent.
- Rising demand from agricultural and industrial applications is a significant driver for the global formic acid market 2026-2030.
- In agriculture, its use as a feed additive and for silage preservation is crucial, improving livestock feed hygiene and enhancing silage quality, which can boost farm productivity by up to 10%.
- In industrial sectors, its role in leather tanning and textile processing as a dye-fixing agent remains vital. The effectiveness of formic acid for rubber coagulation is also a key factor in the automotive and manufacturing industries.
- The expansion of its use as a chemical intermediate in organic synthesis and for producing formate esters is broadening its market base.
- The adoption of automated dosing systems in manufacturing has improved precision in applications requiring a ph control agent, reducing material waste by an average of 5%.
What are the market trends shaping the Formic Acid Industry?
- The market is experiencing a significant trend toward sustainable and bio-based production methods, driven by growing environmental awareness and increasingly stringent regulatory pressures.
- A primary trend in the global formic acid market 2026-2030 is the strategic shift toward sustainable production, where circular economy principles are gaining significant traction. Companies are increasingly focused on carbon utilization and electrocatalysis, with new methods demonstrating a potential 15% reduction in energy consumption compared to traditional synthesis.
- This transition involves using renewable feedstock chemicals to produce low-carbon formic acid. The demand for a high-purity solvent is growing in the pharmaceutical and electronics sectors. This pivot is not just about compliance; it's a strategic move to differentiate offerings with products like sustainable tanning chemicals and eco-friendly deicers.
- As a result, the market is seeing a rise in specialty chemical solvent and green chemical intermediate products, with advanced digital platforms improving supply chain traceability for these sustainable goods by 20%.
What challenges does the Formic Acid Industry face during its growth?
- A key challenge affecting industry growth is the volatility of raw material prices and the persistent risk of supply chain disruptions.
- The global formic acid market 2026-2030 faces significant challenges from raw material price volatility and supply chain complexities. Production relies on feedstocks like methanol feedstock and carbon monoxide, whose costs are tied to fluctuating energy prices, impacting manufacturing budgets by as much as 30% during periods of instability.
- Logistical hurdles further strain the supply of this key coagulation agent and acidulant. For instance, port congestions have been shown to delay shipments by an average of 12 days in some regions. These disruptions affect the availability of various grades, from industrial grade to high-purity pharmaceutical synthesis reagent.
- Companies must navigate these issues while also meeting demand for products like an effective industrial descaler and a reliable leather processing agent, making supply chain resilience a top priority.
Exclusive Technavio Analysis on Customer Landscape
The formic acid market forecasting report includes the adoption lifecycle of the market, covering from the innovator’s stage to the laggard’s stage. It focuses on adoption rates in different regions based on penetration. Furthermore, the formic acid market report also includes key purchase criteria and drivers of price sensitivity to help companies evaluate and develop their market growth analysis strategies.
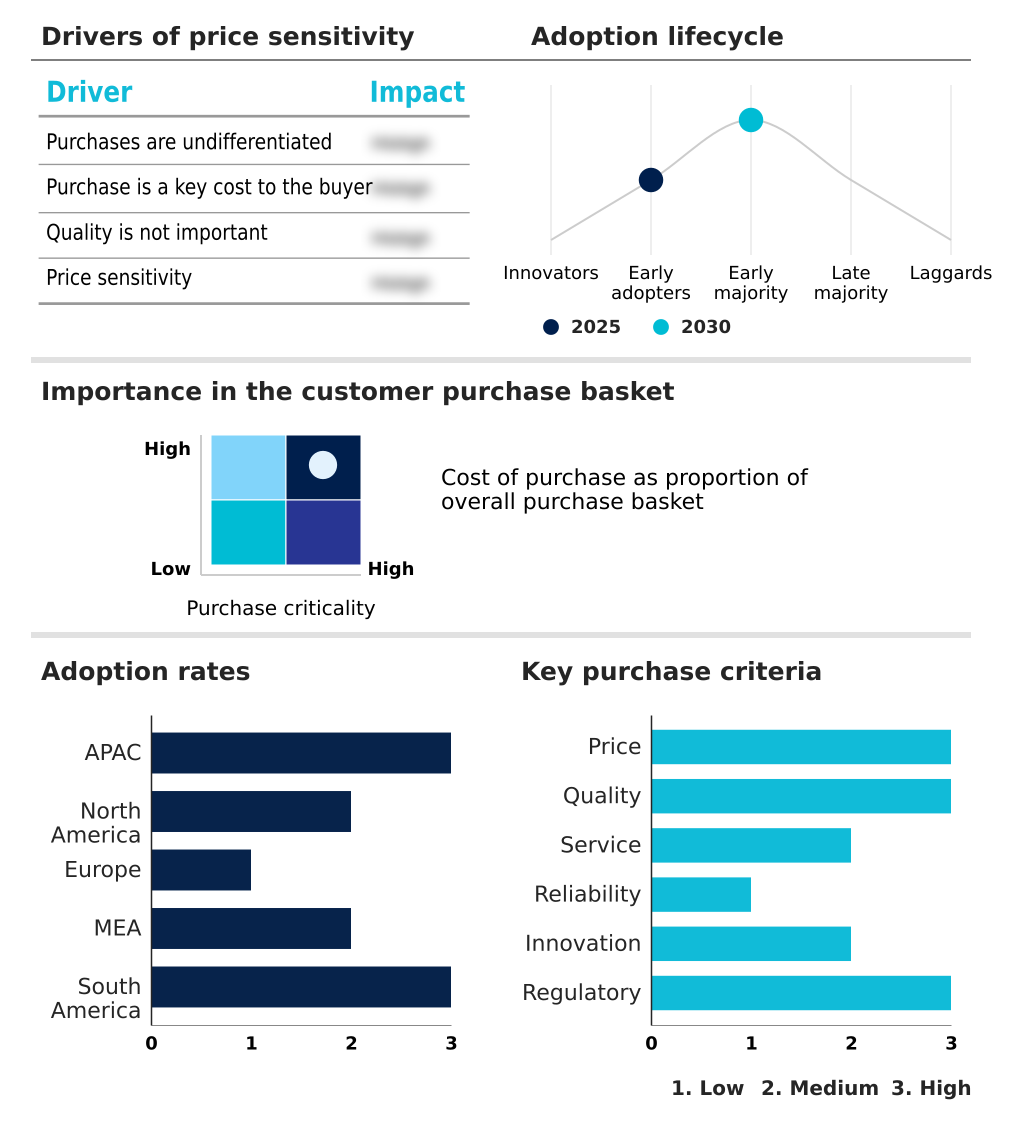
Customer Landscape of Formic Acid Industry
Competitive Landscape
Companies are implementing various strategies, such as strategic alliances, formic acid market forecast, partnerships, mergers and acquisitions, geographical expansion, and product/service launches, to enhance their presence in the industry.
Asahi Kasei Corp. - Core offerings include high-purity formic acid, serving critical roles as a preservative and processing agent across industrial, agricultural, and pharmaceutical applications, meeting diverse quality specifications.
The industry research and growth report includes detailed analyses of the competitive landscape of the market and information about key companies, including:
- Asahi Kasei Corp.
- BASF SE
- Cellmark AB
- China National Chemical Corp. Ltd.
- Eastman Chemical Co.
- EMCO Dyestuff Pvt. Ltd.
- Hydrite Chemical Co.
- Kemira Oyj
- Luxi Chemical Group Co. Ltd.
- Mudanjiang Fengda Chemical Co. Ltd.
- OXEA GmbH
- Perstorp Holding AB
- Shandong Acid Technology Co. Ltd.
- Thermo Fisher Scientific Inc.
- Tokyo Chemical Co. Ltd.
Qualitative and quantitative analysis of companies has been conducted to help clients understand the wider business environment as well as the strengths and weaknesses of key industry players. Data is qualitatively analyzed to categorize companies as pure play, category-focused, industry-focused, and diversified; it is quantitatively analyzed to categorize companies as dominant, leading, strong, tentative, and weak.
Recent Development and News in Formic acid market
- In October, 2025, Celanese Corp. announced the launch of a new bio-based formic acid product line derived from renewable ethanol feedstocks, targeting applications in paints, inks, and pharmaceutical solvents.
- In November, 2025, Jiangsu SOPO Chemical Co. Ltd. revealed plans to secure significant capital market funding to support the expansion of its chemical production capabilities, including its formic acid capacity.
- In August, 2025, OCOchem entered a partnership with Archer Daniels Midland (ADM) to construct a CO2-to-formate demonstration facility, which will convert biogenic CO2 into sustainable formate molecules for industrial uses like formic acid.
- In June, 2025, BASF SE made its low product carbon footprint formic acid available on its eAuction digital procurement platform in China, enhancing supply chain transparency for customers.
Dive into Technavio’s robust research methodology, blending expert interviews, extensive data synthesis, and validated models for unparalleled Formic Acid Market insights. See full methodology.
| Market Scope | |
|---|---|
| Page number | 301 |
| Base year | 2025 |
| Historic period | 2020-2024 |
| Forecast period | 2026-2030 |
| Growth momentum & CAGR | Accelerate at a CAGR of 6.1% |
| Market growth 2026-2030 | USD 713.5 million |
| Market structure | Fragmented |
| YoY growth 2025-2026(%) | 5.4% |
| Key countries | China, Japan, India, South Korea, Australia, Indonesia, US, Canada, Mexico, Germany, UK, France, Italy, Spain, The Netherlands, Saudi Arabia, UAE, South Africa, Israel, Turkey, Brazil, Argentina and Colombia |
| Competitive landscape | Leading Companies, Market Positioning of Companies, Competitive Strategies, and Industry Risks |
Research Analyst Overview
- The global formic acid market 2026-2030 is advancing through a synthesis of traditional industrial demand and innovative, sustainable production methodologies. Core applications such as its use as a silage additive, tanning agent, and finishing agent in the leather and textile sectors provide a stable demand base.
- The chemical's function as a ph control agent, antibacterial agent, and reducing agent is fundamental to these processes. Meanwhile, the industry is undergoing a significant transformation driven by the adoption of bio-based production and carbon utilization technologies.
- This shift from conventional methanol feedstock and carbon monoxide routes toward electrocatalysis and other green methods is a critical boardroom consideration, influencing capital expenditure on new facilities. Producers are developing specialized grades, including industrial grade, pharmaceutical grade, and food grade, to cater to diverse end-users.
- The production of formate esters, methanamide production, and diethyl formamide relies on formic acid as a key chemical intermediate. Its role as an acidulant with biocidal properties, a descaling agent, and a deicing fluid further broadens its utility.
- Innovations around formic acid as a hydrogen carrier and its use in organic synthesis with esterification catalysts are opening new high-value opportunities, with some advanced processes improving yields by over 10%.
What are the Key Data Covered in this Formic Acid Market Research and Growth Report?
-
What is the expected growth of the Formic Acid Market between 2026 and 2030?
-
USD 713.5 million, at a CAGR of 6.1%
-
-
What segmentation does the market report cover?
-
The report is segmented by Distribution Channel (Offline, and Online), End-user (Agriculture and animal feed, Leather, Textile, Chemicals and pharmaceuticals, and Others), Grade Type (Industrial grade, Pharmaceutical grade, and Food grade) and Geography (APAC, North America, Europe, Middle East and Africa, South America)
-
-
Which regions are analyzed in the report?
-
APAC, North America, Europe, Middle East and Africa and South America
-
-
What are the key growth drivers and market challenges?
-
Rising demand from agriculture and animal feed applications, Raw material volatility and supply chain disruptions
-
-
Who are the major players in the Formic Acid Market?
-
Asahi Kasei Corp., BASF SE, Cellmark AB, China National Chemical Corp. Ltd., Eastman Chemical Co., EMCO Dyestuff Pvt. Ltd., Hydrite Chemical Co., Kemira Oyj, Luxi Chemical Group Co. Ltd., Mudanjiang Fengda Chemical Co. Ltd., OXEA GmbH, Perstorp Holding AB, Shandong Acid Technology Co. Ltd., Thermo Fisher Scientific Inc. and Tokyo Chemical Co. Ltd.
-
Market Research Insights
- The global formic acid market 2026-2030 is defined by a dynamic interplay of industrial demand and sustainability imperatives. The use of formic acid as an antimicrobial feed preservative and for livestock feed hygiene is expanding, with adoption rates in some agricultural regions increasing by over 15% to enhance feed safety.
- Concurrently, the textile industry's shift toward using a biodegradable acidulant and textile dye mordant has improved process efficiency, reducing water consumption by up to 10% in certain dyeing applications. As an industrial cleaning solvent and industrial descaler, it offers superior performance.
- Innovations in producing low-carbon formic acid and green chemical intermediates reflect a market-wide pivot, where using a biomass-derived chemical can lead to significant life-cycle emission reductions. This transition aligns with corporate goals and regulatory pressures, making sustainable tanning chemical and eco-friendly deicer offerings increasingly vital.
We can help! Our analysts can customize this formic acid market research report to meet your requirements.
 RIA -
RIA - 
