Frac Sand Market Size 2025-2029
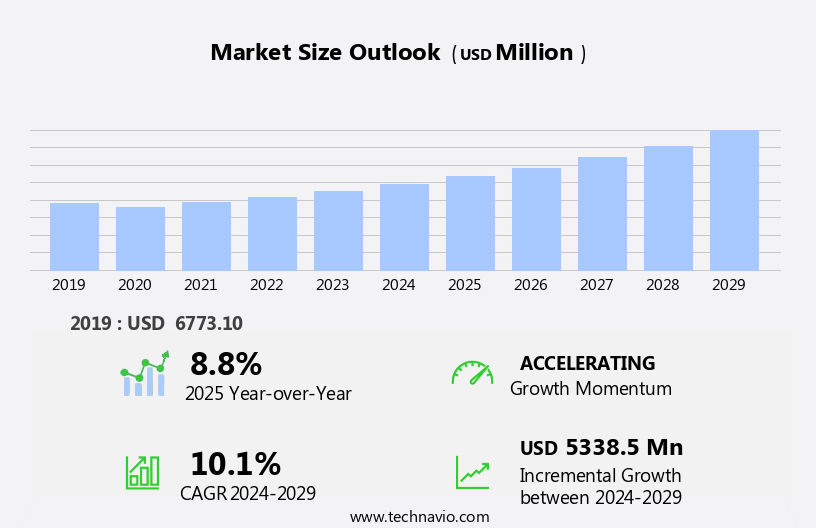
The frac sand market size is forecast to increase by USD 5.34 billion at a CAGR of 10.1% between 2024 and 2029.
- The market is experiencing significant growth driven by the abundance of unconventional oil and gas resources and the increasing petroleum refining activities. Frac sand is a critical component in the hydraulic fracturing process, enabling the extraction of shale gas and oil. The growing demand for shale resources, particularly in the US, is fueling the market's expansion. Moreover, the growing trend towards renewable energy is also creating opportunities for frac sand in the production of certain types of renewable energy, such as geothermal and solar power. However, the market is not without challenges. The increasing dependency on renewable energy sources and environmental concerns related to sand mining and transportation are potential threats. Renewable energy sources, such as wind and solar, are gaining popularity, leading to a decrease in the demand for traditional energy sources.
- Additionally, the environmental impact of sand mining and transportation, including water usage and greenhouse gas emissions, is a significant concern for regulators and stakeholders. Companies in the market must navigate these challenges effectively to capitalize on the growth opportunities. Strategies such as investing in sustainable mining practices, improving logistics and transportation efficiency, and diversifying into renewable energy applications can help companies stay competitive and thrive in this dynamic market.
What will be the Size of the Frac Sand Market during the forecast period?
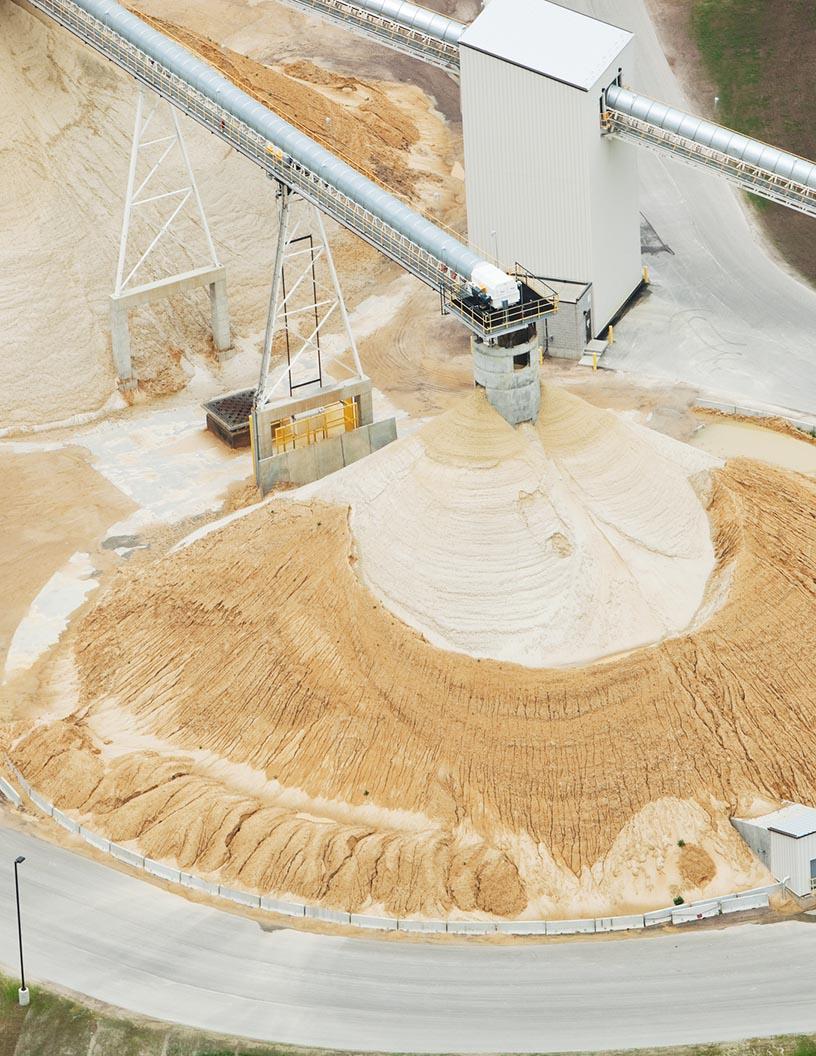
- The market, a crucial component of hydraulic fracturing operations in the petroleum industry, primarily revolves around the production and supply of high-purity quartz sand. This market has gained significant traction due to the increasing focus on unconventional resources, such as shale reserves, for oil and gas extraction. Hydraulic fracturing, also known as fracking, relies on frac sand as a proppant material to maintain reservoir pressure and facilitate the flow of hydrocarbons. The market is a critical component of the hydraulic fracturing process in the petroleum industry, particularly In the development of shale gas. The mining sector plays a vital role in the production of frac sand, with various mining processes used to extract and process the sand to meet the stringent requirements of the oil field services sector.
- Sand logistics and sand processing are essential aspects of the market, ensuring the timely delivery of high-quality sand to hydraulic fracturing sites. The overall market size is substantial, with continued growth expected due to the increasing demand for oil and gas, particularly from tight shale formations. The market dynamics remain influenced by factors such as oil consumption, exploration and production activities, and the emergence of new technologies in the mining and oil field services sectors.
How is this Frac Sand Industry segmented?
The frac sand industry research report provides comprehensive data (region-wise segment analysis), with forecasts and estimates in "USD million" for the period 2025-2029, as well as historical data from 2019-2023 for the following segments.
- Method
- Oil exploration
- Natural gas exploration
- Type
- White frac
- Brown frac
- Application
- Hydraulic fracturing
- Foundry casting
- Abrasive blasting
- Glass manufacturing
- Others
- Geography
- North America
- US
- Canada
- Mexico
- Europe
- France
- Germany
- Italy
- UK
- APAC
- China
- India
- Japan
- Middle East and Africa
- South America
- North America
By Method Insights
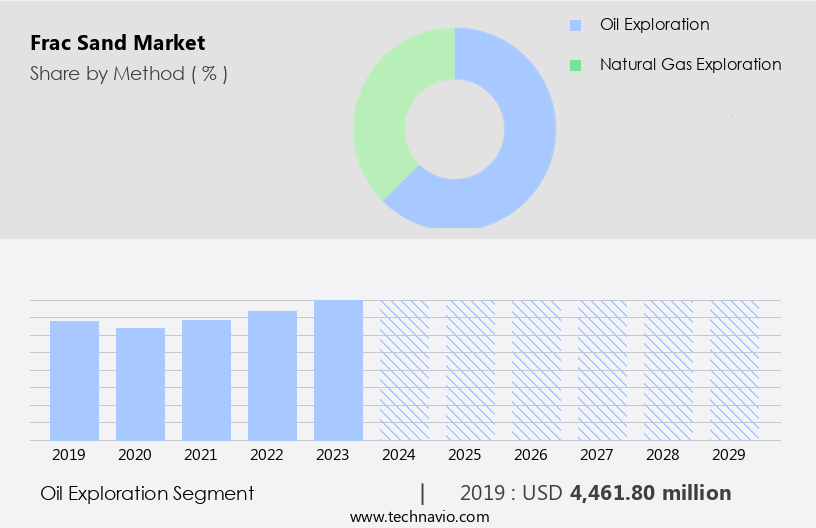
The oil exploration segment is estimated to witness significant growth during the forecast period. The market is primarily driven by the oil exploration segment, which accounts for a significant market share. Oil exploration involves the processes and techniques used to discover potential drilling sites for oil extraction. The increasing global demand for oil, due to its extensive use in various sectors including transportation and industry, is leading to an increase in oil exploration activities. The high consumption of oil, which is a crucial energy source, is a major factor fueling market growth. However, the use of frac sand in hydraulic fracturing and frac services has raised concerns regarding potential health risks, including silica dust exposure, which can lead to respiratory diseases such as silicosis and lung cancer. The oil industry's reliance on frac sand in hydraulic fracturing (fracking) processes for extracting oil from low-permeability reservoirs, such as those found in the Bakken Formation, Marcellus Formation, and Permian Basin, is a significant contributor to the market's expansion.
Get a glance at the market report of share of various segments Request Free Sample
The Oil exploration segment was valued at USD 4.46 billion in 2019 and showed a gradual increase during the forecast period.
Regional Analysis
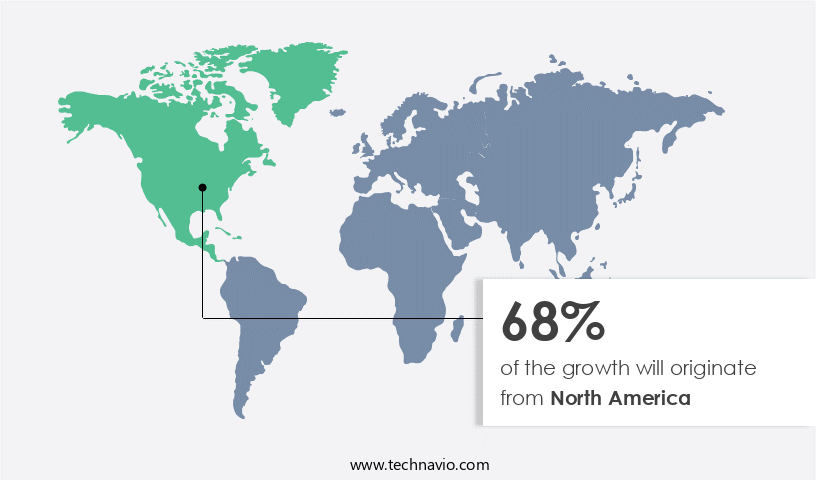
North America is estimated to contribute 68% to the growth of the global market during the forecast period. Technavio's analysts have elaborately explained the regional trends and drivers that shape the market during the forecast period.
For more insights on the market size of various regions, Request Free Sample
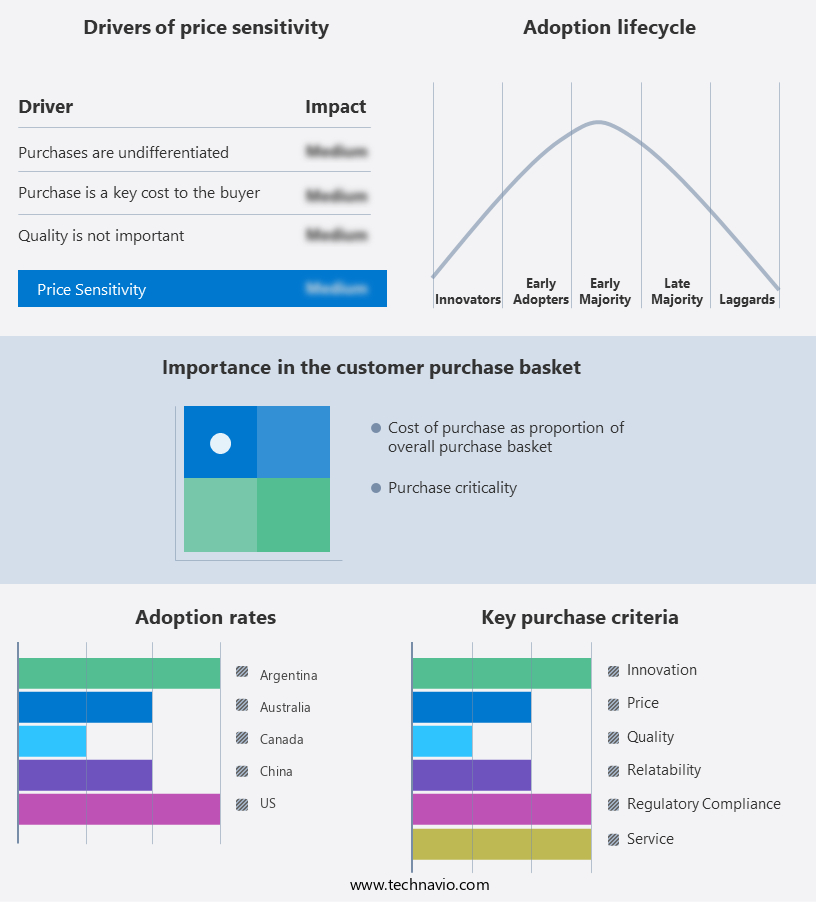
Frac sand is a crucial raw material in hydraulic fracturing (fracking) processes, primarily used in North America due to its abundant unconventional oil and gas reserves. The US, Canada, and Argentina are major consumers, with the highest adoption rates attributed to the prevalence of tight shale formations such as the Marcellus and Bakken Formations. Frac sand, often referred to as high-purity quartz sand, is essential for hydraulic fracturing operations in low-permeability reservoirs, enabling the production of oil and natural gas from previously inaccessible deposits. The mining sector's production capacity expansion is driven by the petroleum industry's economic recovery and increasing natural gas exploration.
Market Dynamics
Our researchers analyzed the data with 2024 as the base year, along with the key drivers, trends, and challenges. A holistic analysis of drivers will help companies refine their marketing strategies to gain a competitive advantage.
What are the key market drivers leading to the rise in the adoption of Frac Sand Industry?
- Abundance of unconventional oil and gas resources is the key driver of the market. Unconventional oil and gas resources, including shale, tight formations, oil sands, and coal bed methane (CBM), have gained significant importance due to the depletion of easily accessible conventional hydrocarbon resources. The primary distinction between conventional and unconventional sources lies in the permeability of the gas-bearing formations. Unconventional hydrocarbon resources lose their natural pressure of flow faster than conventional resources, necessitating the application of advanced techniques to enhance production rates.
- The exploration and production of unconventional energy sources have seen substantial growth in the past decade, driven by the increasing demand for natural gas and crude oil. CBM, found in coal seams or deposits, is another unconventional source of natural gas that has gained prominence. Despite the challenges associated with the production of unconventional hydrocarbons, the market dynamics continue to be favorable, driven by technological advancements and the need for energy security.
What are the market trends shaping the Frac Sand Industry?
- Growing petroleum refining is the upcoming market trend. The market is experiencing notable expansion due to the escalating demand for oil and gas, as well as the petrochemical industry's continuous growth. The US Energy Information Administration (EIA) reports that global consumption of petroleum and other liquid fuels, including gasoline, diesel, kerosene, and liquefied petroleum gas, surpassed 103 million barrels per day (mbpd) in 2024, with projections to reach approximately 104 mbpd. The increasing global population and energy requirements have significantly contributed to the expansion of these industries, subsequently driving the growth of the market during the forecast period.
- Frac sand is also used in the glass manufacturing sector and as specialty sand products. The transportation infrastructure, including railway facilities and trade routes, plays a significant role in managing transportation costs. Despite concerns regarding the ecological footprint, including potential health risks such as lung cancer and methane hydrate emissions, ongoing research focuses on improving mining processes and reducing environmental impact. Companies like Badger Mining Corporation, Hi-Crush Partners, and Fairmount Santrol dominate the market.
What challenges does the Frac Sand Industry face during its growth?
- Increasing dependency on renewable energy sources is a key challenge affecting the industry growth. The global energy landscape is witnessing a significant shift towards renewable sources due to increasing energy demand, environmental concerns, and government initiatives. Renewable energy, including solar, hydropower, and wind, is becoming increasingly popular due to its clean, inexhaustible, less carbon-intensive, and sustainable nature. Governments worldwide are implementing policies to mitigate greenhouse gas emissions and reduce reliance on conventional fuels, which are hazardous to the environment. According to the International Energy Agency, renewables met 30% of the global power demand in 2023, and this share is projected to reach 46% by 2030.
- This trend is expected to continue, driven by technological advancements, subsidies, and regulatory support. The renewable energy market's growth is a positive development for the environment and the global economy, offering a sustainable and viable alternative to traditional energy sources. The mining sector, including companies like Badger Mining Corporation, and Hi-Crush Partners, is investing in production capacity expansion to meet the increasing demand for high-purity quartz sand. The transportation infrastructure, including railway facilities and trade routes, plays a crucial role in the market by reducing transportation costs. The glass manufacturing sector and construction industry also utilize frac sand as raw materials, further expanding the market's scope. Despite the economic recovery, maintenance issues and ecological footprint concerns remain challenges for the market. Methane hydrate and natural gas exploration are emerging areas of interest, offering potential opportunities for market growth.
Exclusive Customer Landscape
The frac sand market forecasting report includes the adoption lifecycle of the market, covering from the innovator's stage to the laggard's stage. It focuses on adoption rates in different regions based on penetration. Furthermore, the frac sand market report also includes key purchase criteria and drivers of price sensitivity to help companies evaluate and develop their market growth analysis strategies.
Customer Landscape
Key Companies & Market Insights
Companies are implementing various strategies, such as strategic alliances, frac sand market forecast, partnerships, mergers and acquisitions, geographical expansion, and product/service launches, to enhance their presence in the industry.
Athabasca Minerals Inc. - The company supplies frac sand, including Prosvita Sand, adhering to stringent quality standards set by the American Petroleum Institute and international organizations for proppant.
The industry research and growth report includes detailed analyses of the competitive landscape of the market and information about key companies, including:
- Athabasca Minerals Inc.
- Atlas Sand Co. LLC
- Badger Mining Corp.
- CARBO Ceramics Inc.
- Chongqing Changjiang River Moulding Material Group Co. Ltd.
- Covia Holdings LLC
- Diversity Technologies Corp.
- Emerge Energy Services LP
- FEECO International Inc.
- Hi Crush Inc.
- Permian Frac Sand LLC
- Preferred Proppants LLC
- SCR Sibelco NV
- Sierra Frac Sand LLC
- SmartSand Inc.
- Source Energy Services Ltd.
- US Silica Holdings Inc.
- Victory Nickel Inc.
- Vista Proppants and Logistics
Qualitative and quantitative analysis of companies has been conducted to help clients understand the wider business environment as well as the strengths and weaknesses of key industry players. Data is qualitatively analyzed to categorize companies as pure play, category-focused, industry-focused, and diversified; it is quantitatively analyzed to categorize companies as dominant, leading, strong, tentative, and weak.
Research Analyst Overview
The market plays a crucial role in the oil and gas industry, particularly in the context of hydraulic fracturing operations. This market involves the production and supply of high-purity quartz sand, which serves as a critical component in the drilling processes of low-permeability reservoirs. The demand for frac sand is driven by the ongoing exploration and production activities in the oil and gas sector, as well as the economic recovery from the global downturn. The mining sector has been a significant contributor to the production of frac sand. The industry employs various methods to extract and process the raw materials, with some companies specializing in the production of brown frac sand, while others focus on white sand.
The production capacity expansion in this sector is a response to the growing demand for frac sand in various industries, including oil and gas and the construction sector. The high prevalence of low-permeability reservoirs, including the Bakken Formation, Marcellus Formation, and Permian Basin, necessitates the use of proppants like frac sand to facilitate the flow of hydrocarbons. The market is characterized by its dynamic nature, influenced by several factors. One of these factors is the behavior of reservoirs, which determines the optimal sand size and characteristics for effective hydraulic fracturing. Another factor is the transportation infrastructure, which plays a critical role in the cost and availability of frac sand. The railway infrastructure and trade routes have been essential in facilitating the transportation of frac sand to various drilling sites.
The ecological footprint of frac sand mining and production has been a subject of debate in recent years. Concerns regarding the potential health risks associated with the mining process and the impact on the environment have led to increased scrutiny of the industry. Some studies have linked the exposure to fine particulate matter from frac sand mining to lung cancer and other respiratory diseases. However, the industry has responded by implementing measures to mitigate these risks and improve the sustainability of their operations. Its usage extends to industries like construction, glass manufacturing, and chemicals. The use of frac sand extends beyond the oil and gas industry. For instance, it is also used in the glass manufacturing sector, where it is essential in the production of high-quality glass products.
The versatility of frac sand has led to the development of specialty sand products, catering to various industries and applications. The market is influenced by several trends, including the increasing use of artificial intelligence (AI) in the mining sector. Pattern recognition algorithms and other AI technologies are being employed to optimize mining operations and improve efficiency. Additionally, the ongoing exploration of methane hydrate reserves could lead to new opportunities for the market, as methane hydrate requires specific sand sizes and characteristics for effective extraction. The market is a vital component of the oil and gas industry, with significant implications for various sectors and applications.
The market is influenced by several factors, including reservoir behavior, transportation infrastructure, and sustainability concerns. The ongoing trends and innovations in the mining sector, such as the use of AI, are expected to shape the future of the market.
|
Market Scope |
|
|
Report Coverage |
Details |
|
Page number |
221 |
|
Base year |
2024 |
|
Historic period |
2019-2023 |
|
Forecast period |
2025-2029 |
|
Growth momentum & CAGR |
Accelerate at a CAGR of 10.1% |
|
Market growth 2025-2029 |
USD 5.34 billion |
|
Market structure |
Fragmented |
|
YoY growth 2024-2025(%) |
8.8 |
|
Key countries |
US, Canada, Mexico, Germany, China, UK, India, Italy, Japan, and France |
|
Competitive landscape |
Leading Companies, Market Positioning of Companies, Competitive Strategies, and Industry Risks |
What are the Key Data Covered in this Frac Sand Market Research and Growth Report?
- CAGR of the Frac Sand industry during the forecast period
- Detailed information on factors that will drive the growth and forecasting between 2025 and 2029
- Precise estimation of the size of the market and its contribution of the industry in focus to the parent market
- Accurate predictions about upcoming growth and trends and changes in consumer behaviour
- Growth of the market across North America, Europe, APAC, Middle East and Africa, and South America
- Thorough analysis of the market's competitive landscape and detailed information about companies
- Comprehensive analysis of factors that will challenge the frac sand market growth of industry companies
We can help! Our analysts can customize this frac sand market research report to meet your requirements.
 RIA -
RIA - 
