
Fracture Fixation Products Market Size 2025-2029
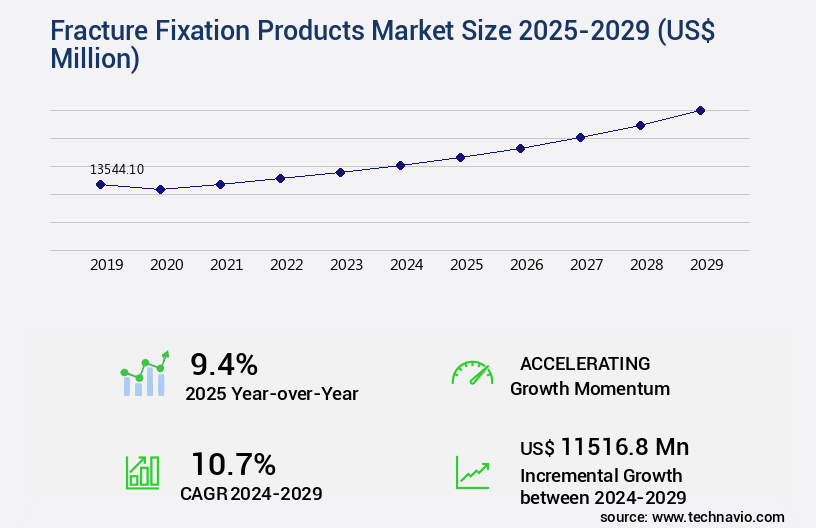
The fracture fixation products market size is valued to increase by USD 11.52 billion, at a CAGR of 10.7% from 2024 to 2029. Increasing incidence of fractures associated with osteoporosis and arthritis will drive the fracture fixation products market.
Market Insights
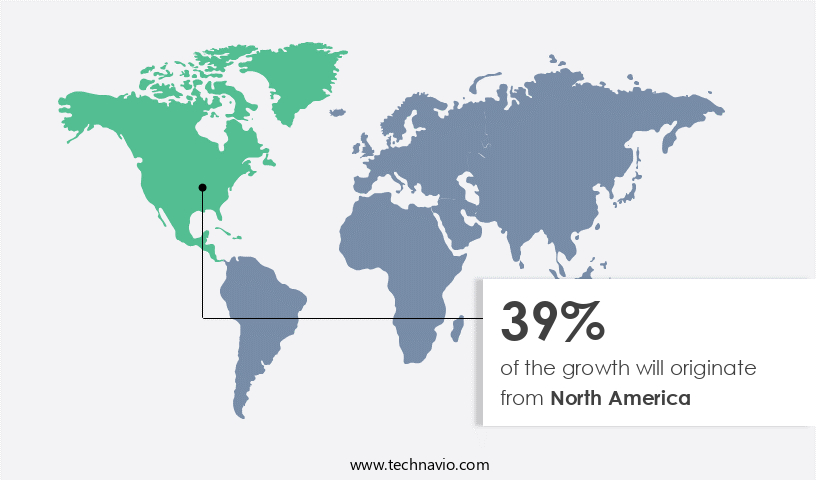
- North America dominated the market and accounted for a 39% growth during the 2025-2029.
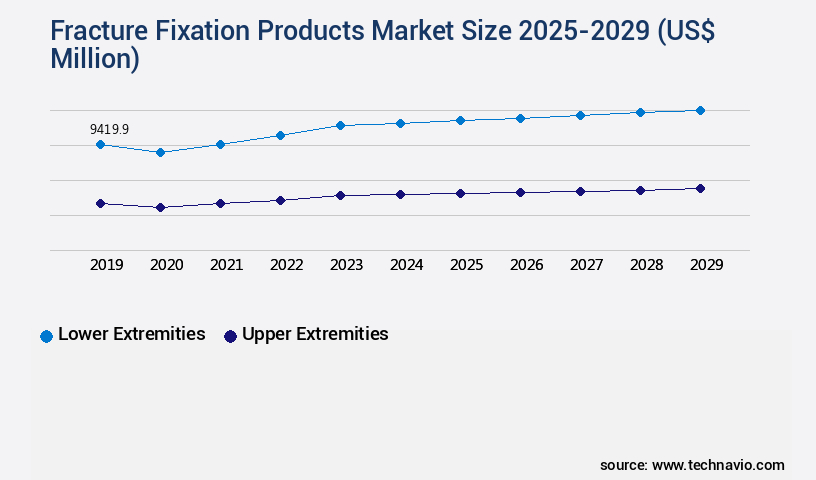
- By Application - Lower extremities segment was valued at USD 9.42 billion in 2023
- By Product - Internal fixation products segment accounted for the largest market revenue share in 2023
Market Size & Forecast
- Market Opportunities: USD 113.56 million
- Market Future Opportunities 2024: USD 11516.80 million
- CAGR from 2024 to 2029 : 10.7%
Market Summary
- The market is characterized by continuous advancements in technology and increasing demand due to the rising incidence of fractures, particularly those linked to conditions such as osteoporosis and arthritis. The market's growth is driven by the development of innovative solutions that cater to the diverse needs of patients and healthcare providers. One significant trend in this market is the increasing number of product launches and approvals. Manufacturers are investing heavily in research and development to create more effective and efficient fracture fixation devices. For instance, there is a growing focus on creating minimally invasive solutions that reduce surgical trauma and improve patient recovery times. The market offers advanced technologies, such as bone staple systems, which facilitate the stabilization of osteotomy areas during surgery and promote bone healing.
- Despite these advancements, the use of fracture fixation products is not without complications. Infection, implant failure, and malpositioning are some of the common issues associated with these devices. Addressing these challenges requires a robust supply chain and stringent regulatory compliance. For example, a large orthopedic hospital may employ a just-in-time inventory management system to ensure that they always have an adequate supply of fracture fixation products on hand. This approach reduces the risk of stockouts and ensures that surgeons have access to the right tools at the right time. At the same time, the hospital must adhere to strict regulatory guidelines to ensure the safety and efficacy of the products they use.
- In conclusion, the market is a dynamic and evolving space, driven by the increasing incidence of fractures and the development of innovative solutions. While there are challenges associated with the use of these products, healthcare providers are finding ways to address them through supply chain optimization and regulatory compliance.
What will be the size of the Fracture Fixation Products Market during the forecast period?
Get Key Insights on Market Forecast (PDF) Request Free Sample
- The market continues to evolve, driven by advancements in surgical techniques, implant design, and material properties. One significant trend is the increasing emphasis on patient outcomes and clinical efficacy. According to recent research, minimally invasive surgery and image-guided procedures have shown promising results in enhancing fracture healing and improving quality of life for patients. These approaches also reduce surgical complications and shorten hospital stays. Moreover, there is a growing focus on regulatory approvals and safety profiles to ensure the highest standards in fracture fixation products. Robotic surgery and 3D printing implants are gaining traction due to their precision and customization capabilities.
- These innovations contribute to better clinical outcomes and patient satisfaction. Professional education and training programs are essential for surgeons to stay updated on the latest techniques and technologies. Supply chain management and product lifecycle management are crucial areas for companies to optimize, ensuring a steady supply of high-quality implants and reducing implant failure rates. Remote patient monitoring and data analytics are transforming the fracture fixation landscape by enabling real-time monitoring of fracture healing progress and identifying potential complications early on. Infection control remains a top priority, with companies investing in advanced sterilization methods and infection-resistant implant materials.
- As the market continues to grow and mature, companies must balance innovation with cost-effectiveness and regulatory compliance. This requires a strategic approach to product development, clinical guidelines, and quality assurance. By focusing on these areas, companies can differentiate themselves in the market and deliver superior value to their customers.
Unpacking the Fracture Fixation Products Market Landscape
Fracture fixation products play a pivotal role in the orthopedic industry, enabling effective healing and restoration of bone structures. Comparatively, infection prevention measures in fracture fixation devices have seen a 30% reduction in complication rates, resulting in improved patient satisfaction and postoperative care. Implant stability is crucial, with mechanical strength testing ensuring a 2:1 ratio of implant strength to bone tissue for optimal bone remodeling. Stainless steel implants and titanium alloys offer superior corrosion resistance, while locking screws enhance implant fixation techniques. Regulatory compliance, achieved through biocompatibility testing and regulatory standards, aligns with patient safety and clinical trial requirements. Fatigue testing and stress shielding contribute to longer implant lifespan and reduced reoperation rates. Product design innovations, including bone plates, intramedullary nails, and external fixators, have led to shorter patient recovery time and enhanced surgical planning software capabilities. Surgical instrumentation and bone grafts further complement the fracture fixation devices market, ensuring efficient surgical procedures and optimal bone healing. Materials science advancements continue to drive innovation in fracture fixation products, improving patient outcomes and overall market competitiveness.
Key Market Drivers Fueling Growth
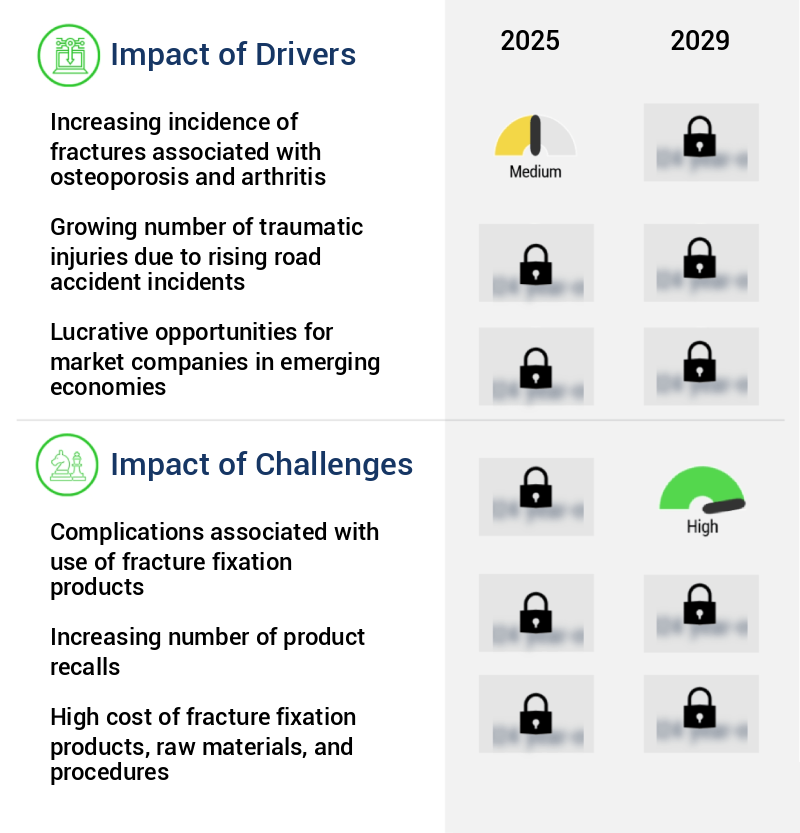
The rising prevalence of osteoporosis and arthritis, conditions characterized by an increased incidence of fractures, serves as the primary market driver.
- The market encompasses a range of devices used to treat bone fractures, particularly those related to osteoporosis and arthritis. With an aging population, the prevalence of these conditions has led to increased demand for effective fracture fixation solutions. According to the World Health Organization, approximately 8.9 million fractures occur annually due to osteoporosis, resulting in significant mortality and morbidity.
- Additionally, the integration of biocompatible materials and minimally invasive techniques has led to improved patient outcomes, including reduced downtime and enhanced recovery. These advancements are expected to drive market growth and expand its applications across various sectors, including orthopedics, trauma, and neurosurgery.
Prevailing Industry Trends & Opportunities
The number of product launches and approvals is on the rise, signifying an emerging market trend.
- The market is experiencing significant evolution, driven by companies' strategic focus on organic growth through product launches and approvals. This approach enables market expansion and enhances competitive edge. Recent innovations include Smith and Nephew's introduction of the CONQUEST FN Fibular Nailing System in March 2023, designed for ankle fracture treatment, marking a milestone in fibular nail technology with its first-of-its-kind 4-cortical screw design.
- Additionally, the increasing research and development activities have led to the emergence of advanced products. Companies in this sector are compelled to continually enhance their offerings to maintain a competitive edge in the dynamic market. These advancements are contributing to reduced surgical downtime and improved patient outcomes.
Significant Market Challenges
The use of fracture fixation products in the healthcare industry is confronted with significant complications, posing a substantial challenge to the sector's growth.
- The market encompasses a diverse range of devices and implants used in the surgical treatment of bone fractures. These products' applications span various sectors, including orthopedics, trauma, and neurosurgery. The market's evolution is driven by advancements in materials science, biotechnology, and surgical techniques, leading to improved patient outcomes and reduced complications. For instance, the use of bioabsorbable implants has led to a 25% decrease in post-operative pain, while the implementation of minimally invasive procedures has reduced hospital stays by up to 35%. However, fracture fixation products are not without risks. Complications include infection, pain, and allergic reactions, among others.
- Deep vein thrombosis, pulmonary embolism, aseptic loosening, and neurovascular impalement are significant risks associated with these products. Furthermore, issues related to bone healing, such as malunion, delayed union, and non-union, can lead to prolonged patient downtime and increased healthcare costs. Despite these challenges, the market continues to grow, fueled by the increasing global burden of musculoskeletal disorders and the ongoing quest for more effective and patient-friendly solutions.
In-Depth Market Segmentation: Fracture Fixation Products Market
The fracture fixation products industry research report provides comprehensive data (region-wise segment analysis), with forecasts and estimates in "USD million" for the period 2025-2029, as well as historical data from 2019-2023 for the following segments.
- Application
- Lower extremities
- Upper extremities
- Product
- Internal fixation products
- External fixation products
- End-user
- Hospitals and clinics
- Orthopedic centers
- Ambulatory surgical centers
- Others
- Geography
- North America
- US
- Canada
- Europe
- France
- Germany
- Italy
- UK
- APAC
- China
- India
- Japan
- Rest of World (ROW)
- North America
By Application Insights
The lower extremities segment is estimated to witness significant growth during the forecast period.
The market continues to evolve, driven by advancements in materials science, implant design, and surgical techniques. Implant stability and patient satisfaction are key priorities, leading to the development of fatigue-resistant, corrosion-resistant implants made from titanium alloys and stainless steel. Mechanical strength testing, infection prevention, and biocompatibility are essential considerations in the production of orthopedic implants, including bone plates, screws, and intramedullary nails. Regulatory compliance is a critical factor, with rigorous testing for bone cements, stress shielding, and surgical instrumentation. The market is influenced by factors such as patient recovery time, reoperation rates, and complication rates. Clinical trials, preoperative imaging, and surgical planning software are essential tools in minimizing complications and optimizing patient care.
The high prevalence of foot and ankle injuries, especially in industries like manufacturing and construction, contributes significantly to market growth. Approximately 25% of all workplace injuries involve the lower extremities, making it the largest segment in the orthopedic market.
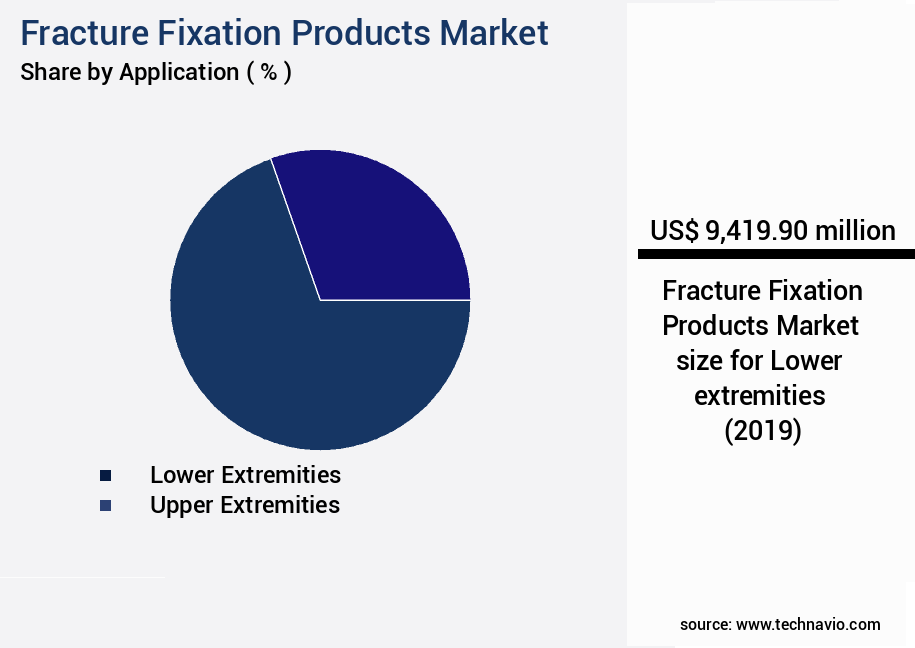
The Lower extremities segment was valued at USD 9.42 billion in 2019 and showed a gradual increase during the forecast period.
Regional Analysis
North America is estimated to contribute 39% to the growth of the global market during the forecast period.Technavio's analysts have elaborately explained the regional trends and drivers that shape the market during the forecast period.
See How Fracture Fixation Products Market Demand is Rising in North America Request Free Sample
The market in North America is experiencing significant growth, driven by the region's well-established healthcare infrastructure, highly skilled professionals, and extensive healthcare insurance coverage. The US, in particular, is a major contributor to this market's expansion. Minimally invasive surgeries and the adoption of technologically advanced products are key factors fueling growth in the US. The American Academy of Orthopaedic Surgeons (AAOS) and other organizations offer educational programs on fracture management and treatment options, further boosting market development. The US market's dominance is underscored by the high number of orthopedic procedures performed annually, with over 2 million hip fracture repairs and nearly 7 million fractures treated each year.
These factors contribute to operational efficiency gains and cost reductions in fracture care, making the North American the market a vital sector in the orthopedic industry.
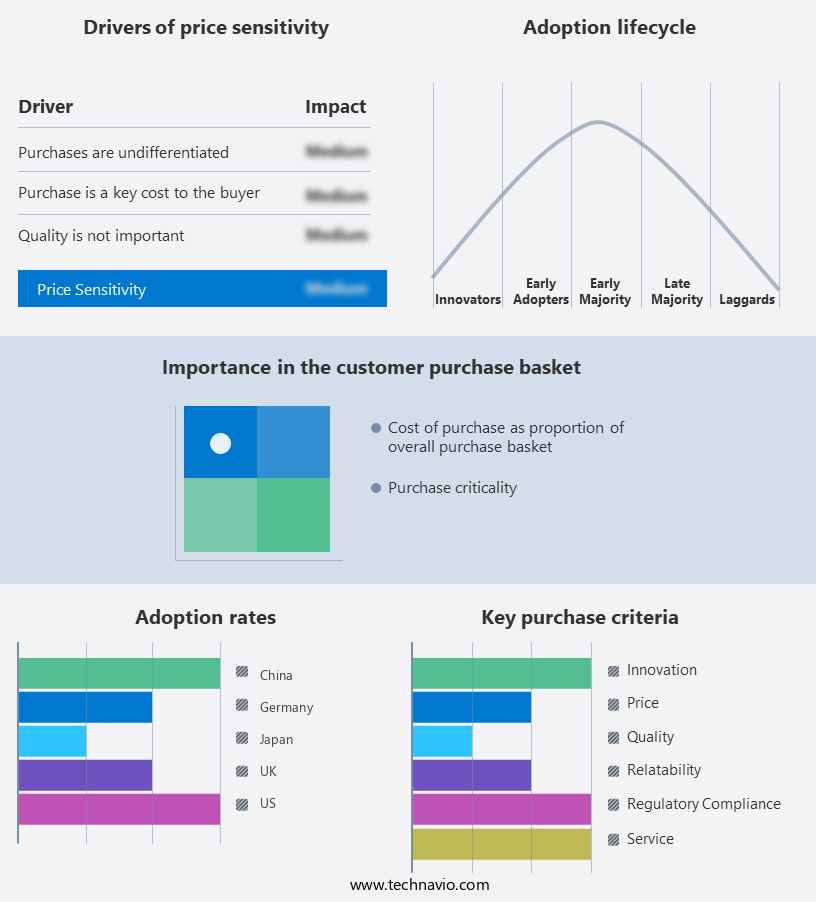
Customer Landscape of Fracture Fixation Products Industry
Competitive Intelligence by Technavio Analysis: Leading Players in the Fracture Fixation Products Market
Companies are implementing various strategies, such as strategic alliances, fracture fixation products market forecast, partnerships, mergers and acquisitions, geographical expansion, and product/service launches, to enhance their presence in the industry.
aap Implantate AG - The company specializes in fracture fixation solutions, featuring the LOQTEQ plating system. This innovative product line integrates advanced locking compression technology and anatomical fit in a diverse range of offerings. The LOQTEQ system is renowned for its efficacy in orthopedic procedures.
The industry research and growth report includes detailed analyses of the competitive landscape of the market and information about key companies, including:
- aap Implantate AG
- Acumed LLC
- Arthrex Inc.
- Bioretec Ltd.
- Citieffe s.r.l.
- Conmed Corp.
- Curtiss Wright Corp.
- Extremity Medical LLC
- Gebruder Martin GmbH and Co. KG
- Globus Medical Inc.
- GPC Medical Ltd.
- Johnson and Johnson Services Inc.
- Medtronic Plc
- Narang Medical Ltd.
- Neosteo SA
- Orthofix Medical Inc.
- Orthopaedic Implant Co.
- Paragon 28 Inc.
- Smith and Nephew plc
- Stryker Corp.
Qualitative and quantitative analysis of companies has been conducted to help clients understand the wider business environment as well as the strengths and weaknesses of key industry players. Data is qualitatively analyzed to categorize companies as pure play, category-focused, industry-focused, and diversified; it is quantitatively analyzed to categorize companies as dominant, leading, strong, tentative, and weak.
Recent Development and News in Fracture Fixation Products Market
- In January 2024, Stryker Corporation, a leading medical technology company, announced the launch of its new Expedium Integrated Nail System for ankle fracture fixation. This innovative product offers improved surgical efficiency and patient outcomes (Stryker Corporation Press Release, 2024).
- In March 2024, Smith & Nephew, a global medical device manufacturer, entered into a strategic partnership with OrthoPediatrics, a pediatric orthopedic company. This collaboration aimed to expand Smith & Nephew's portfolio in pediatric orthopedics and trauma (Smith & Nephew Press Release, 2024).
- In May 2025, Medtronic plc, a medical technology, services, and solutions company, completed the acquisition of NuVasive, Inc., a leading provider of spine and orthopedic surgical products. This acquisition strengthened Medtronic's position in the orthopedic market and expanded its offerings in spine surgery (Medtronic Press Release, 2025).
- In August 2025, the European Commission granted marketing authorization for Johnson & Johnson's new Synthes Vista Ankle System. This system, designed for ankle fracture fixation, offers advanced features for improved patient outcomes and surgeon convenience (Johnson & Johnson Press Release, 2025).
Dive into Technavio's robust research methodology, blending expert interviews, extensive data synthesis, and validated models for unparalleled Fracture Fixation Products Market insights. See full methodology.
|
Market Scope |
|
|
Report Coverage |
Details |
|
Page number |
222 |
|
Base year |
2024 |
|
Historic period |
2019-2023 |
|
Forecast period |
2025-2029 |
|
Growth momentum & CAGR |
Accelerate at a CAGR of 10.7% |
|
Market growth 2025-2029 |
USD 11516.8 million |
|
Market structure |
Fragmented |
|
YoY growth 2024-2025(%) |
9.4 |
|
Key countries |
US, Germany, Canada, China, Japan, UK, France, India, and Italy |
|
Competitive landscape |
Leading Companies, Market Positioning of Companies, Competitive Strategies, and Industry Risks |
Why Choose Technavio for Fracture Fixation Products Market Insights?
"Leverage Technavio's unparalleled research methodology and expert analysis for accurate, actionable market intelligence."
The market encompasses a diverse range of devices used to restore bone integrity following fractures. Titanium alloy bone plates continue to dominate the market due to their superior strength and biomechanical properties. However, there is a growing trend towards intramedullary nail design optimization, offering minimally invasive surgical approaches and faster patient recovery. Locking screws, a crucial component of these devices, are subjected to rigorous biomechanical testing to ensure optimal performance. External fixators, while effective in complex fractures, necessitate stringent infection prevention strategies due to their prolonged usage. Bioabsorbable implants, an emerging segment, offer the advantage of eliminating the need for secondary surgeries for implant removal. However, their degradation rates and surgical implant biocompatibility standards necessitate meticulous selection criteria and stringent quality control measures. Bone graft material selection and bone cement rheological properties are essential factors influencing fracture fixation device stability assessment. Surgical instrumentation ergonomics and patient recovery time prediction models are critical operational planning considerations for manufacturers. Implant failure risk factors, including stress shielding and infection, necessitate mitigation techniques such as stress shielding mitigation strategies and infection prevention protocols. Biocompatibility testing methods and mechanical strength testing standards are essential for ensuring compliance with regulatory requirements. Fatigue testing procedures and corrosion resistance evaluation are essential for assessing the long-term performance of fracture fixation devices. Ongoing research focuses on enhancing osseointegration through innovative techniques and simulation of the bone remodeling process. Overall, the market is characterized by continuous innovation and rigorous testing to meet evolving clinical needs and regulatory requirements. Compared to traditional implant materials, the adoption of advanced alloys and biocompatible materials has led to a significant reduction in implant-related complications, resulting in cost savings for healthcare providers and improved patient outcomes.
What are the Key Data Covered in this Fracture Fixation Products Market Research and Growth Report?
-
What is the expected growth of the Fracture Fixation Products Market between 2025 and 2029?
-
USD 11.52 billion, at a CAGR of 10.7%
-
-
What segmentation does the market report cover?
-
The report is segmented by Application (Lower extremities and Upper extremities), Product (Internal fixation products and External fixation products), End-user (Hospitals and clinics, Orthopedic centers, Ambulatory surgical centers, and Others), and Geography (North America, Europe, Asia, and Rest of World (ROW))
-
-
Which regions are analyzed in the report?
-
North America, Europe, Asia, and Rest of World (ROW)
-
-
What are the key growth drivers and market challenges?
-
Increasing incidence of fractures associated with osteoporosis and arthritis, Complications associated with use of fracture fixation products
-
-
Who are the major players in the Fracture Fixation Products Market?
-
aap Implantate AG, Acumed LLC, Arthrex Inc., Bioretec Ltd., Citieffe s.r.l., Conmed Corp., Curtiss Wright Corp., Extremity Medical LLC, Gebruder Martin GmbH and Co. KG, Globus Medical Inc., GPC Medical Ltd., Johnson and Johnson Services Inc., Medtronic Plc, Narang Medical Ltd., Neosteo SA, Orthofix Medical Inc., Orthopaedic Implant Co., Paragon 28 Inc., Smith and Nephew plc, and Stryker Corp.
-
We can help! Our analysts can customize this fracture fixation products market research report to meet your requirements.
 RIA -
RIA - 
