Freeze Dried Coffee Market Size 2025-2029
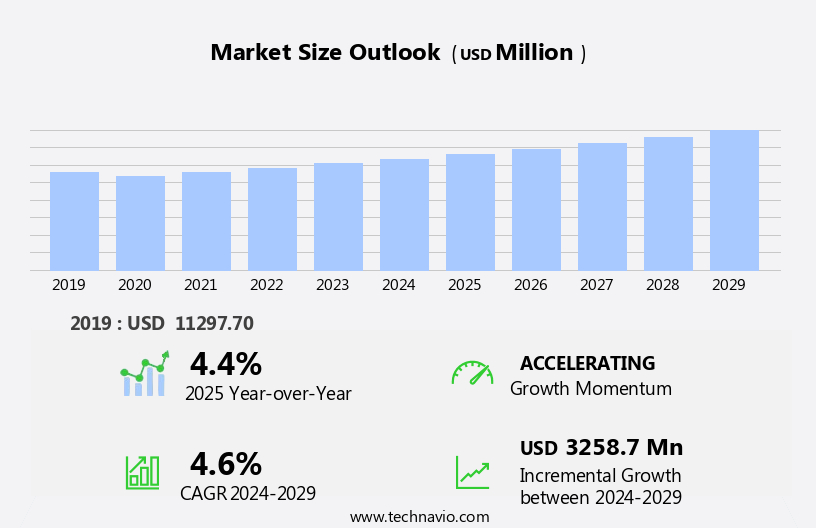
The freeze dried coffee market size is forecast to increase by USD 3.26 billion at a CAGR of 4.6% between 2024 and 2029.
- The market is experiencing significant growth, driven by the expansion of cafe chains globally and the increasing popularity of gourmet coffee. This trend is particularly notable in regions with a high coffee consumption rate, such as North America and Europe. However, the market faces challenges due to the rising price of coffee beans, which can impact profitability for manufacturers and suppliers. To capitalize on this market opportunity, companies should focus on innovation and differentiation, such as offering unique flavors or sustainable sourcing practices. Moreover, the coffee packaging plays a crucial role in preserving the coffee's aroma and shelf life. Coffee vending machines cater to the demand for hot coffee in various settings, including offices and public spaces.
- In summary, the coffee market encompasses a wide range of segments catering to diverse consumer preferences, including gourmet coffee, travel coffee, disaster preparedness, military coffee, convenience stores, food service, online retail, and various coffee types, such as single-serve, freeze-dried, and soluble coffee. Additionally, exploring alternative production methods or regions with lower coffee bean prices could help mitigate the impact of price fluctuations. Overall, the market presents a compelling opportunity for companies seeking to meet the growing demand for high-quality, convenient coffee solutions. By staying attuned to market trends and addressing the challenges presented by rising coffee bean prices, businesses can effectively navigate this dynamic market landscape.
What will be the Size of the Freeze Dried Coffee Market during the forecast period?
- The freeze-dried coffee market encompasses a range of offerings, from micro-ground coffee to ready-to-drink beverages. Coffee traceability is a significant trend, with consumers seeking transparency regarding the harvest origin and processing methods. Sustainability initiatives, such as Rainforest Alliance and Fair Trade certifications, are influencing purchasing decisions. Coffee additives, like milk and syrups, cater to diverse taste preferences. Innovation in coffee pods science and research continues to unveil new flavor notes and brewing techniques, such as pour-over and cold brew concentrate. Coffee machines, French press, and espresso machines, along with filters and accessories, enable various brewing methods. Coffee blending and quality control ensure consistent product offerings.
- Coffee extracts and certification programs, like organic and fair trade, add value to the market. The market's evolution is driven by evolving consumer preferences, technological advancements, and coffee farming advancements. Coffee terroir and sensory evaluation play a crucial role in determining the unique characteristics of each coffee origin. The market's future growth is expected to be fueled by the increasing popularity of coffee beverages and the expanding coffee accessories market. Coffee cupping and grading are essential components of the coffee industry, ensuring the highest quality standards are met. The market's growth is further supported by the availability of advanced coffee brewing equipment and cold brew makers.
- Overall, the freeze-dried coffee market is a dynamic and evolving industry that caters to diverse consumer preferences and demands. Consumers are increasingly seeking sustainable coffee options, paying close attention to coffee powder quality and caffeine content. Coffee filters also play a role in shaping the brewing experience. Recent consumer insights reveal a strong preference for ethically sourced beans, highlighting the growing demand for sustainability in every aspect of coffee consumption.
How is this Freeze Dried Coffee Industry segmented?
The freeze dried coffee industry research report provides comprehensive data (region-wise segment analysis), with forecasts and estimates in "USD million" for the period 2025-2029, as well as historical data from 2019-2023 for the following segments.
- Distribution Channel
- Offline
- Online
- Flavor
- Optical
- Non-flavored
- Flavored varieties
- Packaging
- Jars
- Sachets
- Pouches
- Bulk packaging
- Geography
- North America
- US
- Canada
- Europe
- France
- Germany
- Italy
- UK
- Middle East and Africa
- APAC
- China
- India
- Japan
- South Korea
- South America
- Rest of World (ROW)
- North America
By Distribution Channel Insights
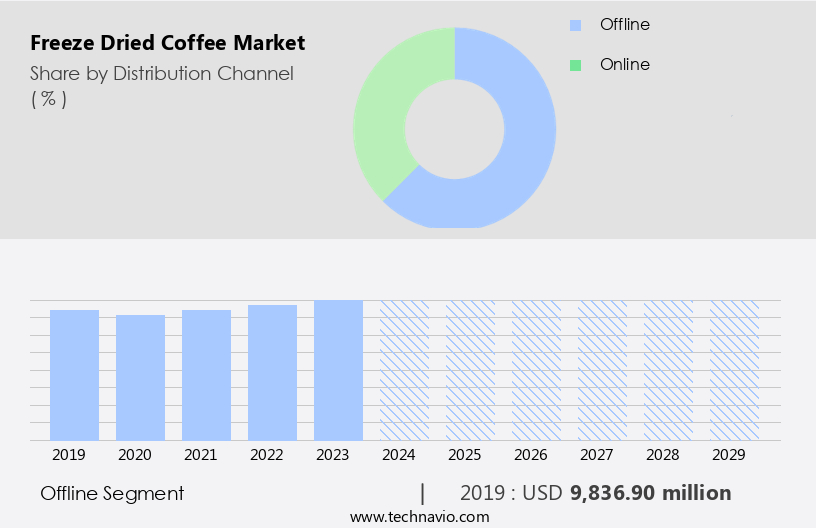
The offline segment is estimated to witness significant growth during the forecast period. In the dynamic coffee market, various segments cater to diverse consumer preferences. Supermarkets and hypermarkets, as prominent offline retail channels, offer a wide range of coffee products from various brands. Consumers value the convenience of selecting their preferred coffee types, making these retailers the go-to choice. Fair trade and organic coffee are popular choices among consumers who prioritize ethical and sustainable sourcing. The rise of private label brands by supermarket and hypermarket chains is a noteworthy trend, potentially driving growth in the freeze-dried coffee segment. Companies expand their market reach by selling distribution rights to other prominent players, thereby increasing their shelf space. Gourmet coffee enthusiasts seek premium, sustainable, and single-origin coffee beans for their unique flavor profiles.
Travelers opt for portable coffee makers and convenient single-serve coffee capsules for their on-the-go needs. Coffee shops and food service industries use coffee concentrate and coffee brewing equipment for large-scale coffee consumption. Military personnel and convenience stores cater to the demand for military coffee and decaf coffee, respectively. Online retailers offer a vast selection of coffee types, including flavored coffee and cold brew coffee, and subscription services for regular deliveries. Coffee lovers also value the nutritional benefits of coffee, such as antioxidants and an energy boost, which contribute to the market's growth. The market is driven by trends like the increasing popularity of private label brands, ethical sourcing, and convenience.
Get a glance at the market report of share of various segments Request Free Sample
The Offline segment was valued at USD 9.84 billion in 2019 and showed a gradual increase during the forecast period.
Regional Analysis
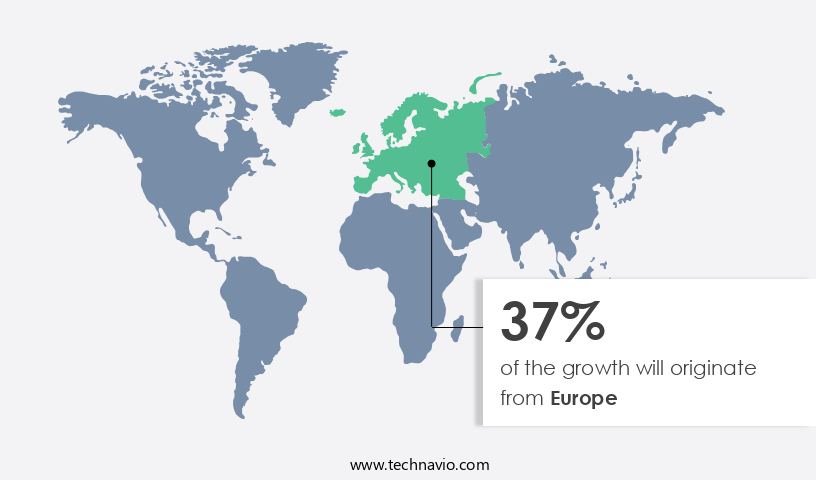
Europe is estimated to contribute 37% to the growth of the global market during the forecast period. Technavio's analysts have elaborately explained the regional trends and drivers that shape the market during the forecast period.
For more insights on the market size of various regions, Request Free Sample
In the global coffee market, instant coffee, particularly freeze-dried varieties, has gained significant traction, especially in Asia Pacific (APAC), where consumer preference for at-home brewing and demand for high-quality coffee solutions are on the rise. The region's large and expanding food and beverage industry, characterized by an increasing number of restaurants and cafes, fuels the market's growth. Freeze-dried coffee offers several advantages, including better flavor profiles and longer shelf life compared to other coffee types. Moreover, it contains phytosterols, which help lower cholesterol levels. Coffee culture continues to evolve, with coffee enthusiasts seeking premium, sustainable, and fair trade coffee blends.
Instant coffee, including single-serve and subscription services, caters to the convenience-driven lifestyle, while portable coffee makers enable outdoor coffee consumption. Coffee's nutritional value, including antioxidants and energy boost, adds to its popularity. Despite the popularity of hot coffee, cold brew and soluble coffee variants cater to diverse consumer preferences. Coffee packaging innovations, such as eco-friendly and airtight containers, ensure optimal coffee flavor and aroma. Coffee shops and convenience stores are major distribution channels, while online retailers offer a wide range of choices for coffee lovers. Coffee consumption continues to be a significant part of daily life, with various brewing methods, flavor profiles, and decaffeinated options catering to diverse tastes.
Market Dynamics
Our researchers analyzed the data with 2024 as the base year, along with the key drivers, trends, and challenges. A holistic analysis of drivers will help companies refine their marketing strategies to gain a competitive advantage.
What are the key market drivers leading to the rise in the adoption of Freeze Dried Coffee Industry?
- The growth of cafe chains globally is the key driver of the market. Coffee's essential role in social interactions has led to the rise of cafes as sophisticated and easily accessible recreational settings. With the increasing urbanization of leisure due to busy work schedules and office-centered lifestyles, cafes offer clean, classy, and respectable alternatives. Current research indicates a growing coffee market, particularly in the form of freeze-dried coffee. This method of coffee production ensures a long shelf life, making it an attractive option for consumers seeking convenience. The freeze-dried coffee market's growth is driven by factors such as its ease of preparation, portability, and consistent taste.
- As coffee continues to be a social lubricant, the demand for convenient and high-quality coffee solutions is expected to increase. The freeze-dried coffee market presents significant opportunities for companies looking to cater to this trend.
What are the market trends shaping the Freeze Dried Coffee Industry?
- The growing popularity of gourmet freeze-dried coffee is the upcoming market trend. The market is experiencing notable growth due to the rising demand for premium, convenient coffee options. Consumers are increasingly seeking high-quality coffee that maintains the rich flavor and aroma of freshly brewed coffee. Freeze-dried coffee meets this need, providing a gourmet experience with the added benefit of extended shelf life. This market caters to a wide range of companies, from established multinational corporations to emerging artisanal brands. Notable players include Nestle and Starbucks, which offer premium freeze-dried coffee under their respective brands.
- Smaller companies, such as Mount Hagen and Cafe Tastle, are also gaining popularity for their organic and specialty blends. The market dynamics are driven by the growing preference for convenience and the desire for a superior coffee experience.
What challenges does the Freeze Dried Coffee Industry face during its growth?
- A rise in coffee bean pricing is a key challenge affecting the industry's growth. The market has witnessed significant price fluctuations due to various factors affecting the coffee bean supply chain. The demand for superior coffee beans, such as Arabica and Robusta, has risen, intensifying competition among suppliers. Simultaneously, adverse weather conditions in major coffee-producing regions like Brazil and Vietnam have resulted in smaller harvests, causing a scarcity of high-quality beans and subsequently higher prices.
- Furthermore, geopolitical tensions and trade disruptions have added to the instability, impacting the availability and pricing of raw materials. Consequently, suppliers have faced challenges in maintaining consistent pricing, leading to market volatility.
Exclusive Customer Landscape
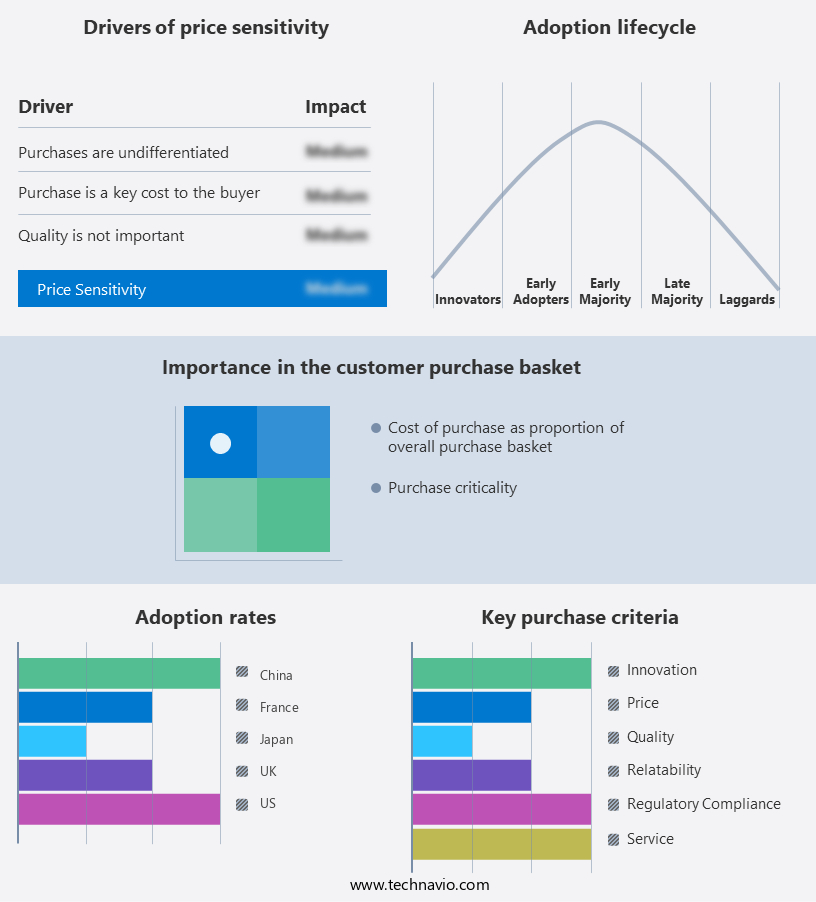
The freeze dried coffee market forecasting report includes the adoption lifecycle of the market, covering from the innovator's stage to the laggard's stage. It focuses on adoption rates in different regions based on penetration. Furthermore, the freeze dried coffee market report also includes key purchase criteria and drivers of price sensitivity to help companies evaluate and develop their market growth analysis strategies.
Customer Landscape
Key Companies & Market Insights
Companies are implementing various strategies, such as strategic alliances, freeze dried coffee market forecast, partnerships, mergers and acquisitions, geographical expansion, and product/service launches, to enhance their presence in the industry.
Colombian Coffee- The company offers freeze dried coffee such as Buendia Instant Coffee.
The industry research and growth report includes detailed analyses of the competitive landscape of the market and information about key companies, including:
- Cafe Altura
- Continental Coffee Pvt. Ltd.
- Giraldo Farms
- JAB Holding Co.
- Mount Hagen Coffee
- Rage Coffee
- Strauss Group Ltd.
- Tastle Coffee
- Tata Sons Pvt. Ltd.
- Tchibo Coffee Service SRL
- The J.M. Smucker Co.
- The Kraft Heinz Co.
- Trung Nguyen Vietnamese Coffee
- Unilever PLC
- WAKA COFFEE INC.
- Woolworths Group Ltd.
Qualitative and quantitative analysis of companies has been conducted to help clients understand the wider business environment as well as the strengths and weaknesses of key industry players. Data is qualitatively analyzed to categorize companies as pure play, category-focused, industry-focused, and diversified; it is quantitatively analyzed to categorize companies as dominant, leading, strong, tentative, and weak.
Research Analyst Overview
The freeze-dried coffee market encompasses a diverse range of products and consumer segments. This market caters to the needs of various demographics, including coffee aficionados, disaster preparedness enthusiasts, and those with active lifestyles. The versatility of freeze-dried coffee makes it an attractive option for numerous applications, such as emergency food supplies, camping, travel, and even gourmet and premium coffee offerings. Shelf-stable food, including coffee beans, has gained significant traction in recent years due to the increasing awareness of food preservation and the convenience it offers. Grocery stores and convenience stores have expanded their offerings to include a wide array of freeze-dried coffee options, catering to the growing demand.
The nutritional value and energy-boosting properties of coffee are essential factors driving the market's growth. Coffee's antioxidant content and its role in enhancing cognitive function and mood further contribute to its popularity. Coffee flavor profiles, which can range from single-origin to blends, have become increasingly important to coffee lovers. The convenience of portable coffee makers and the availability of coffee capsules, pods, and instant coffee have made it easier for consumers to enjoy their favorite beverage anytime, anywhere. Subscription services have also emerged as a popular trend, offering regular deliveries of freshly roasted and freeze-dried coffee beans. The coffee industry's sustainability initiatives, such as fair trade and organic certifications, have influenced the freeze-dried coffee market. Disaster preparedness kits often include shelf-stable coffee and instant coffee for emergencies.
The rise of specialty coffee and artisan coffee has driven innovation in coffee technology and coffee innovation, especially in areas like freeze drying and vacuum drying, which enhance flavor retention and aroma preservation. Consumers seeking convenience foods for outdoor activities and camping coffee now enjoy options like drip coffee, coffee bags, and bulk coffee that align with sustainability practices and use natural ingredients. As single origin beans and varied roast levels appeal to niche markets, brands focus on product differentiation, product marketing, and pricing strategies to strengthen brand loyalty. Insights from consumer trends and lifestyle trends show a growing demand for health and wellness options, driving new product development with high coffee quality, improved coffee extraction, and better water solubility. Meanwhile, digital marketing, social media marketing, and influencer marketing are key to promoting subscription boxes, gathering product reviews, boosting customer satisfaction, and elevating the overall customer experience. Supply chain management and innovation in processing continue to evolve to meet these modern demands.
|
Market Scope |
|
|
Report Coverage |
Details |
|
Page number |
214 |
|
Base year |
2024 |
|
Historic period |
2019-2023 |
|
Forecast period |
2025-2029 |
|
Growth momentum & CAGR |
Accelerate at a CAGR of 4.6% |
|
Market growth 2025-2029 |
USD 3.25 Billion |
|
Market structure |
Fragmented |
|
YoY growth 2024-2025(%) |
4.4 |
|
Key countries |
US, China, Japan, India, Canada, South Korea, UK, Germany, Italy, and France |
|
Competitive landscape |
Leading Companies, Market Positioning of Companies, Competitive Strategies, Industry Risks, market growth, market trends, market growth analysis, market research and growth, market research report, market growth and forecasting, Market forecasting, market report, market forecast |
What are the Key Data Covered in this Freeze Dried Coffee Market Research and Growth Report?
- CAGR of the Freeze Dried Coffee industry during the forecast period
- Detailed information on factors that will drive the growth and forecasting between 2025 and 2029
- Precise estimation of the size of the market and its contribution of the industry in focus to the parent market
- Accurate predictions about upcoming growth and trends and changes in consumer behaviour
- Growth of the market across APAC, Europe, North America, South America, and Middle East and Africa
- Thorough analysis of the market's competitive landscape and detailed information about companies
- Comprehensive analysis of factors that will challenge the freeze dried coffee market growth and forecasting
We can help! Our analysts can customize this freeze dried coffee market research report to meet your requirements.
 RIA -
RIA - 
